 |
|
Making learning and work count
Labour market LIVE from Learning and Work Institute
15 December 2020
- The ONS figure for claimant unemployed is 2,663,700, and has risen by 64,300 on last month, and up by 1.42 million since March, and the claimant rate is 7.4%.
- The ONS figure for 18-24 claimant unemployed is 516,900 in November, up by 281,800 or 119.9% on March.
- Vacancies in November fell back by 66,000 to 557,000 after recovering strongly from the low point of 327,000 in May.
- Unemployment is 1,692,000, up by 68,000 from last month’s published figure (quarterly headline increased by 241,000) and the unemployment rate 4.9%, increased by 0.2 percentage points on last month and has risen by 0.7 percentage points on last quarter.
- The number of workless young people (not in employment, full-time education or training) is 1,005,000, up by 36,000 on the month, representing 14.7% of the youth population, up by 0.6 percentage points on last month.
- Youth unemployment (including students) is 596,000, has risen by 29,000 on the quarter.
- There are 3.2 unemployed people per vacancy.
- The employment rate is 75.2% and fell 0.1 percentage points on last month’s published figure and reduced by 0.5 percentage points in the preferred quarterly measure.
Learning and Work Institute comment
The labour market figures published on 15 December suggests that even with the Coronavirus Job Retention Scheme in place that 'open' unemployment is rising with large numbers of redundancies as the number of furloughed workers declines.
Duncan Melville, Chief Economist at Learning and Work Institute, commented:
Employment fell by 144,000 in the three months to August to October and in the year by 280,000, the largest annual fall in employment since the first three months of 2010. In contrast, the monthly data showed a substantial rise in employment in October of 113,000. However, the timelier HMRC data for November indicated a small fall in the number of employees on payrolls. Unemployment rose substantially by 241,000 in the three months to August
to October, while the monthly data showed a rise of 114,000 in October. Alongside these numbers total hours worked continued to trend up in October and at the end of the month were at around 95% of their pre-pandemic levels.
Rising unemployment and rising working hours reflect a move away from furloughed workers who are formally employed even if they are not doing any hours of work towards 'open' unemployment. This view is supported by the numbers temporarily away from paid work and the numbers being made redundant. The numbers of people temporarily away from paid work continued to trend down and at the end of October stood at 3.6 million workers compared to pre-pandemic levels of around 2.5 million and the peak levels of between eight and nine million seen between mid-April and mid-May.
The number of people reporting redundancy in the last three months in the August to October quarter increased by a record 217,000 on the quarter, to a record high
of 370,000 - well above the levels seen in the aftermath of the 2008 financial crisis. Weekly data show that the number of people reporting redundancy in the last three months had been increasing since June and peaked in mid-September at just over 500,000 and has been declining since then to stand at just under 300,000 at the end of October. This is still around two and a half times the average level of redundancies seen in the first half of 2020.
The data for November this year suggests that the labour market probably deteriorated in this period. The number of vacancies fell in the month compared to October by 11 percent to 557,000 - this followed five months of increasing vacancy levels and probably reflects the impact of the November lockdown deterring employers from taking on new staff. In line with this the claimant count rose by 66,000 in November following a couple of monthly falls.
Looking further forward there are some hopes for an
improving outlook. The rapid development of several apparently effective vaccines, and the beginning of the vaccine rollout, offers the opportunity to bring the pandemic under control in spring and summer of next year. This should reduce the need for social distancing requirements, allowing the economy to bounce-back as 2021 progresses.
However, it remains the case that the outlook looks far from rosy. The Office for Budget Responsibility (OBR) expects unemployment to peak at 2.6 million next year in the April to June quarter even if the UK and the EU agree a trade deal which currently remains far from certain. The lack of a post-Brexit trade deal would deliver a further shock to the economy. The OBR's forecasts suggest that no deal would mean unemployment rising further, peaking at 2.8 million in July to September next year and staying higher for longer than under its central projection. With no deal, the OBR expects unemployment to stay above 2 million
until the first three months of 2024 compared to a year earlier with a trade deal.
With unemployment set to stay at relatively high levels for a number of years, there is a clear need for the Government to institute policies to address this, and particularly to tackle long term unemployment. The announcement of the £2.9 billion Restart programme in the November Spending Review is thus to be welcomed. The details of the programme have yet to be set out. To be effective it must learn from past evidence as to what works: offering a wide range of services which can be flexed and personalised so that the programme addresses individuals' particular needs and ensuring that all can benefit from the programme via a set of minimum universal support services.
Paul Bivand, associate director for statistics and analysis at Learning and Work Institute, said:
The Office for National Statistics have been trying to keep us informed through
difficult circumstances. They have been working with a range of other providers to deliver information that is as high quality as feasible. Nevertheless, the nature of the responses, particularly the Coronavirus Job Retention Scheme that keeps people in employment while, for some, no actual work is possible, has led to some confusion. The fall in self-employment, together with the rise in employee numbers, partly reflects people re-defining their status in the same employment.
Employment fell by 144,000 between May 2019 to July 2020 and August 2020 to October 2020. In the last 12 months employment fell by 280,000.
Unemployment increased by 241,000 between May 2019 to July 2020 and August 2020 to October 2020, and the unemployment rate increased by 0.6 percentage points to 4.9% in the quarter. The experimental weekly figures have been above 5.0% through October.
Economic inactivity (16-64) fell by 2,000 between May 2019 to July 2020 and
August 2020 to October 2020, and the inactivity rate was unchanged at 20.8% in the quarter.
The national claimant count has risen by 64,300. The 'count date' for the claimant count was the 12th of November, early in the second lockdown.
Self-employment fell by 183,000 this quarter. The number of employees increased by 39,000 in the quarter. Involuntary part-time employment increased by 70,000 this quarter to 0.9 million, 11.9% of all part-time workers. The proportion remains much higher than the 7.4% in 2004.
|
 |
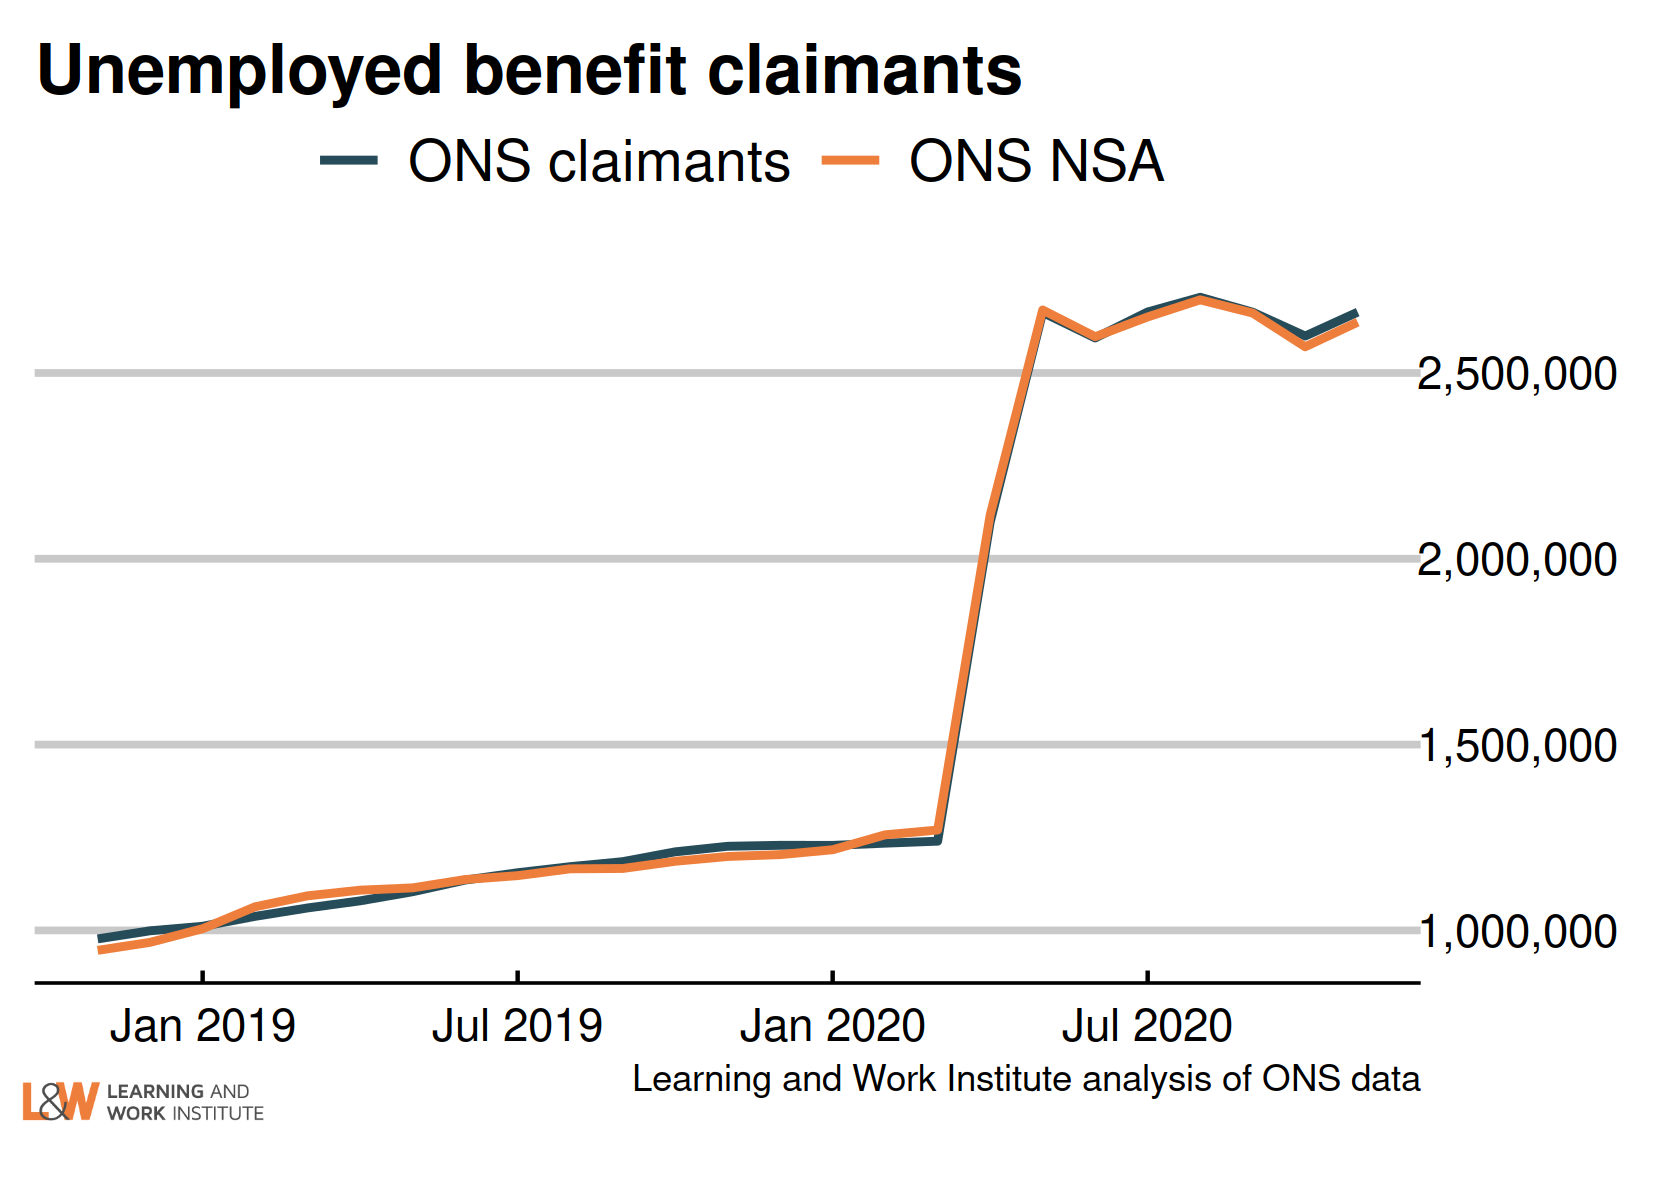
Chart 1: Jobseeker’s Allowance and Universal Credit claimant count
The ONS headline Jobseeker’s Allowance and Universal Credit claimant count rose by 64,340 in November, taking the total to 2,663,710. ONS' claimant count before seasonal adjustment has risen by 66,360 to 2,636,840. This change is directly comparable to the local level claimant count changes published today.
 |
|
Chart 2: UK unemployment (ILO) - the official estimate
The latest unemployment figure is 1,692,000. It has risen by 68,000 from the figure published last month. The unemployment rate rose by 0.1 percentage points to 4.9%.
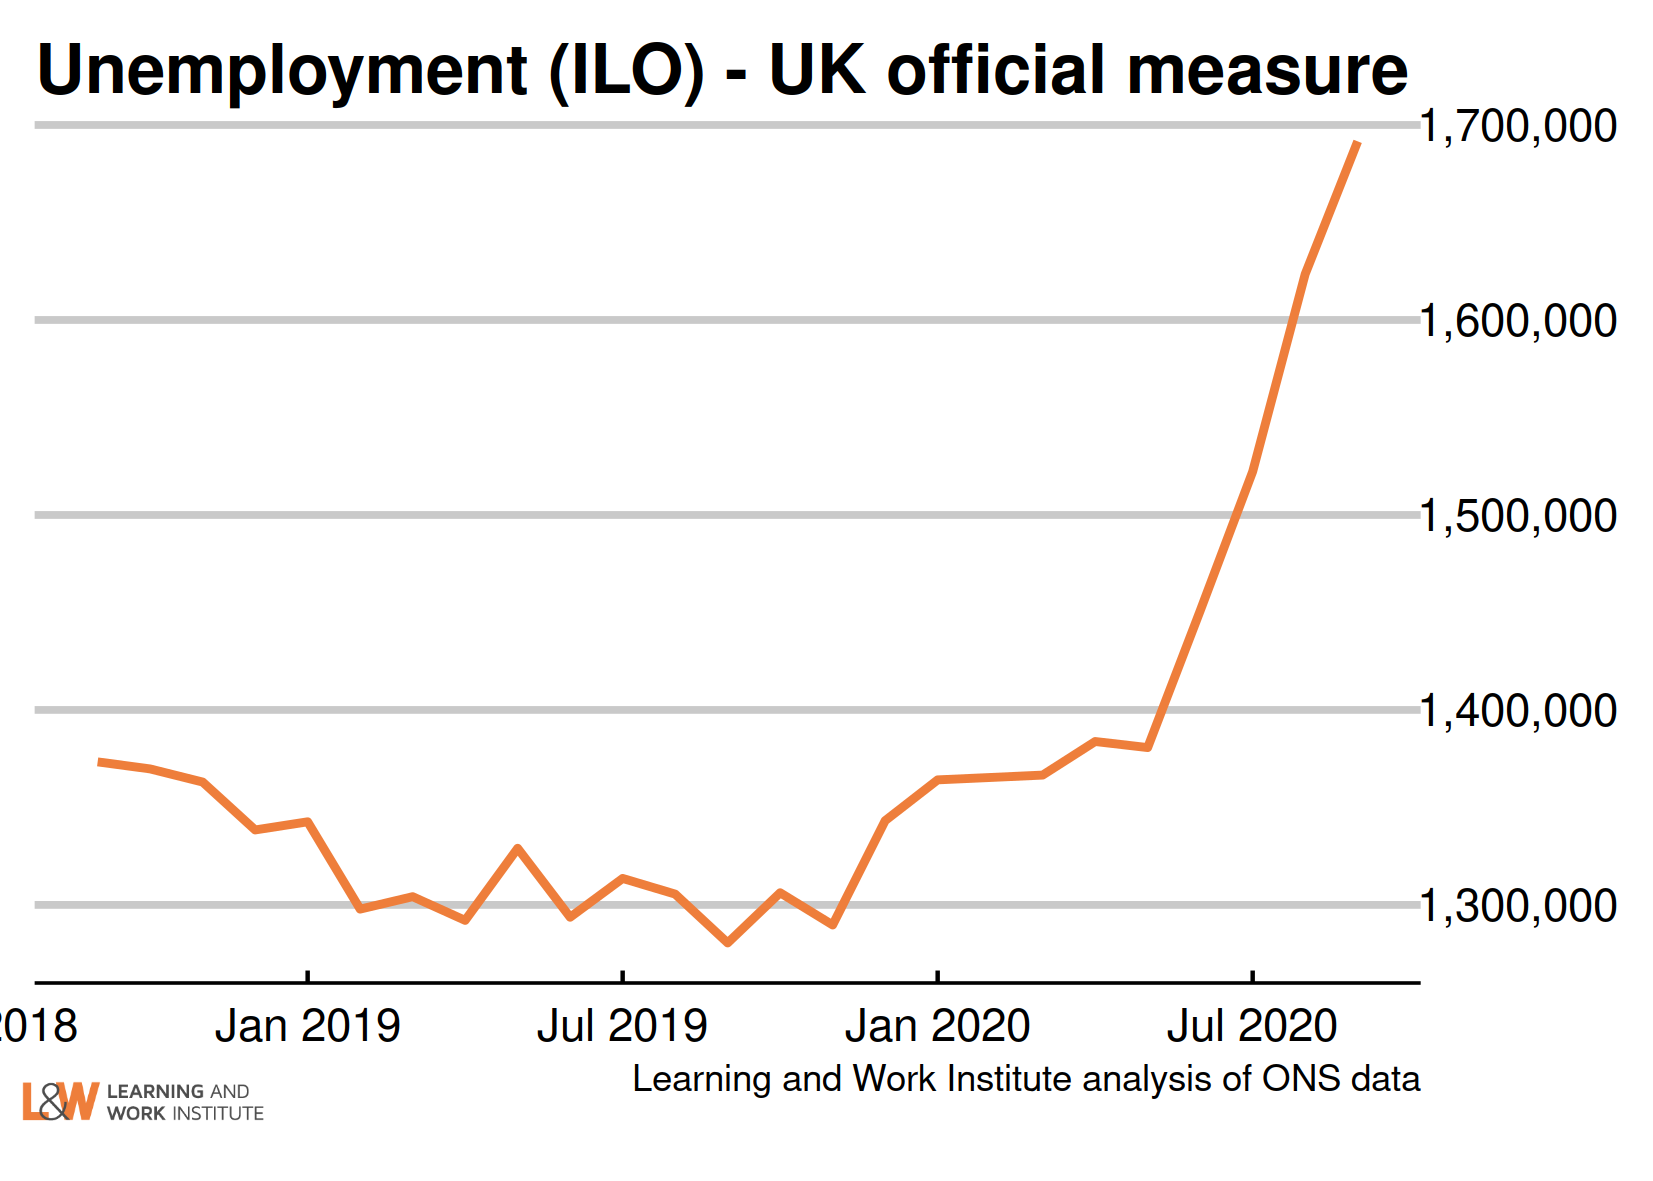
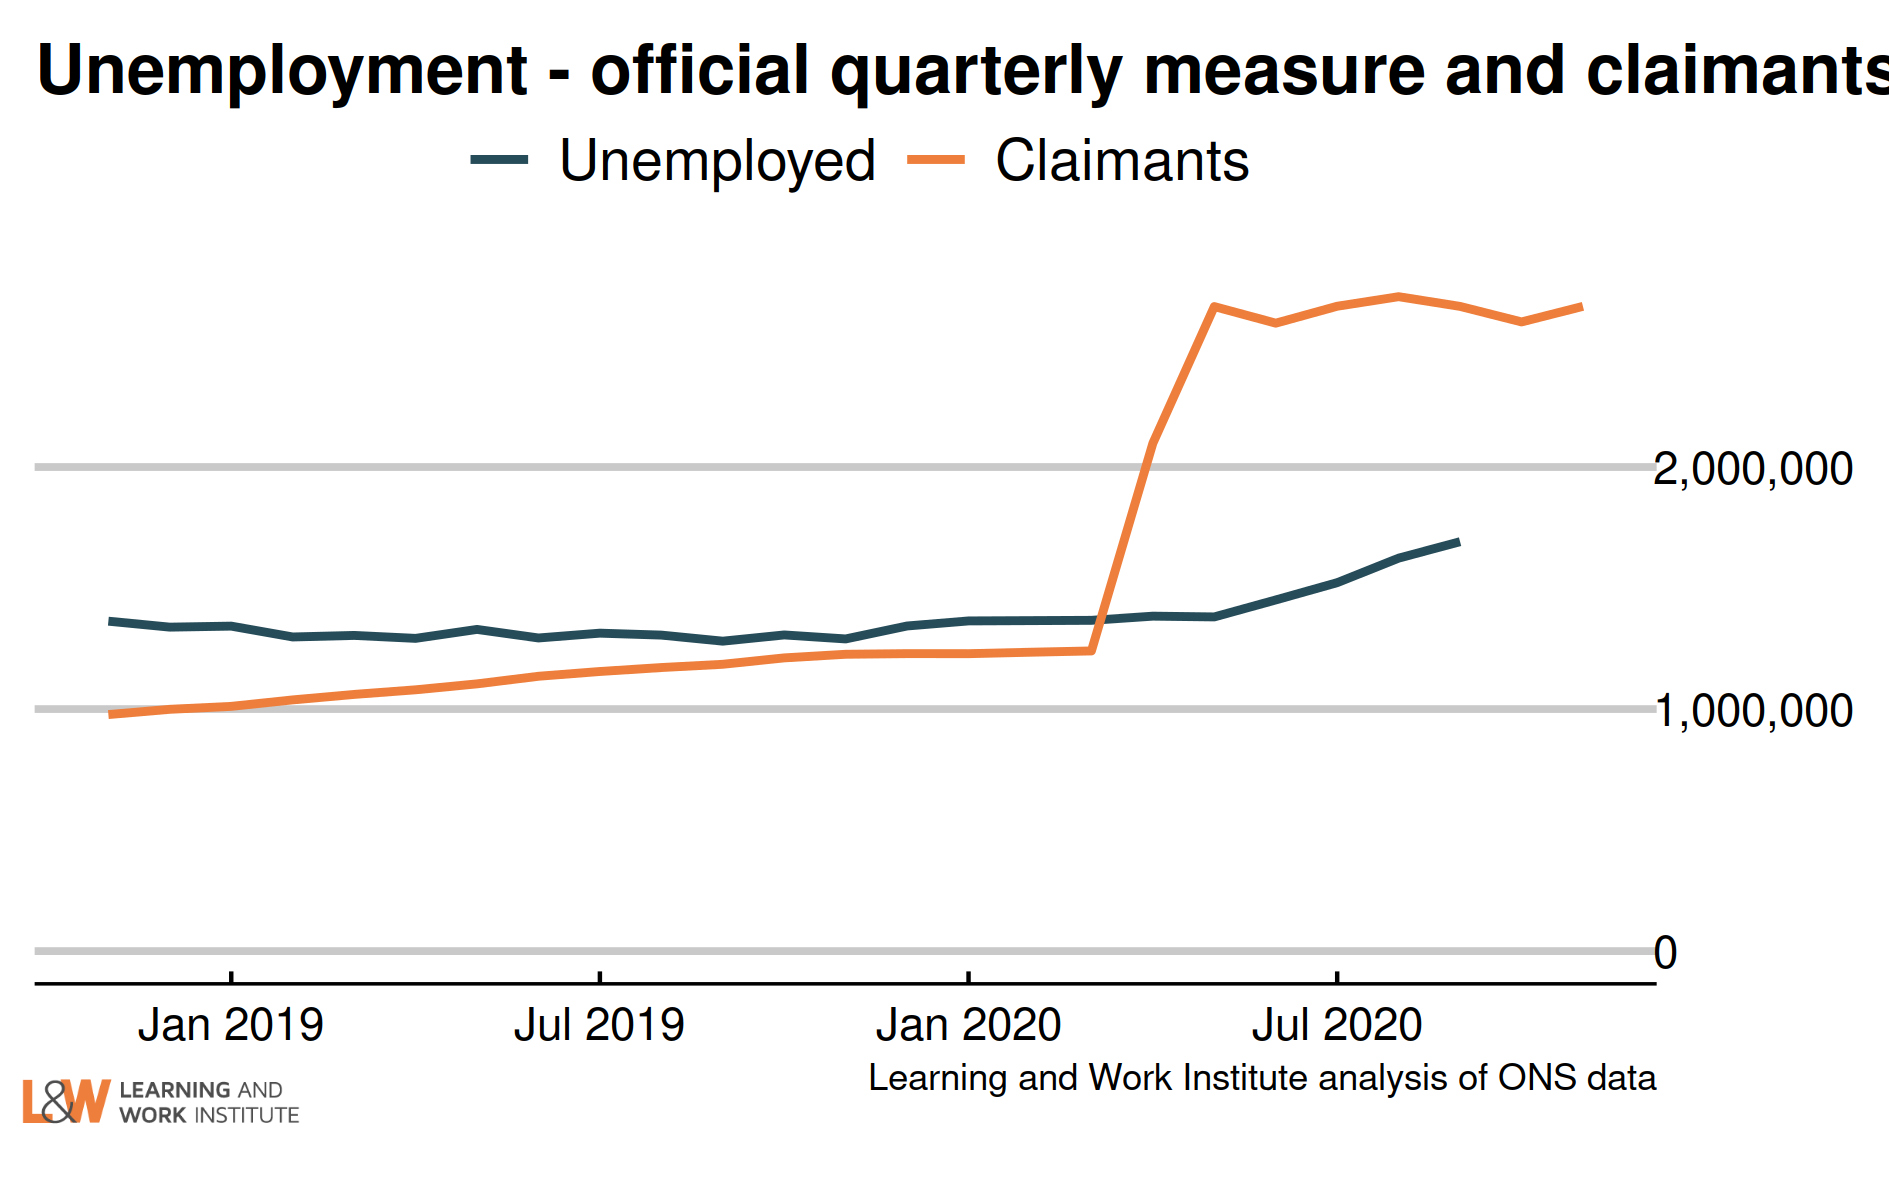
Chart 3: The claimant count and UK unemployment compared
The number of unemployed people who are claiming unemployment-related benefits is now
972,000 higher than the number of unemployed in the official measure.
 |
|
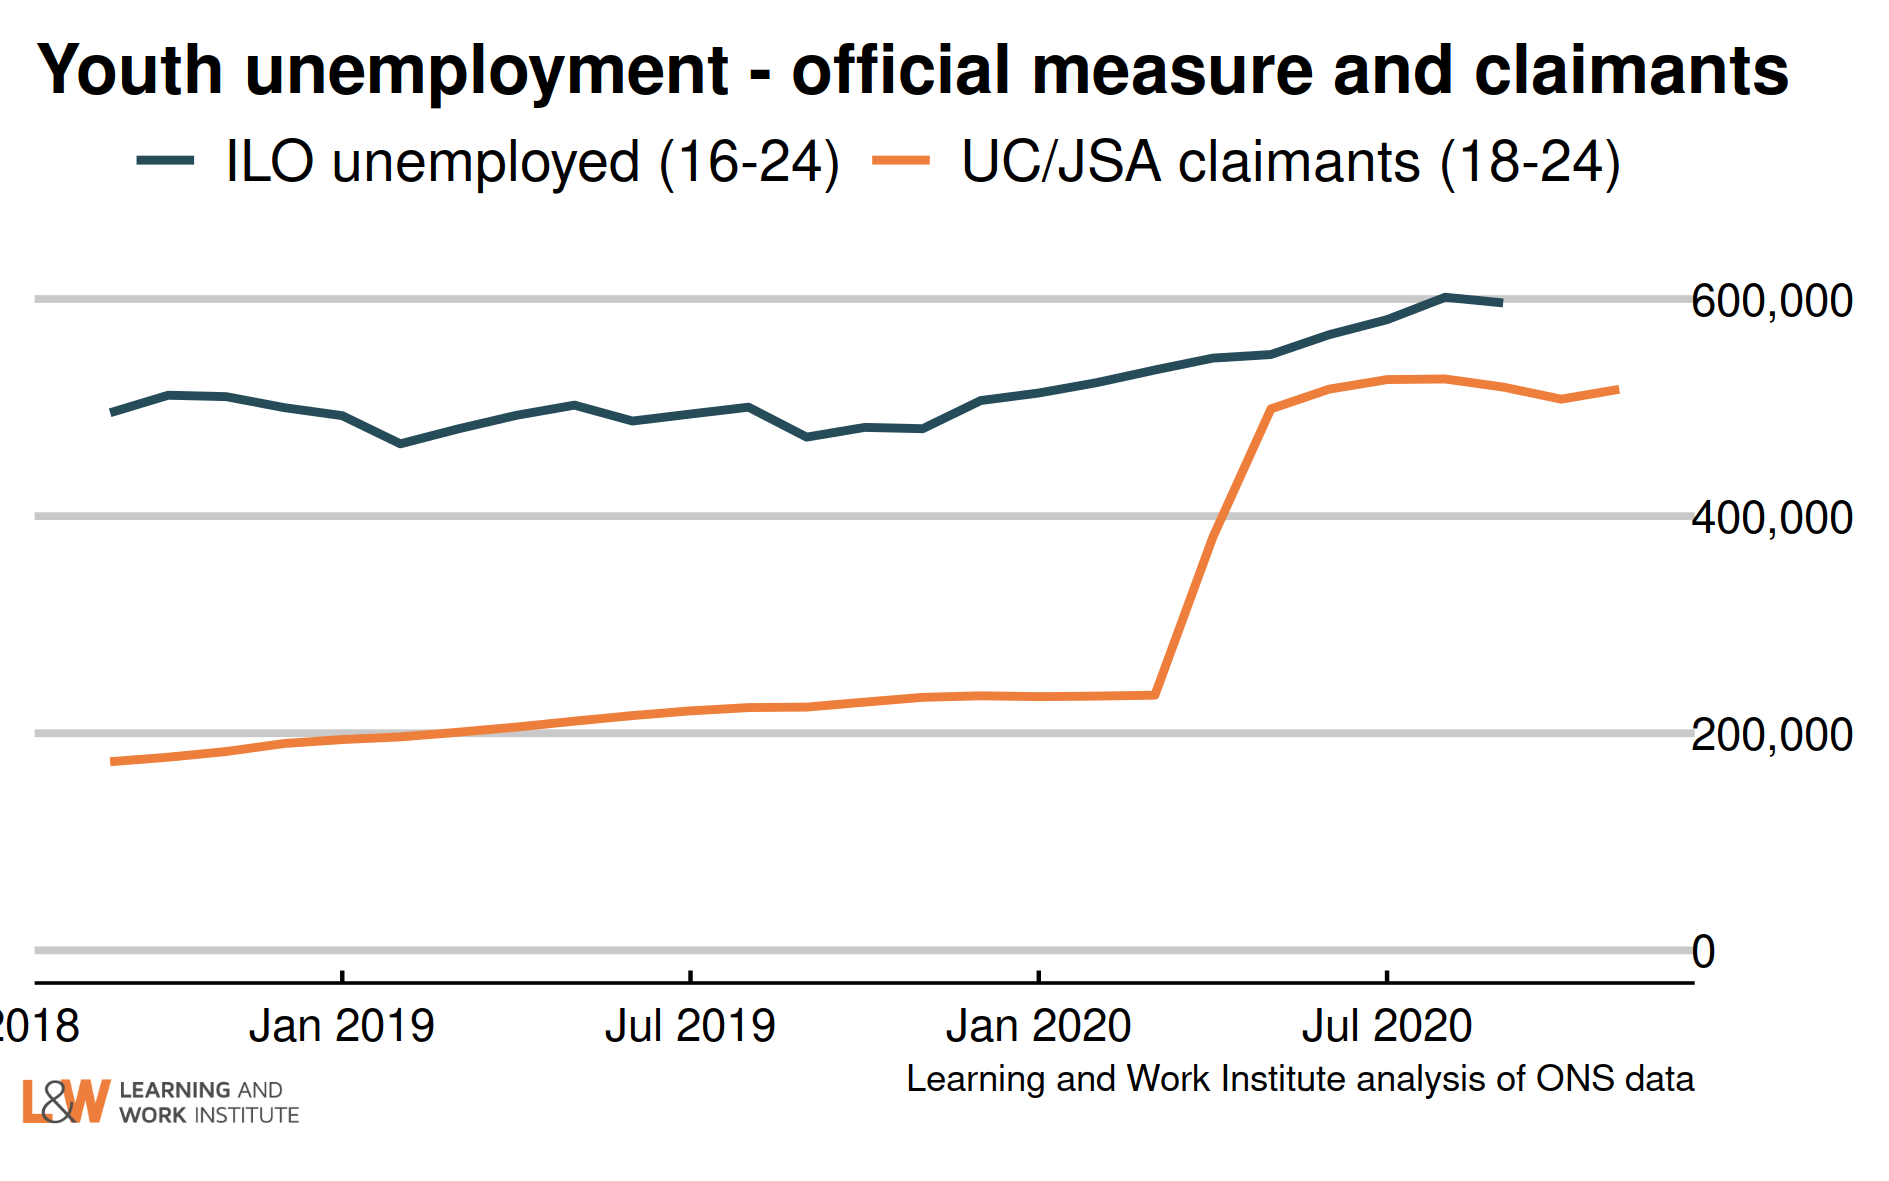
Chart 4: Youth unemployment
The number of unemployed young people has fallen by 5,000 since last month’s figures, to 596,000.
Meanwhile, the number of young Universal Credit or Jobseeker’s Allowance claimants rose last month by 9,100, to 516,900.
 |
|
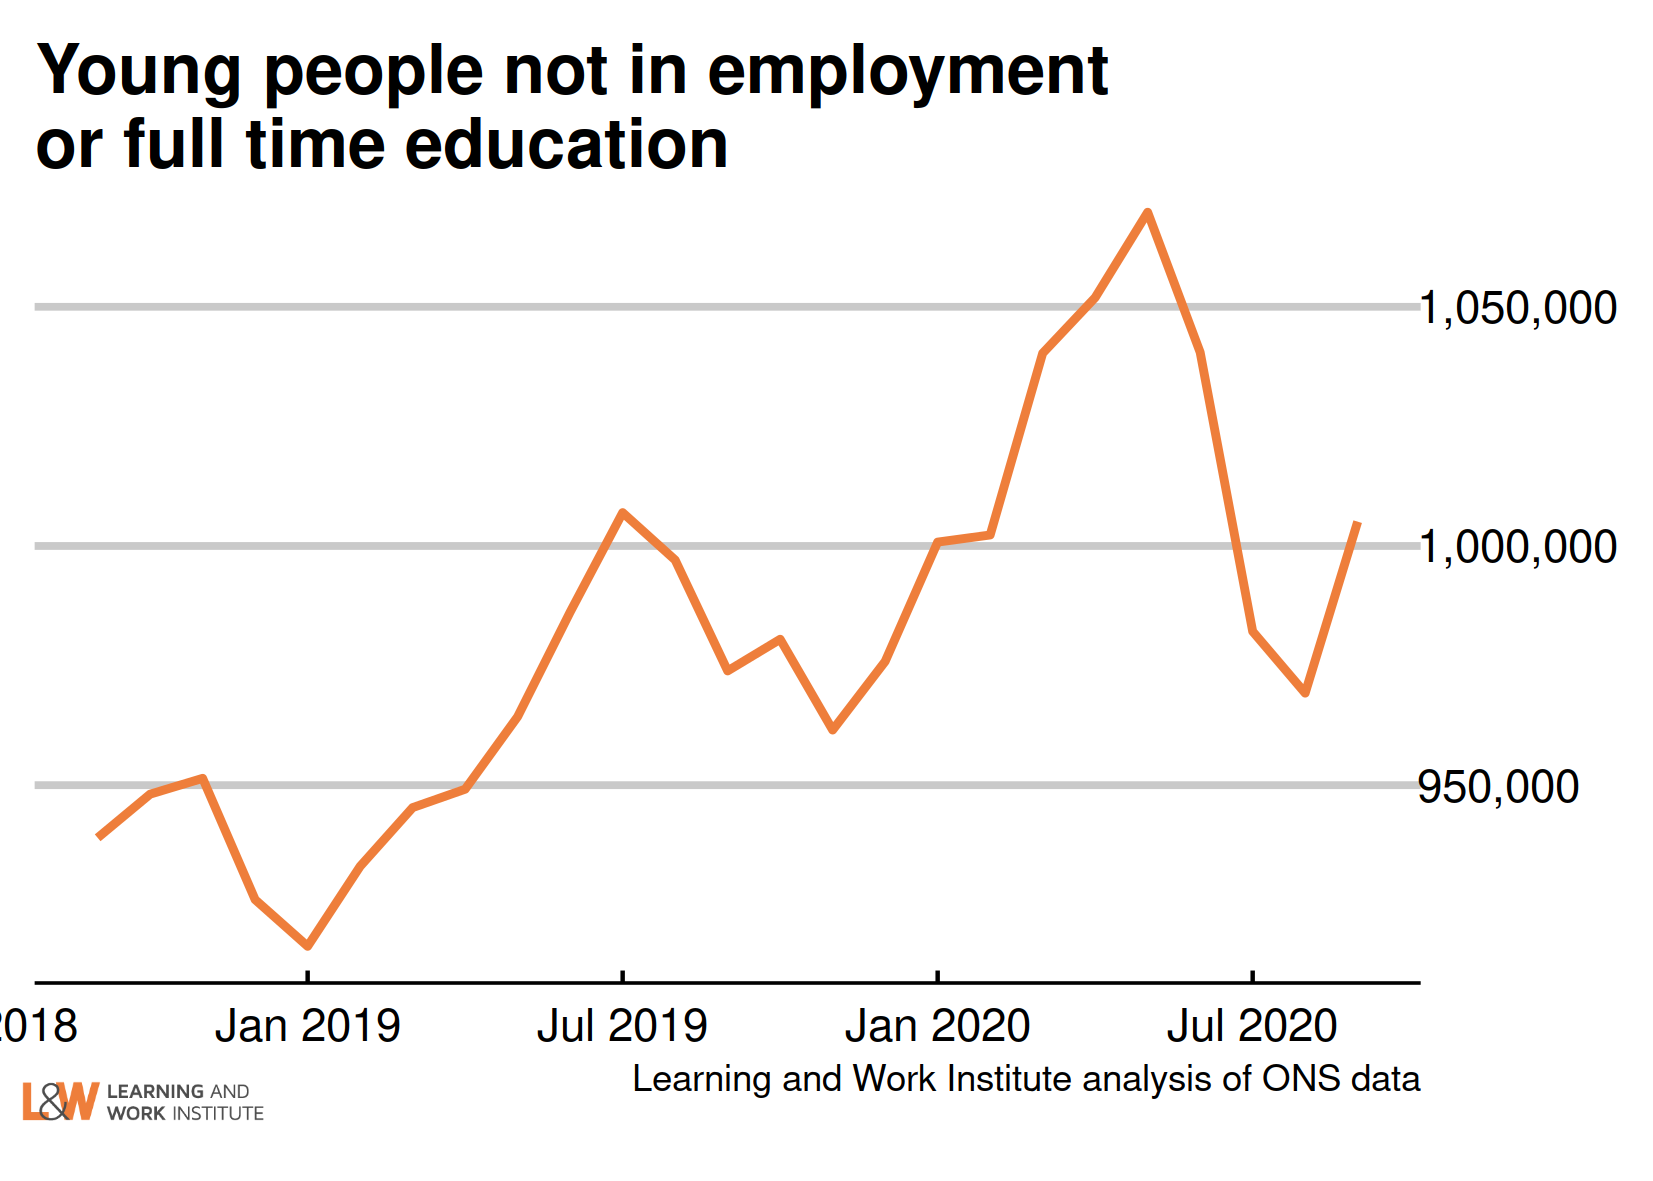
Chart 5: Young people not in employment, full-time education or training
The number of out of work young people who are not in full-time education (1,005,000) has risen in the past month by 36,000 , or 3.7%. Economic inactivity in this group has fallen since peaking in April to June 2020, while unemployment has risen. Nearly 40% of young people in this group are searching for work, up from 33% in April to June.
 |
|
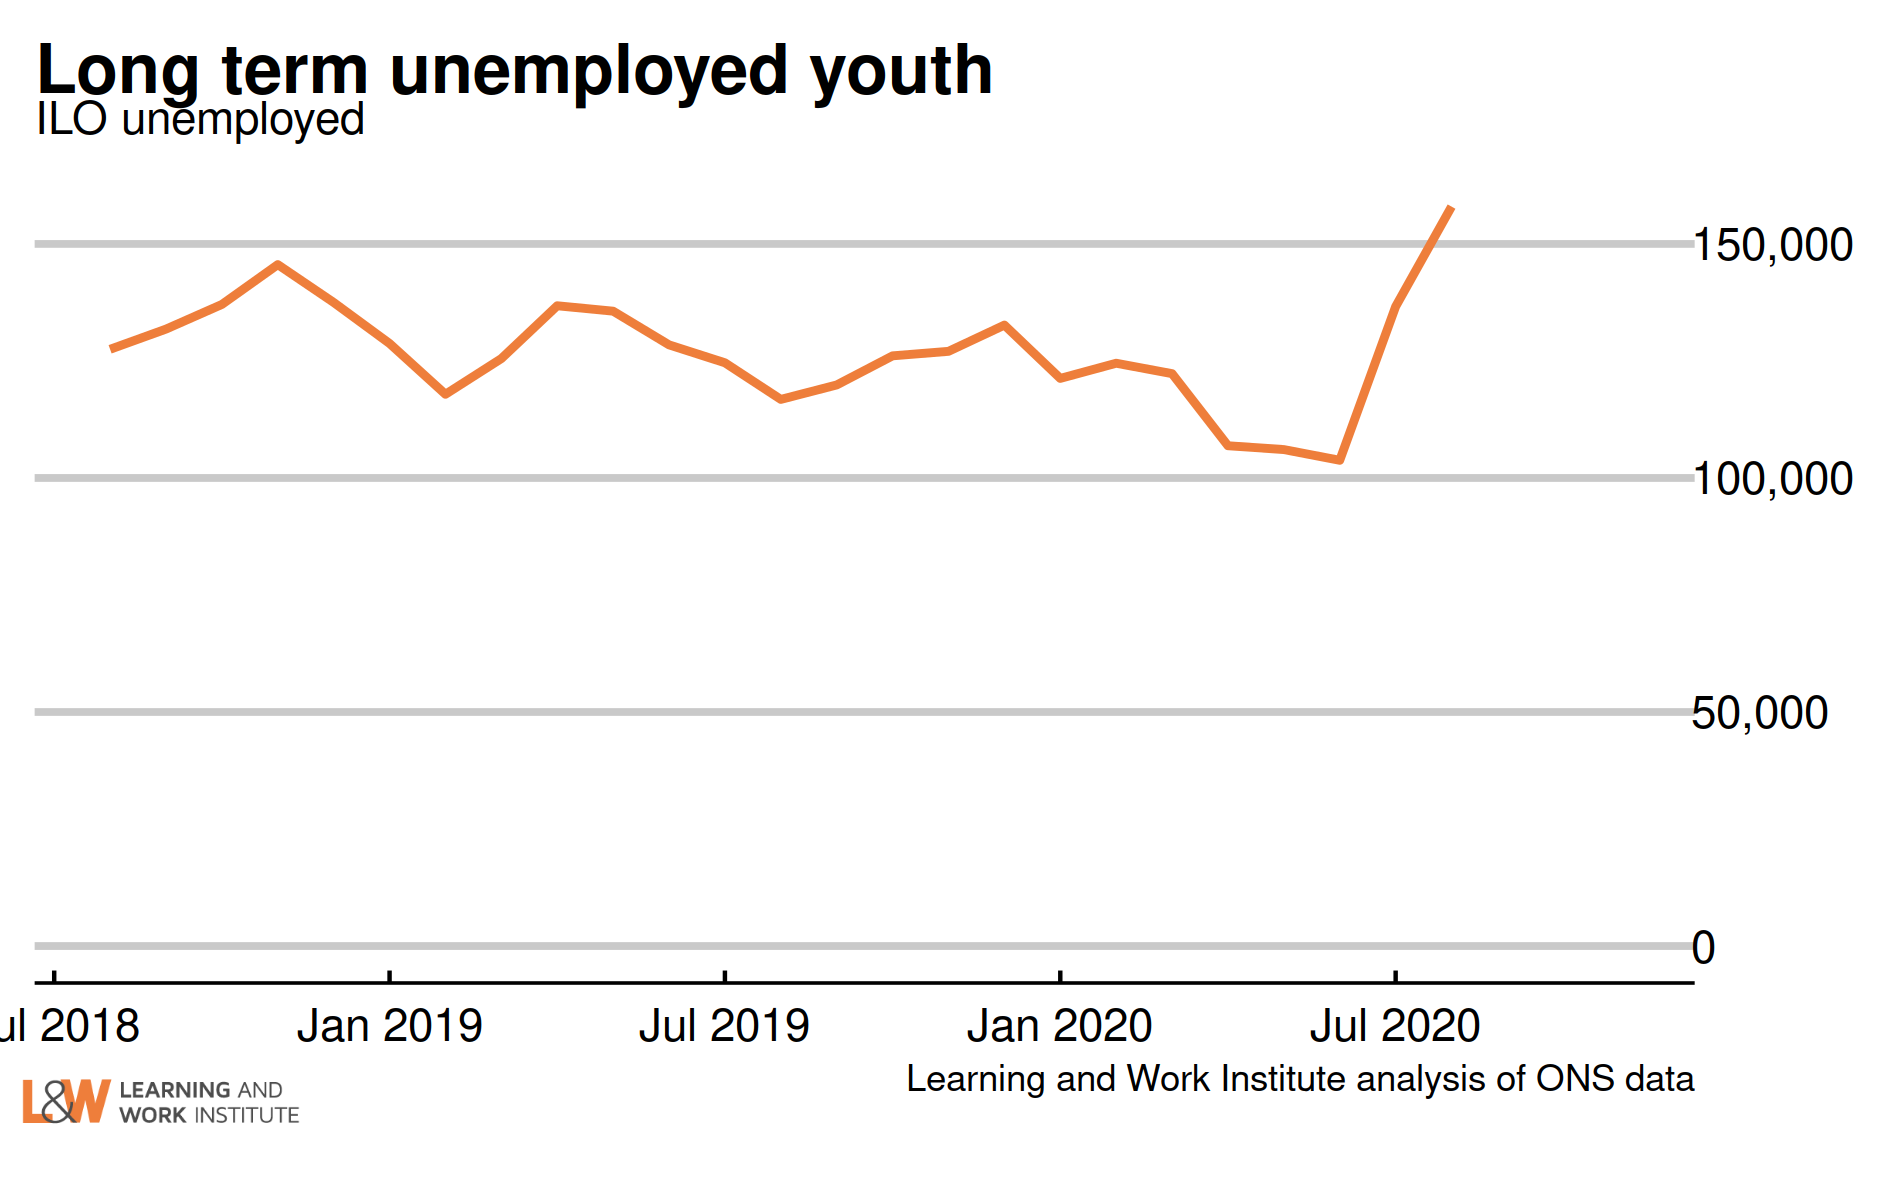
Chart 6: Youth long-term unemployment (six months and over, 18-24)
Youth long-term unemployment (which can include students) has risen by 21,000 from last month’s figure and is now 158,000.
This measure is starting to include young people who became unemployed in March and April 2020, and are now reaching the six-month measure used here.
 |
|
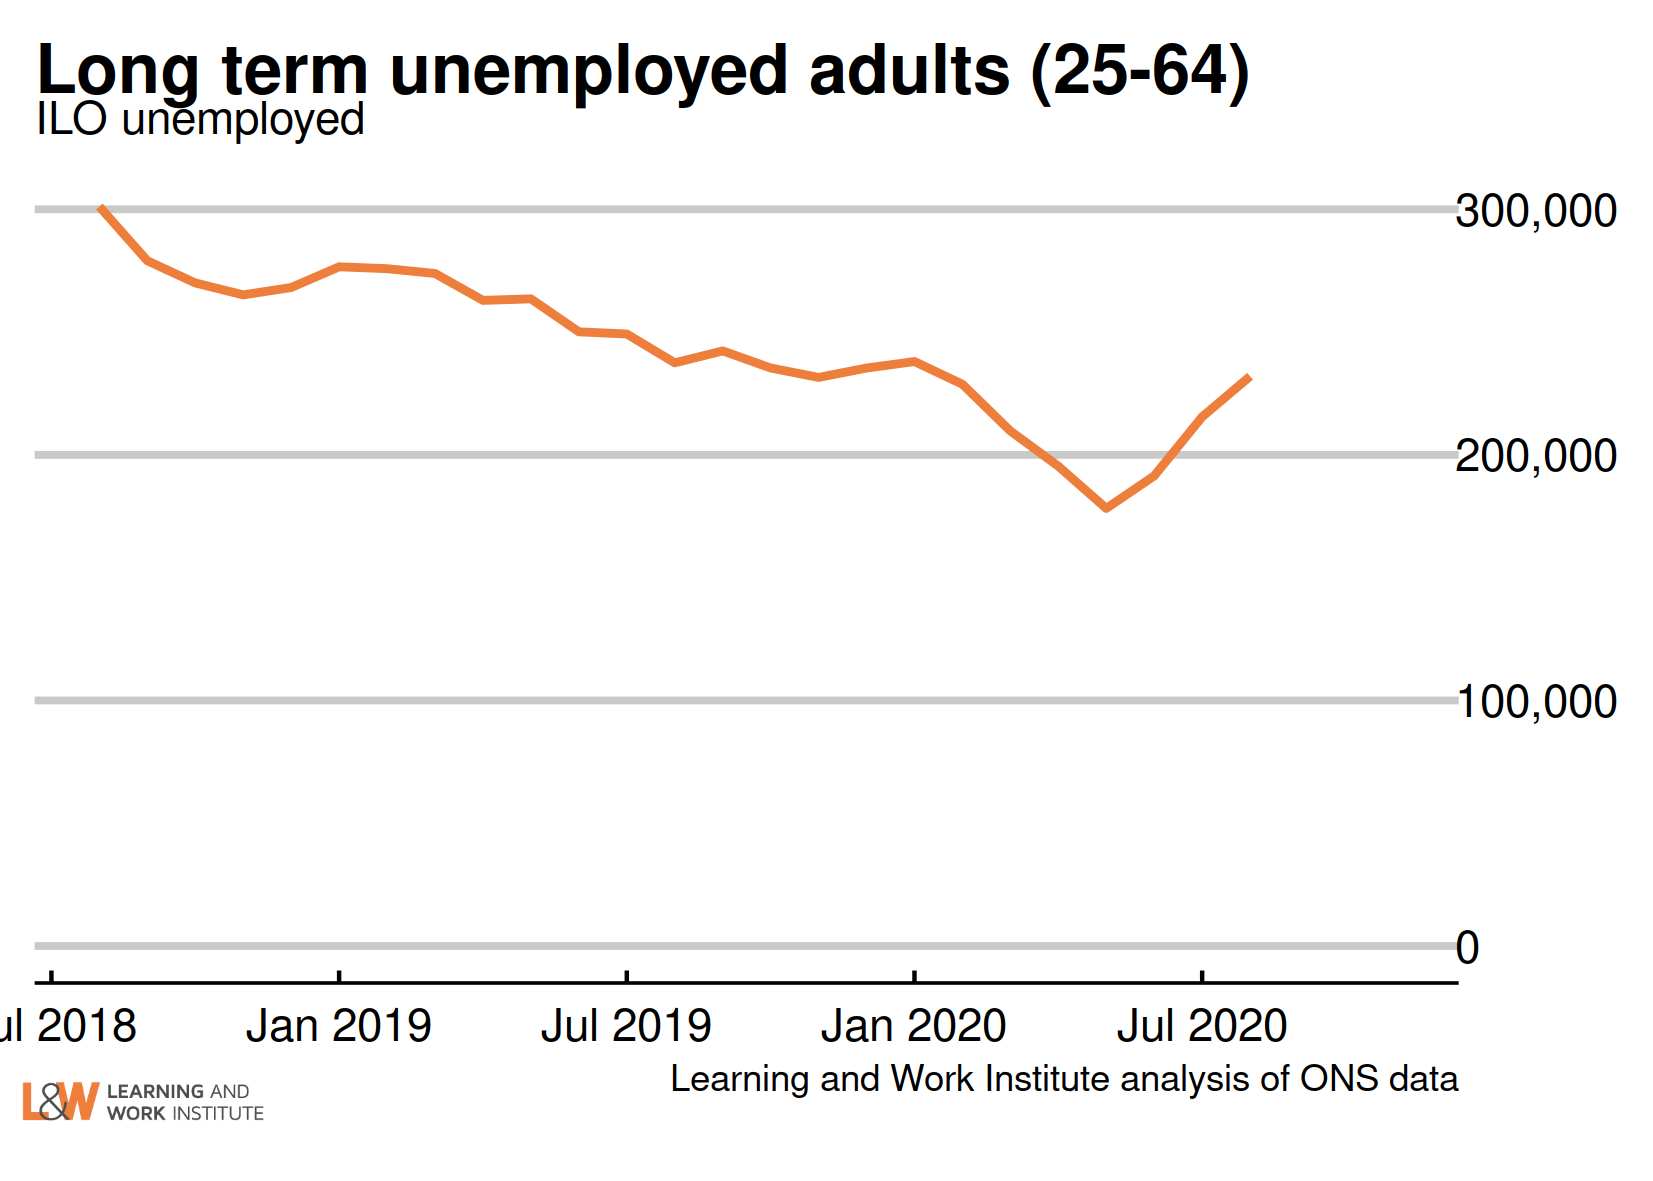
Chart 7: Adult long-term unemployment (12 months and over, 25+)
Adult long-term unemployment on the survey measure is now 232,000.
People in this measure became unemployed in August to October 2019 in the latest figures. It is starting to show the impacts of the difficult labour market facing those already unemployed. Adult long-term unemployment fell in the first lockdown as people stopped looking for work (as few employers were recruiting).
 |
|
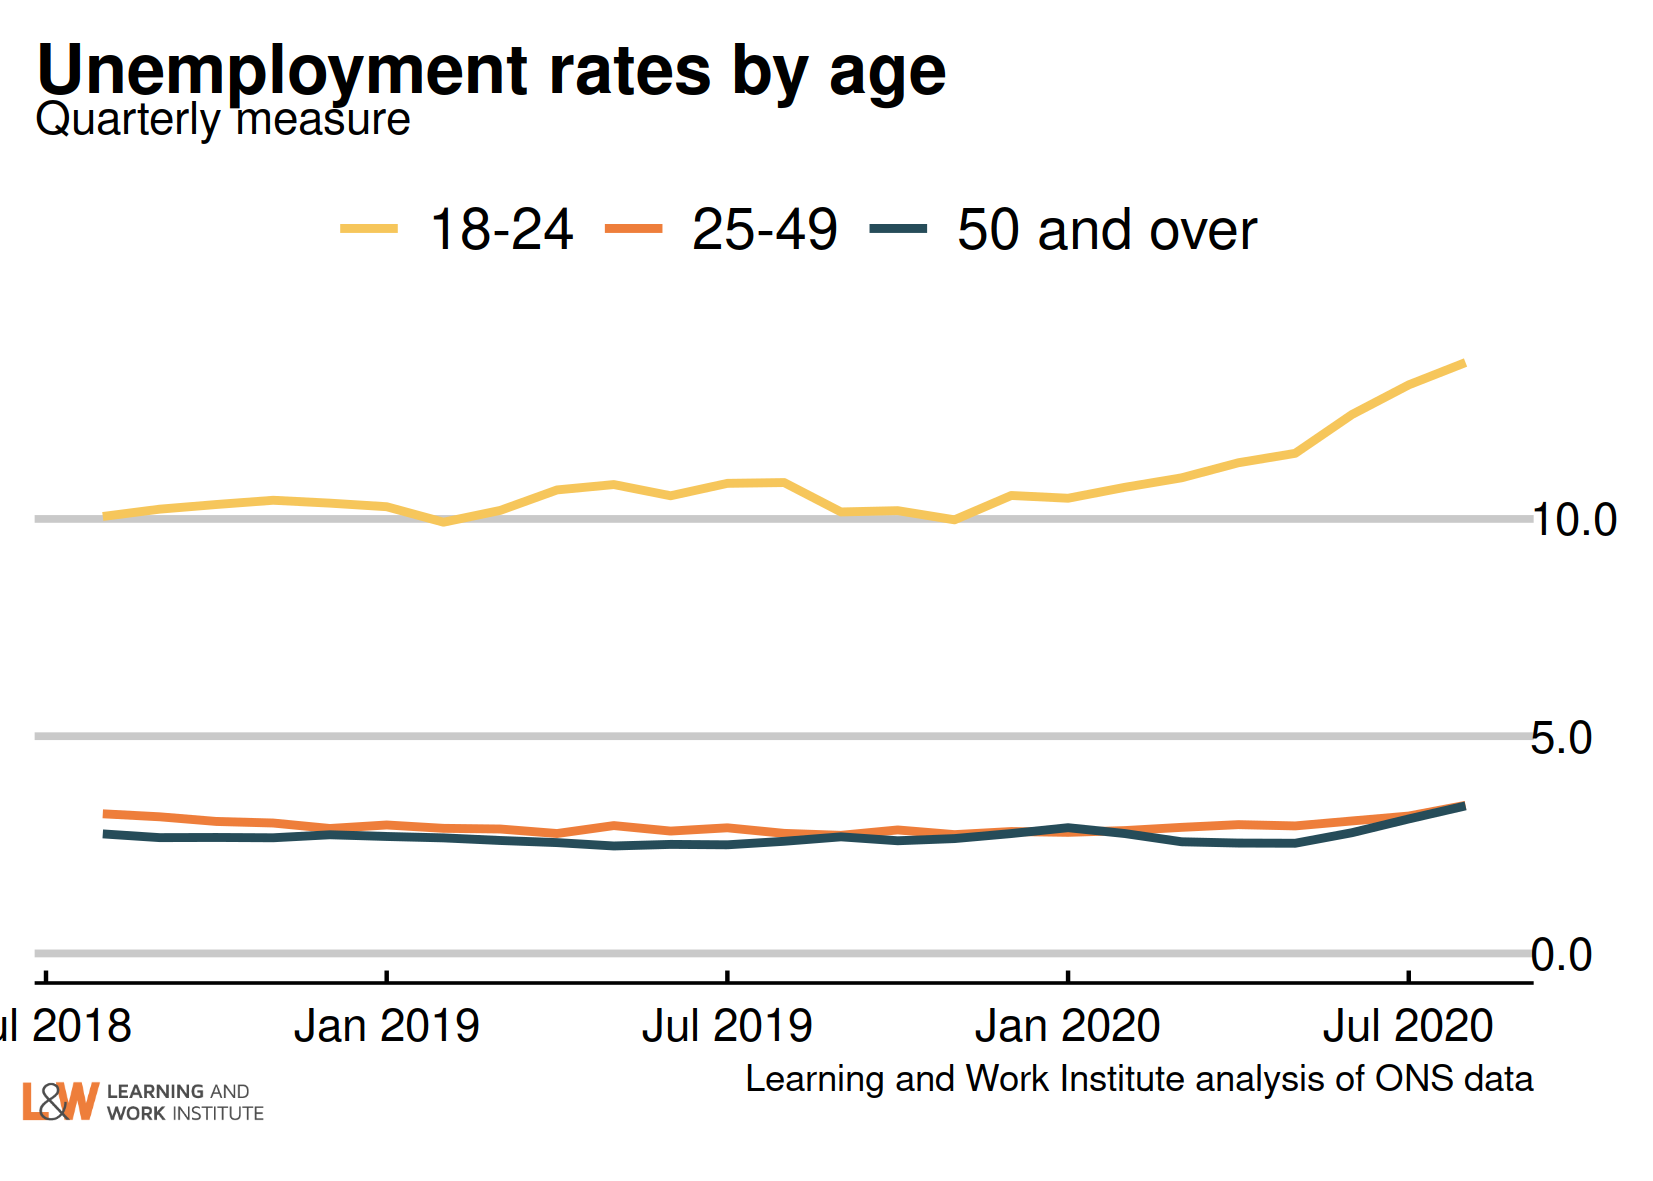
Chart 8: Unemployment rates by age
The 18 to 24 year old unemployment rate (including students) is 13.6% of the economically active – excluding one million economically inactive students from the calculation. The rate for those aged 25 to 49 is 3.4%. For those aged 50 and over it is 3.4%. The quarterly change is up 0.8 for 18 to 24 year olds, up 0.5 for 25 to 49 year olds, and up 0.9 for the over-50s.
 |
|
Chart 9: Vacancies – whole economy survey
Headline vacancies rose slightly this month, to 547,000. The ONS' experimental single-month vacancy figures shows a fall of 66,000 between October and November. The headline ONS vacancy figure is both seasonally adjusted and a three-month average. The chart shows both series. 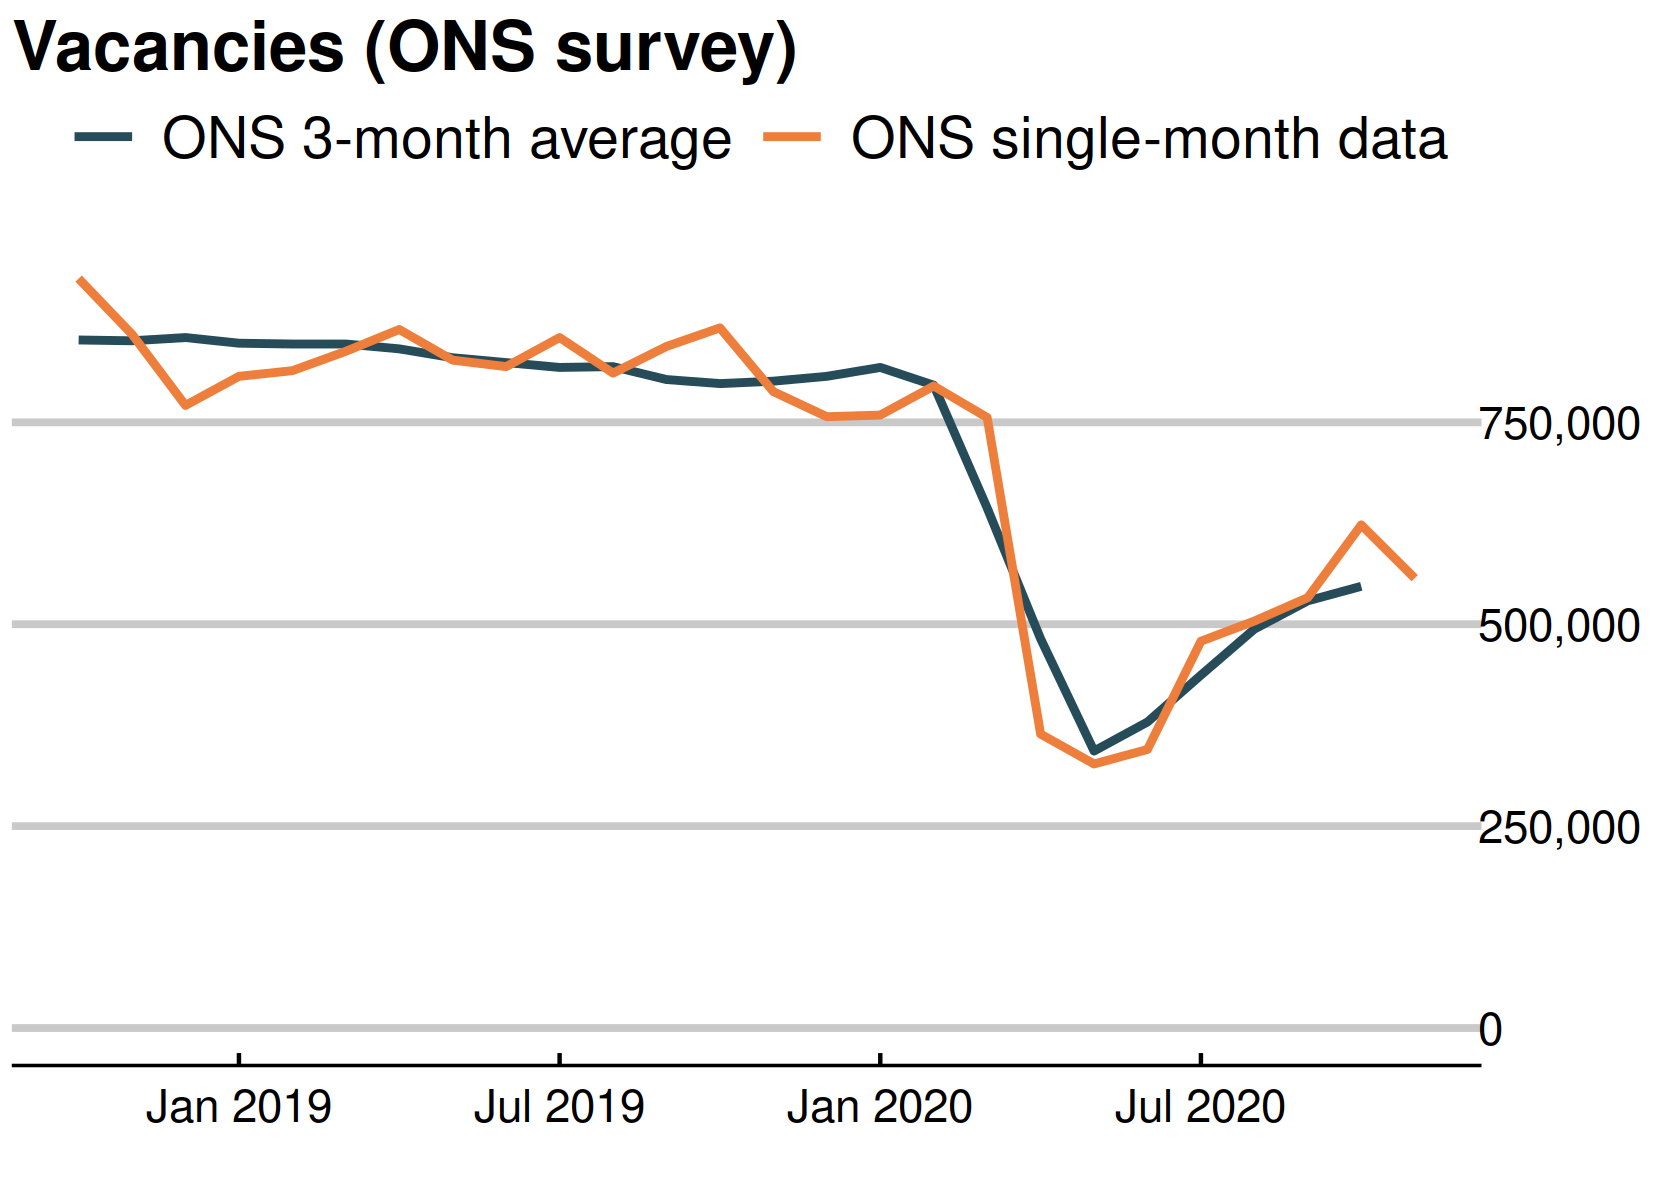 |
 |
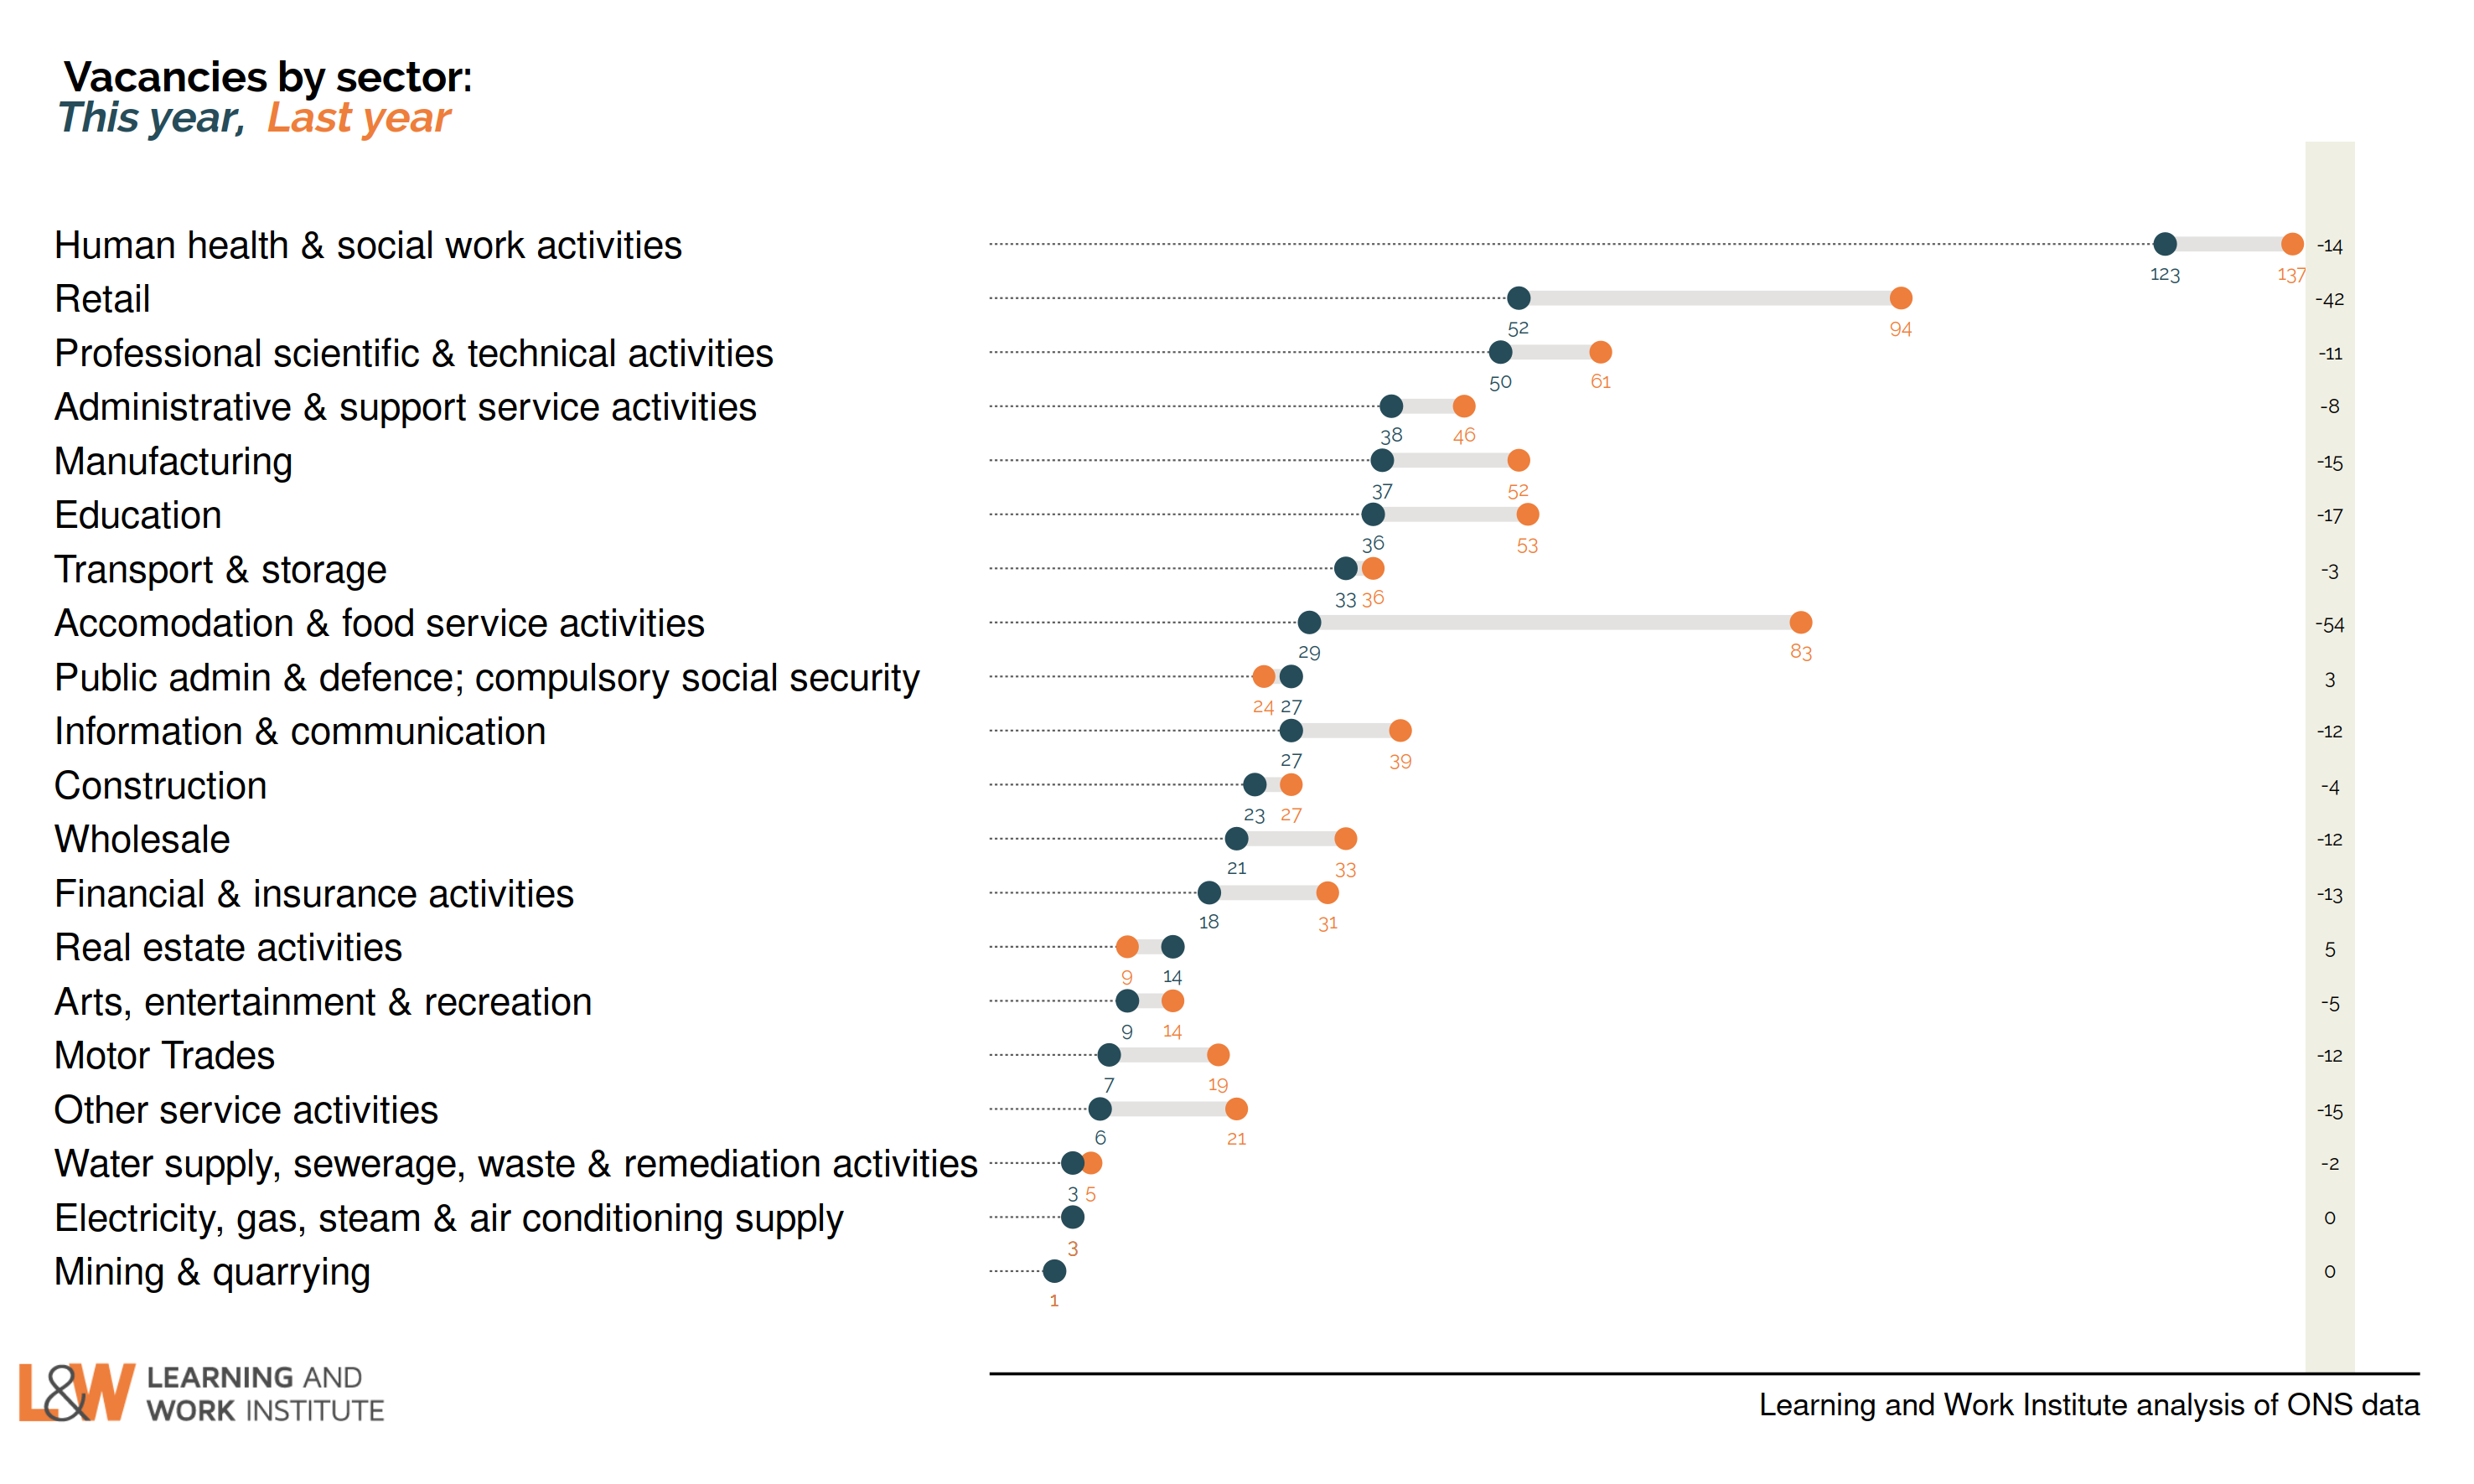
Chart 10: Experimental single month vacancies – whole economy survey
The Office for National Statistics experimental single month vacancy estimates include sectoral information. As these are not seasonally adjusted, it is better to look at annual changes. The numbers are thousands of vacancies, under each number, and on the right, the annual change in thousands of vacancies.
 |
|
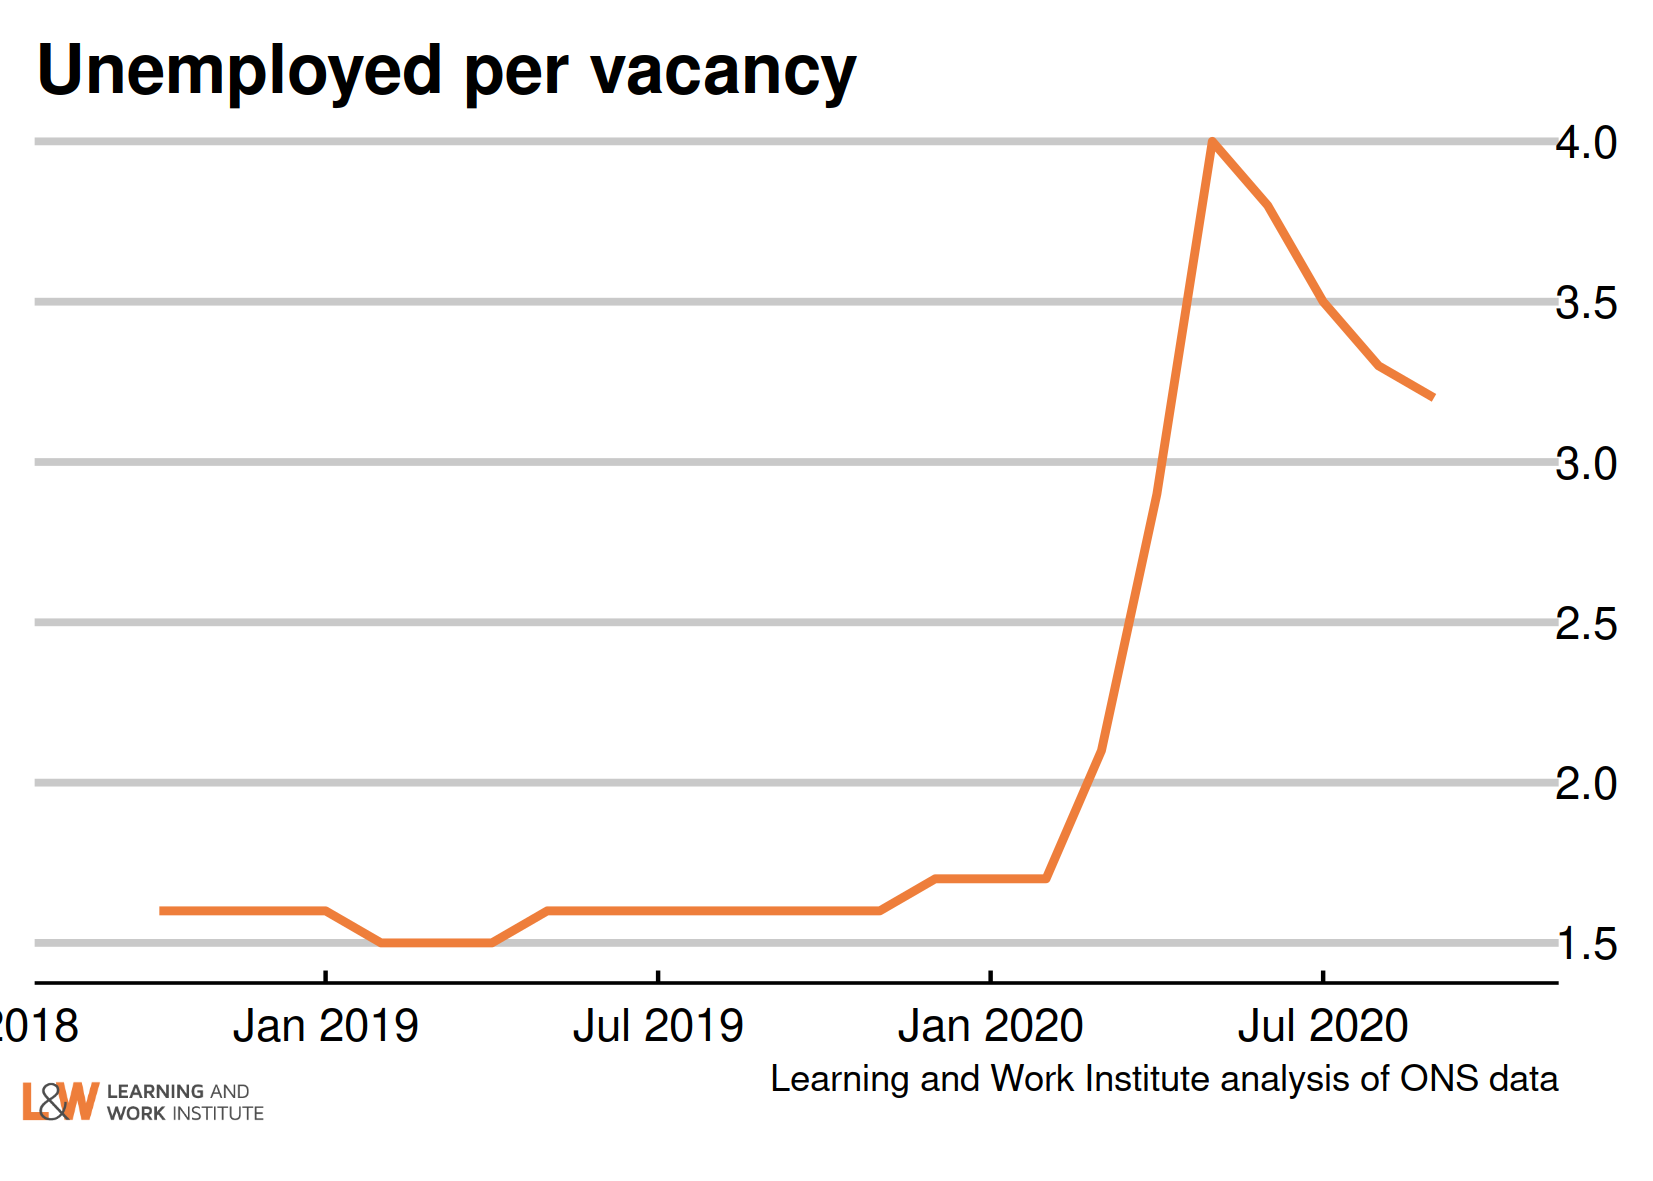
Chart 11: Unemployed people per vacancy
There are 3.2 unemployed people per vacancy. This has fallen back as the number of vacancies has risen, despite increasing numbers of unemployed.
 |
|
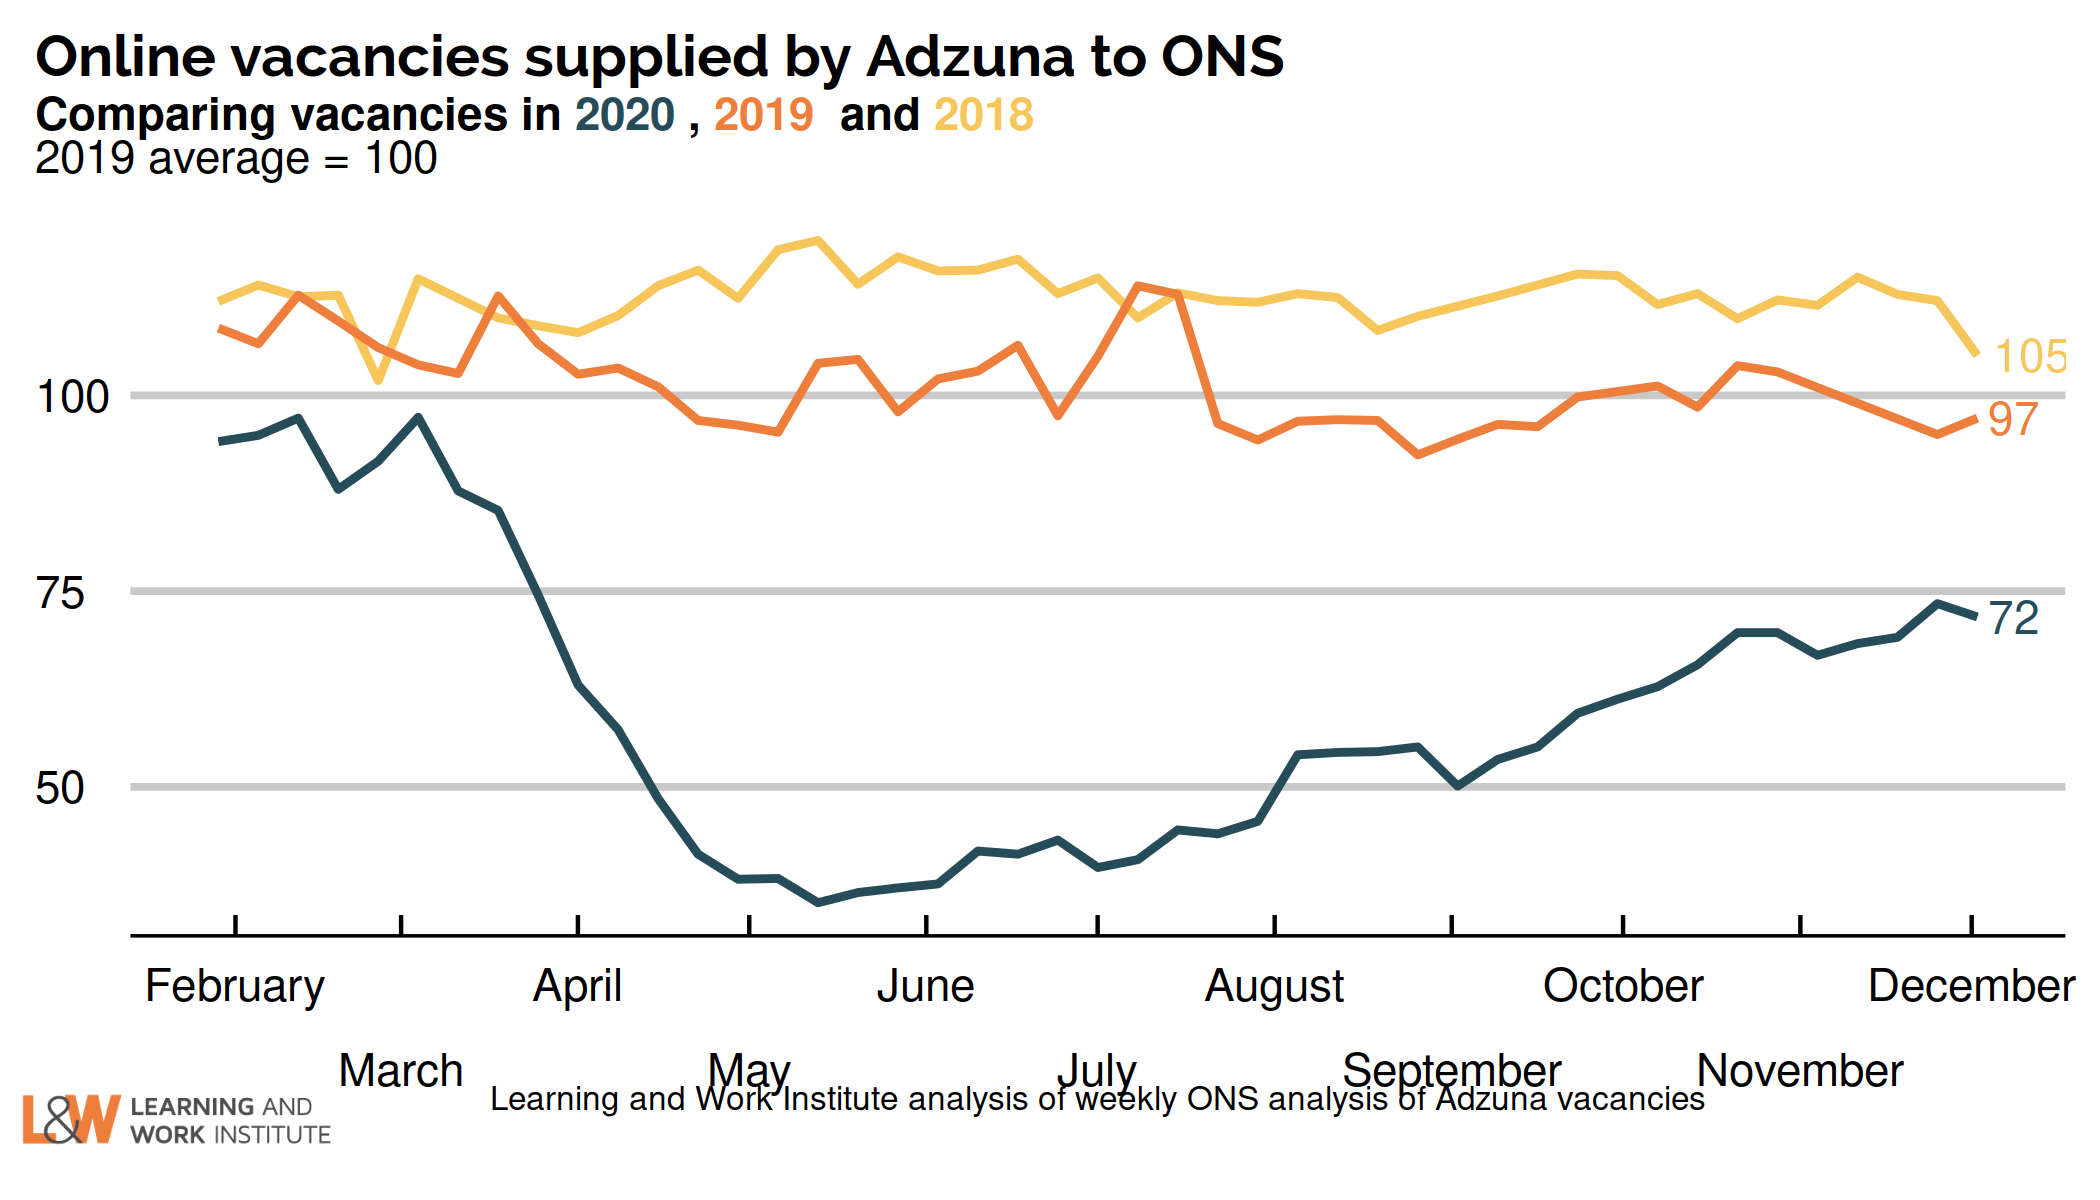
Chart 12: Online vacancies to the early December from Adzuna
Job vacancies dropped to below half of the 2019 average following lockdown. ONS analysis suggests that it was this reduced hiring that led to falls in employment, rather than increased job loss. There had been a gradual increase as the lockdown had eased, but the number of vacancies at the start of December was just 72% of pre-crisis levels.
 |
|
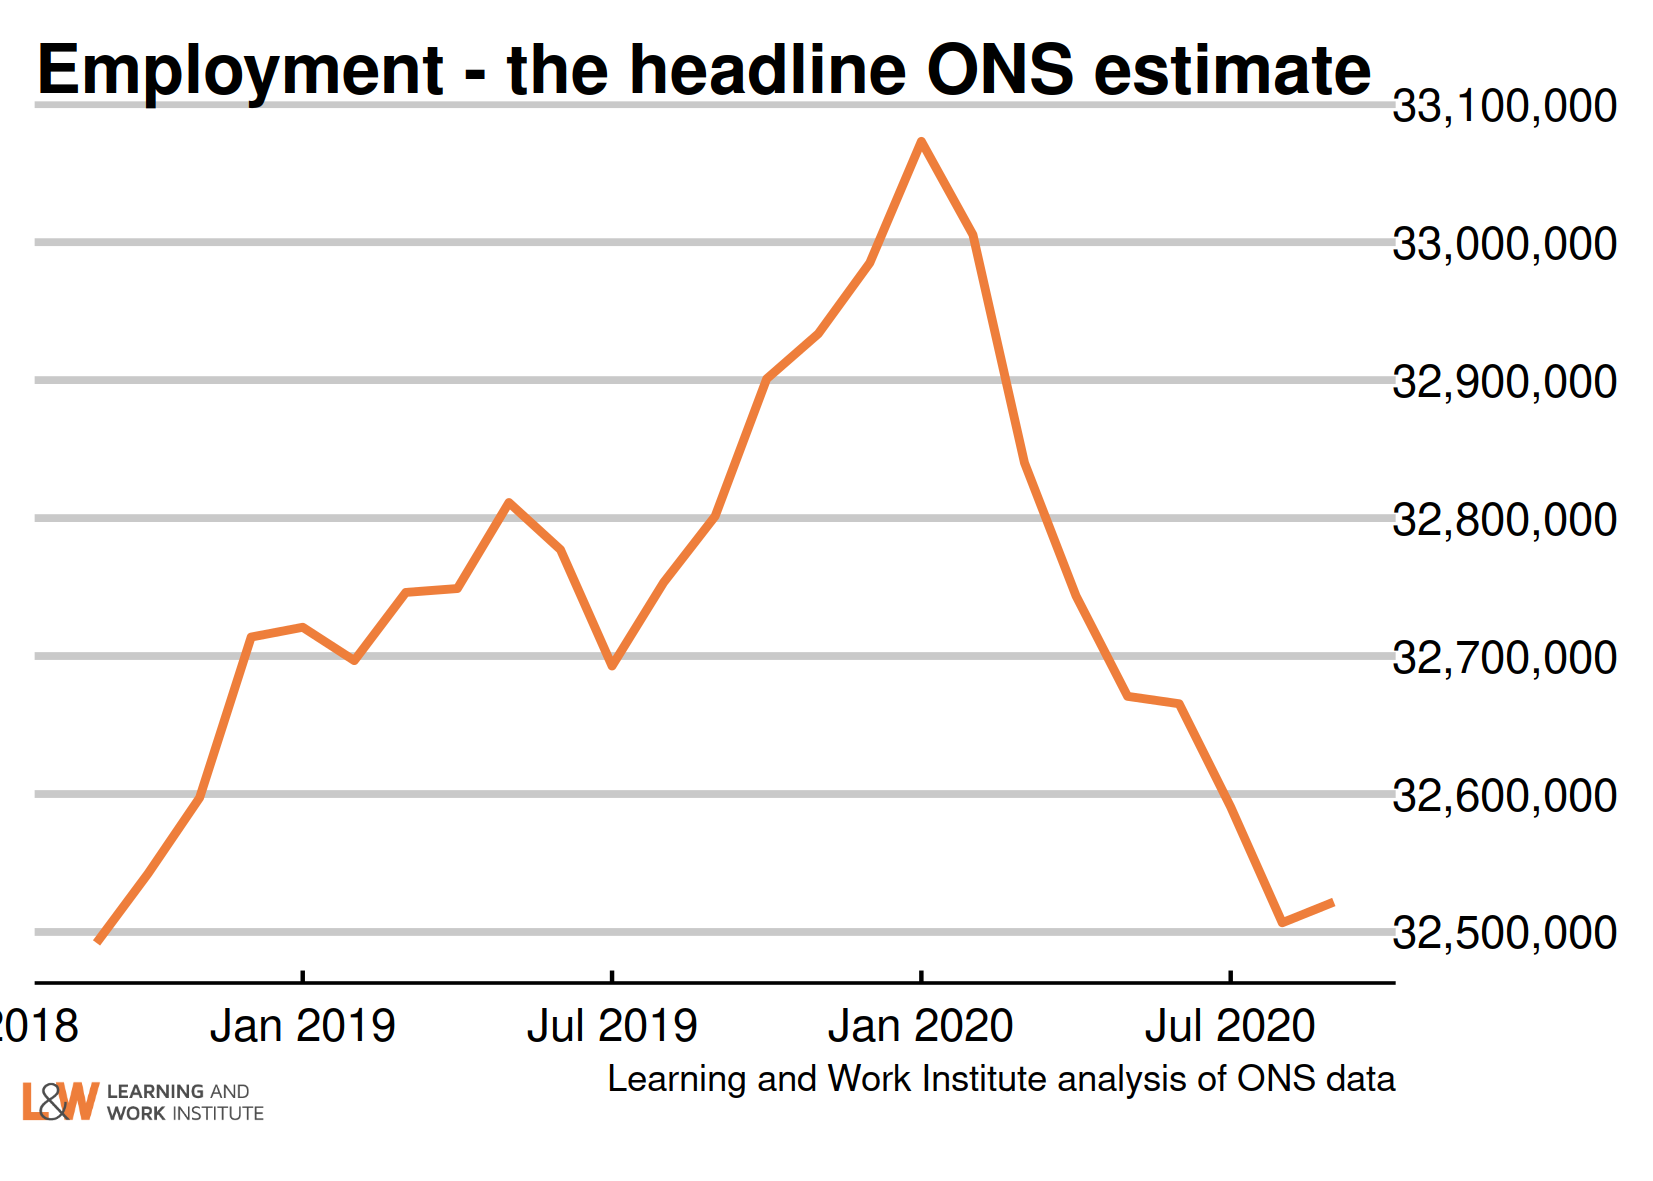
Chart 13: UK employment
Employment increased by 15,000 on the figure published last month, to 32,522,000.
 |
|
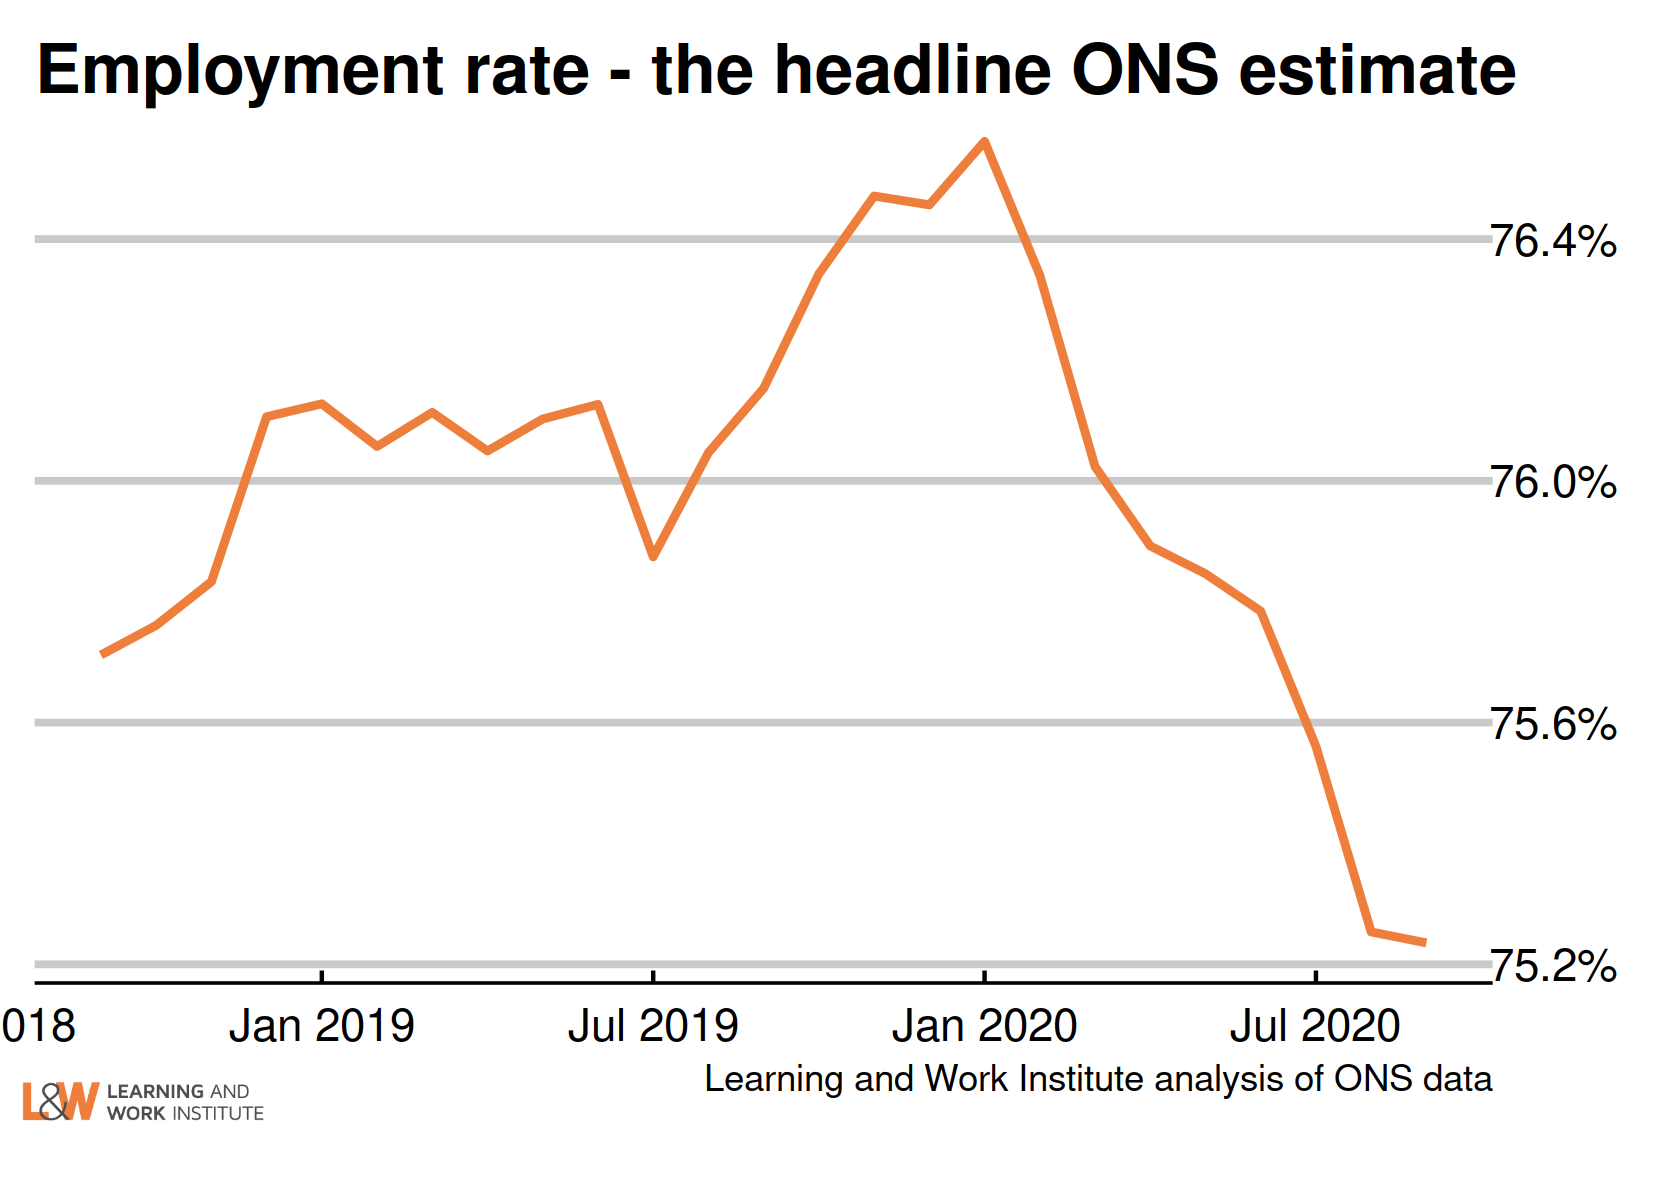
Chart 14: Employment rate in the UK
The employment rate fell by 0.5 percentage points over the quarter, to 75.2%. The employment rate has retraced its growth since 2017.
 |
|
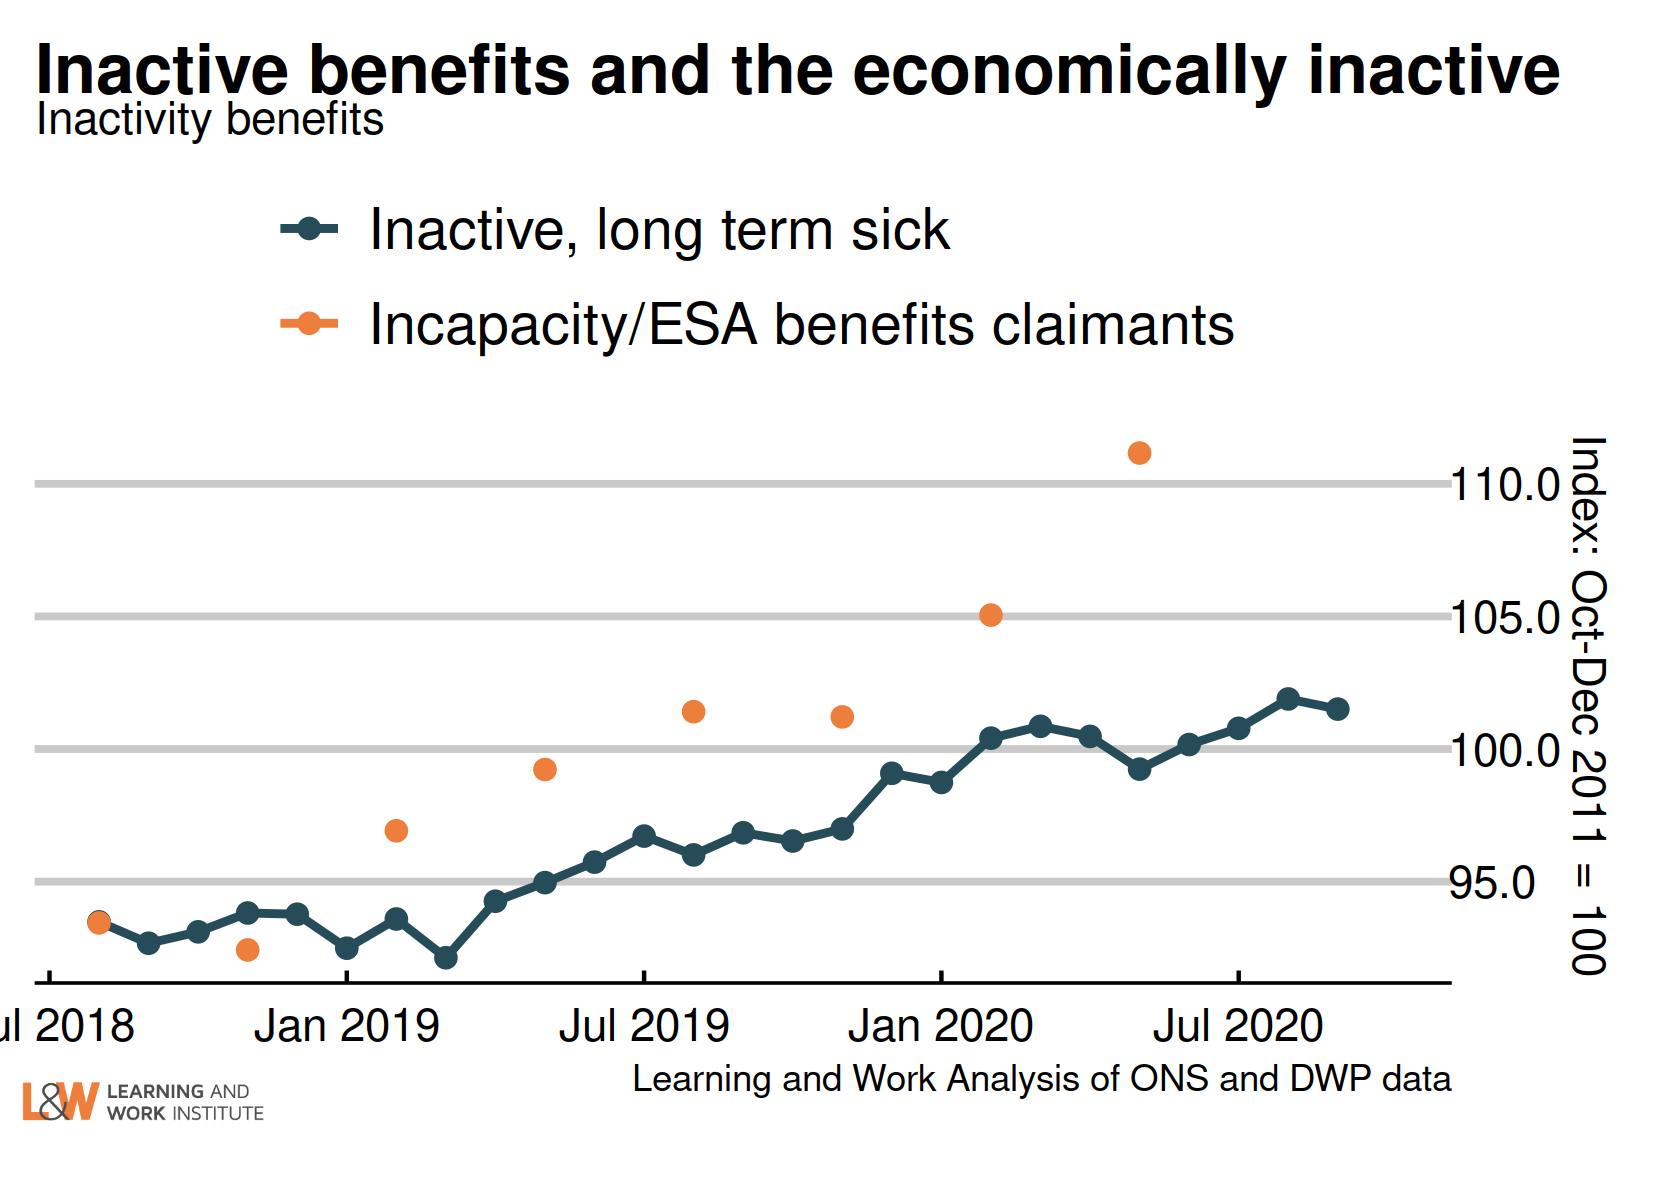
Chart 15: Claimants for inactive benefits and the economically inactive – inactivity benefits
The number of people inactive owing to long-term sickness is up on the quarter, while the latest benefit figures (for May 2020) rose.
This chart shows claimants of Employment and Support Allowance, and Universal Credit without work requirements (the orange dots), compared with survey figures for the economically inactive owing to long-term sickness.
 |
|
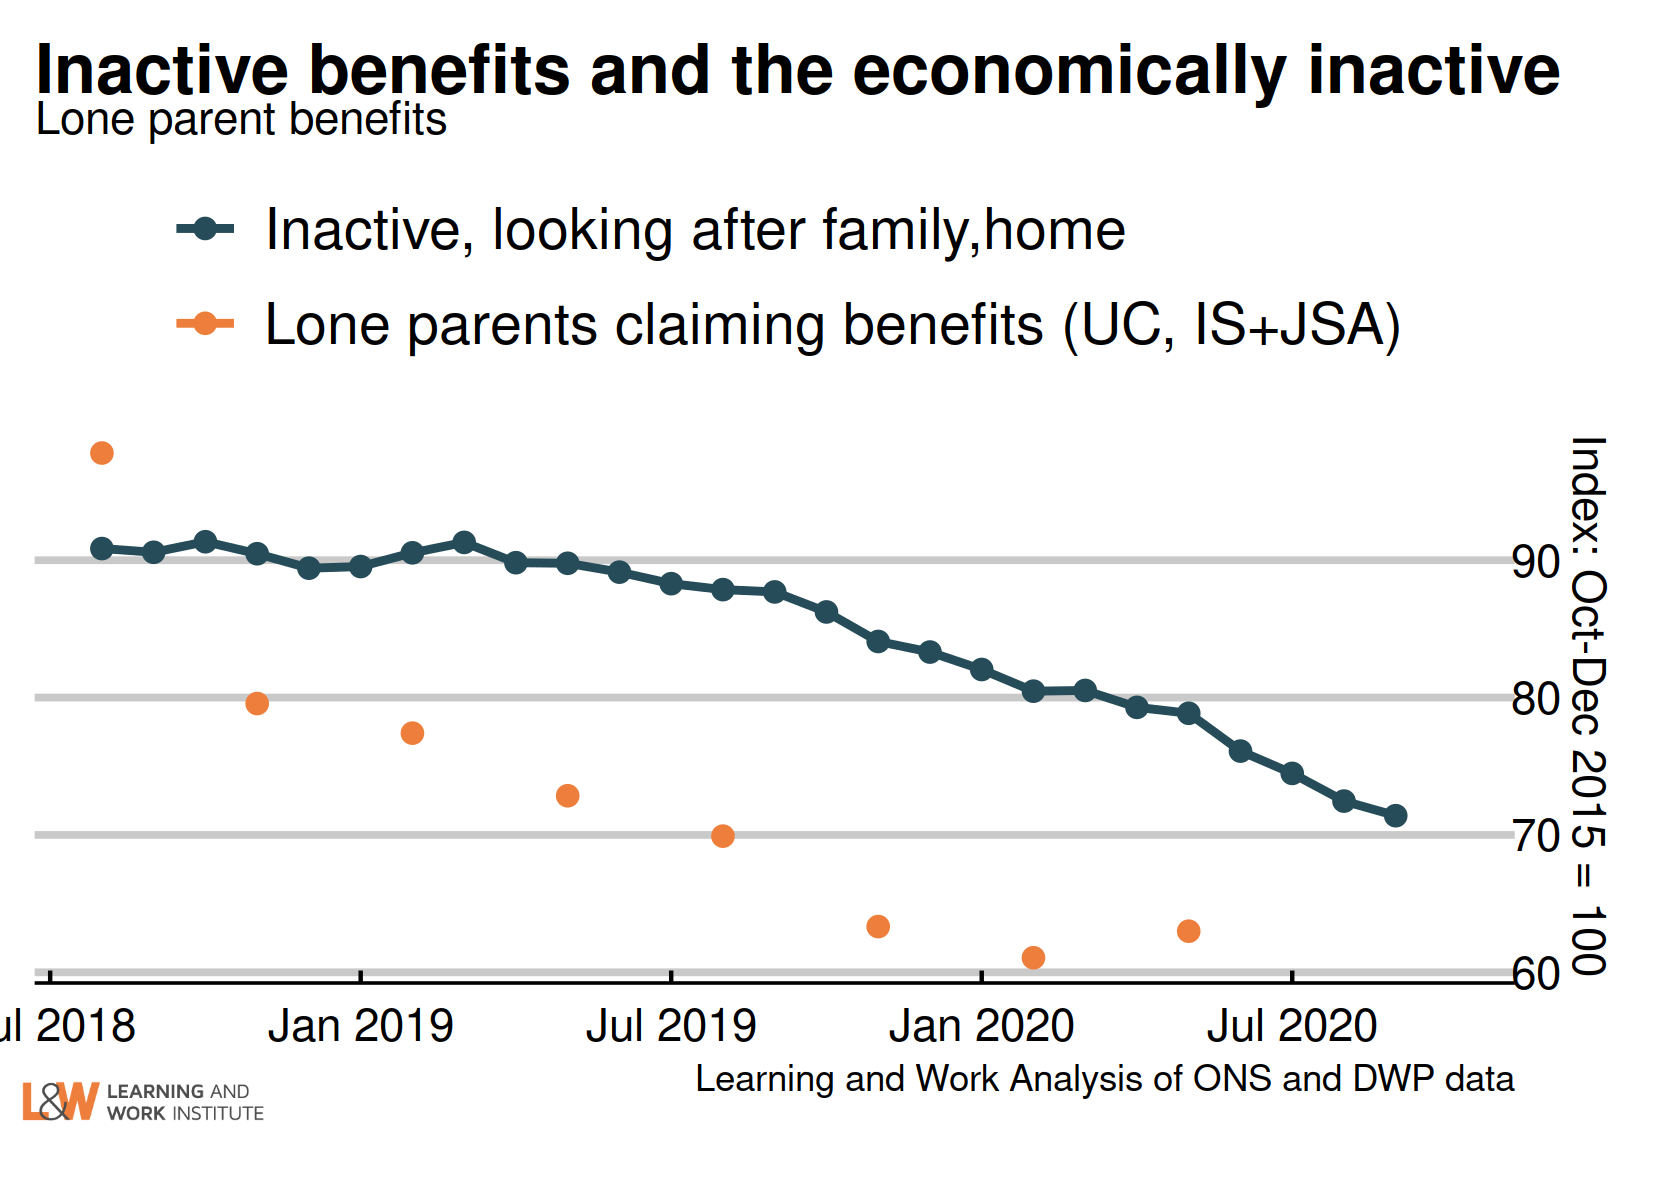
Chart 16: Claimants for inactive benefits and the economically inactive – lone parents
This chart shows claimants of out of work benefits as lone parents (the orange dots) and survey figures for all those who are economically inactive looking after family (including couple families). The survey figures (showing those looking after family) continued to trend down while benefit measures rose slightly in the latest (May 2020) data.
 |
|
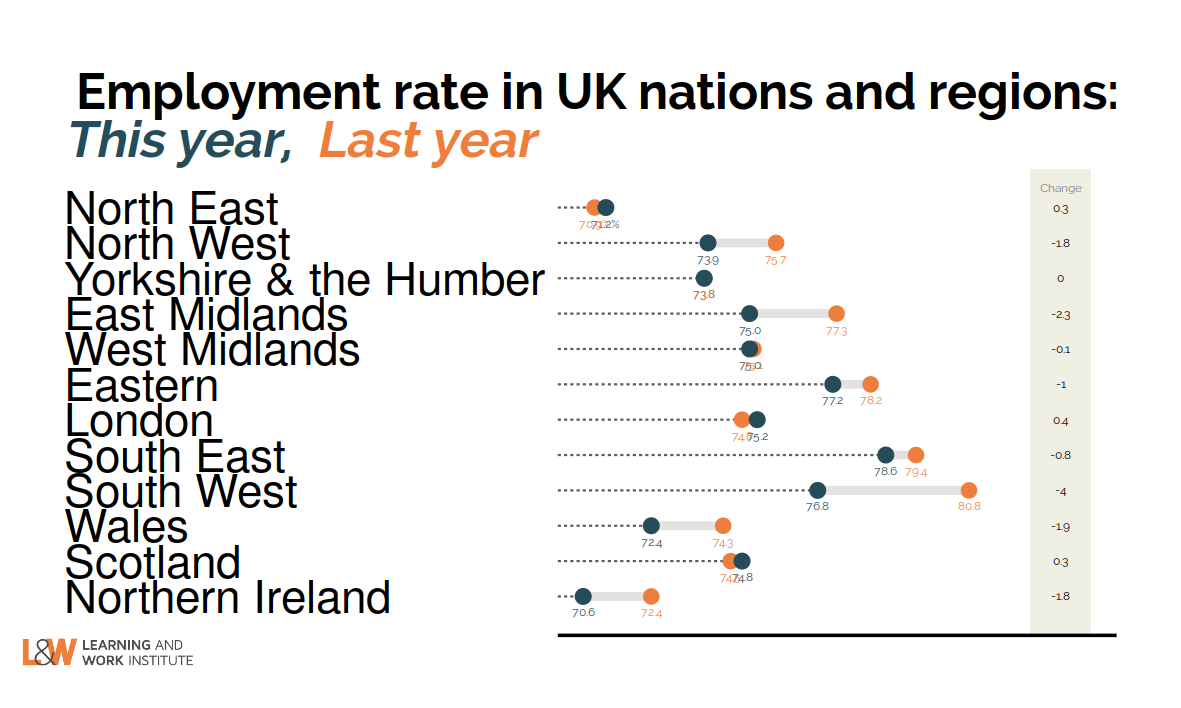
Chart 17: Employment rate annual change in regions to– August 2020 to October 2020
Compared to last year, three regions still showed a rise in the employment rate, while nine showed a fall. The rises were in London, the North East and Scotland, and the largest falls were in the South West and the East Midlands.
 |
|
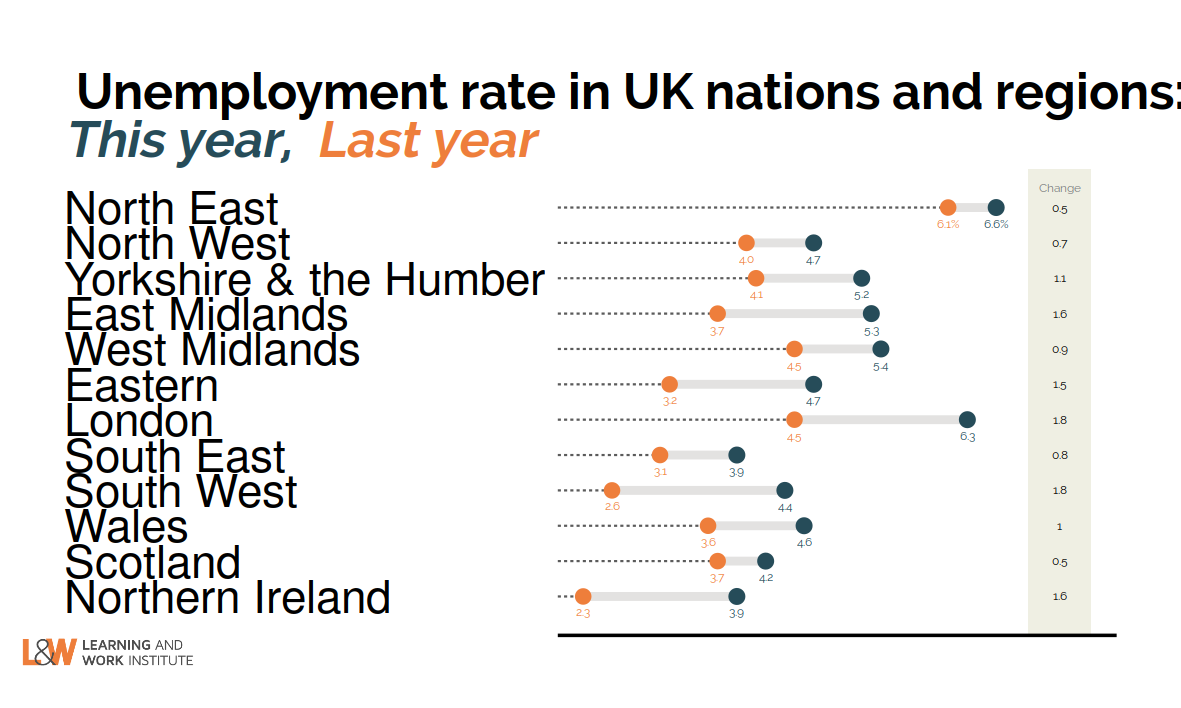
Chart 18: Unemployment rate annual change in regions to– August 2020 to October 2020
Compared to last year, all regions showed a rise in unemployment. The largest rises were in the South West and London.
 |
|
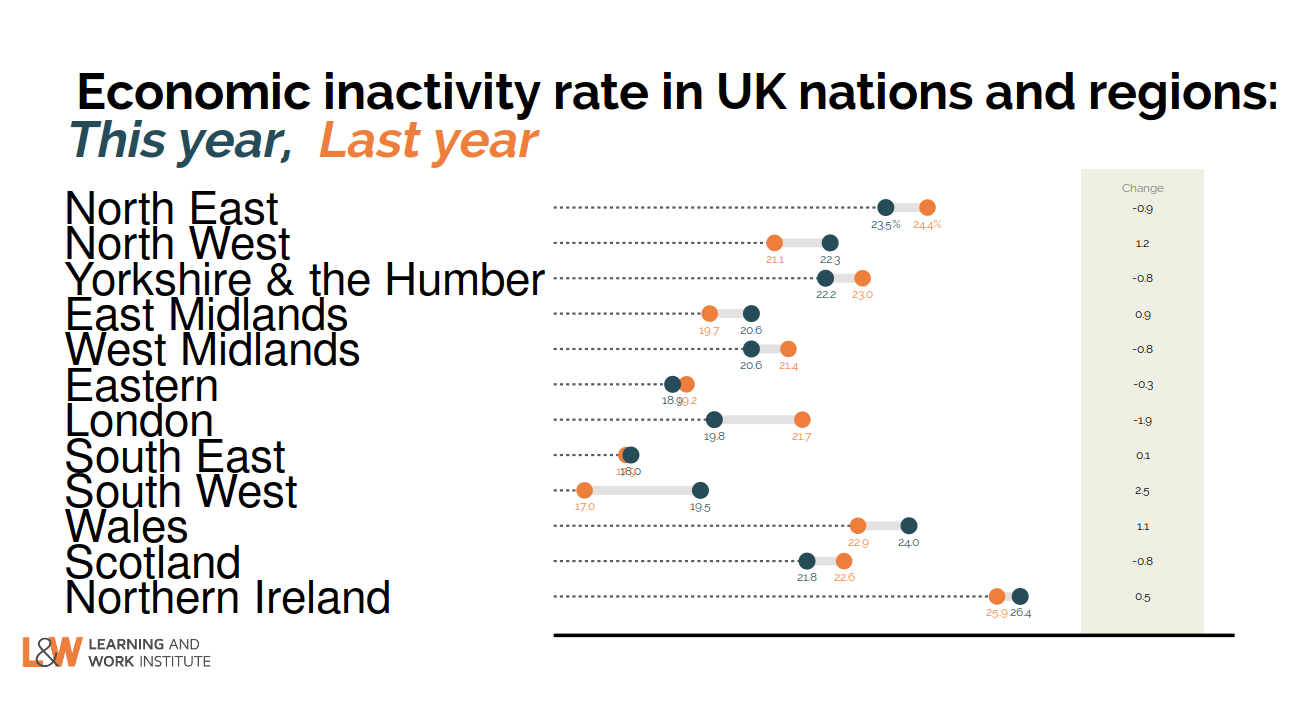
Chart 19: Inactivity rate annual change in regions to– August 2020 to October 2020
Compared to last year, six regions showed a rise in the inactivity rate, led by the South West and the North West, while six showed falls, led by London and the North East.
 |
|
This newsletter is produced by Learning and Work Institute and keeps readers up to date on a wide range of learning and work issues.
If you have any questions, contact Paul Bivand
© 2020 Learning and Work Institute. All rights reserved. Click here to update your info
Click here to unsubscribe | Click here to see a web copy of this email
|
|