 |
|
| Making learning and work count Labour market LIVE from Learning and Work Institute 13 October 2020
Learning and Work Institute comment |
|
| Chart 1: Jobseeker’s Allowance and Universal Credit claimant count The ONS headline Jobseeker’s Allowance and Universal Credit claimant count rose by 28,070 in September, taking the total to 2,731,744. ONS' claimant count before seasonal adjustment rose by 22,080 to 2,718,900. This change is directly comparable to the local level claimant count changes published today. 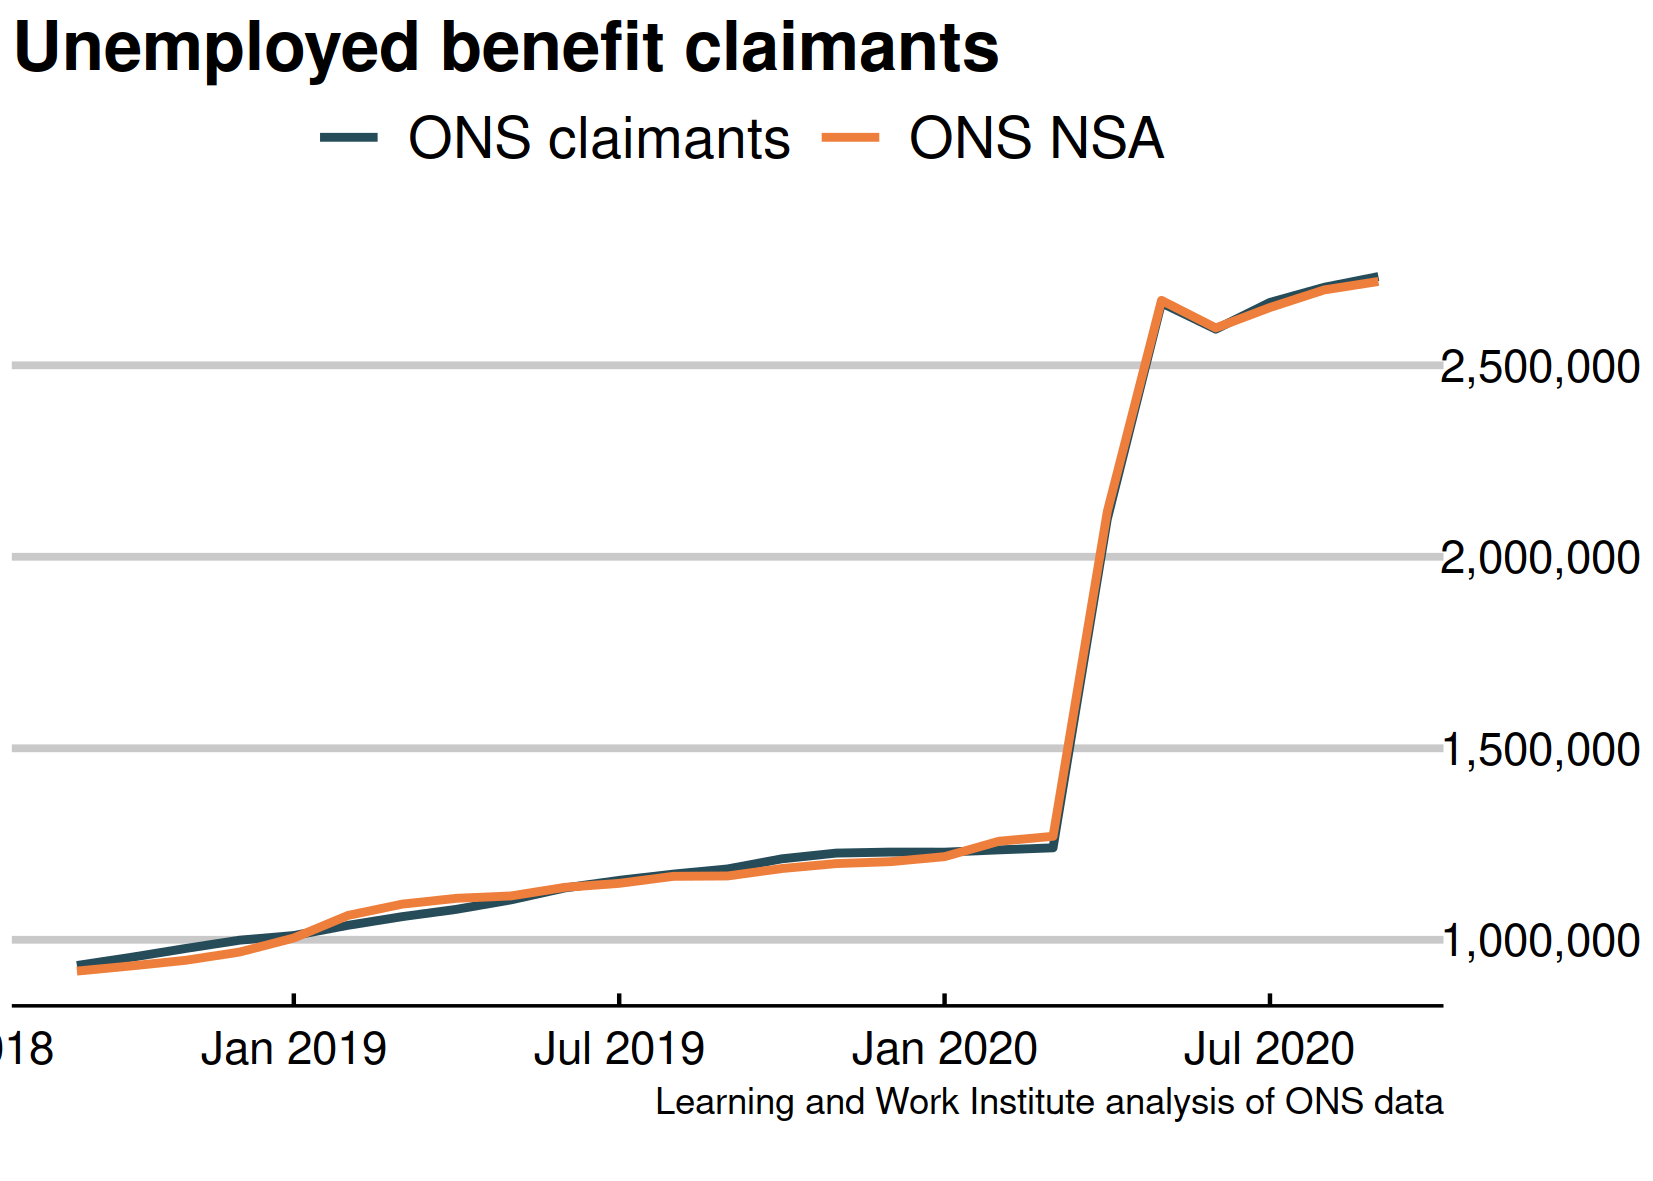 |
|
| Chart 2: UK unemployment (ILO) - the official estimate The latest unemployment figure is 1,522,000. It has increased by 71,000 on last month's revised estimate, and by 125,000 from the figure published last month. The unemployment rate rose by 0.2 percentage points to 4.5%. 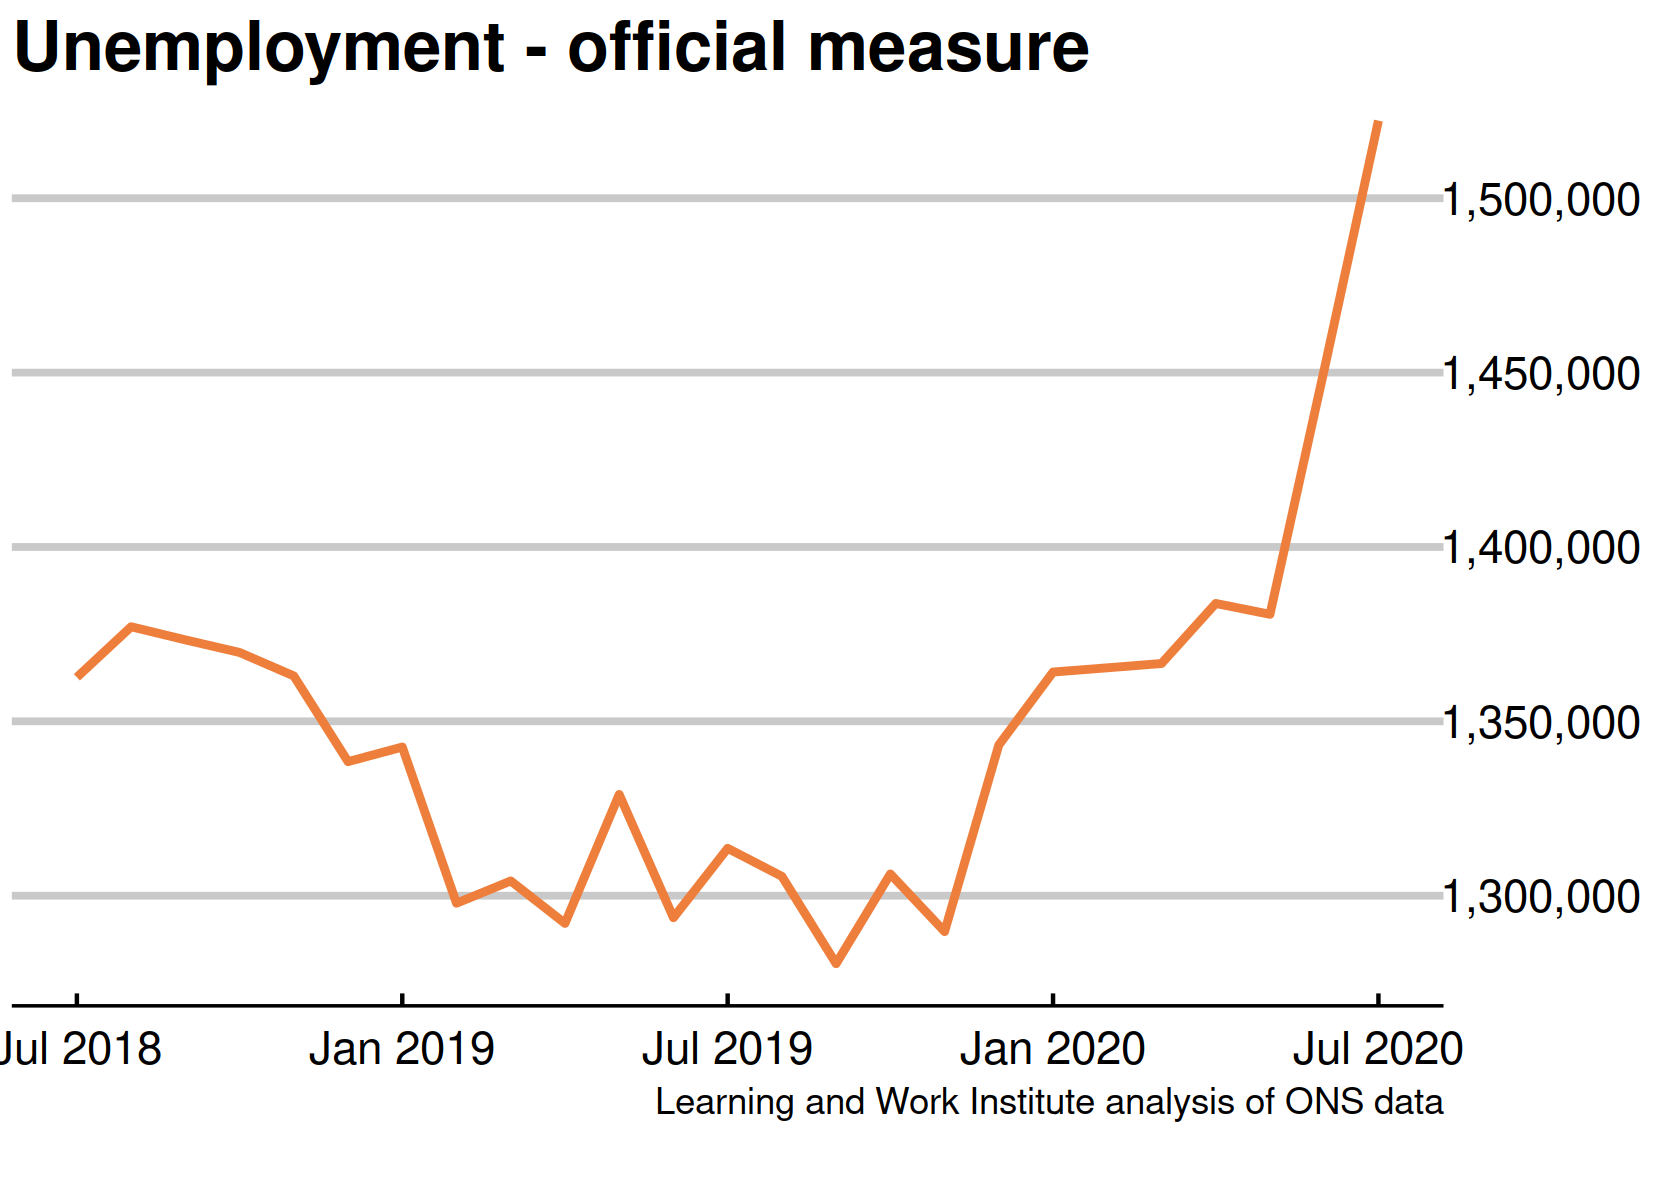 |
|
| Chart 3: Youth unemployment The youth unemployment figures have not been updated in October, so the latest figure is 563,000. Meanwhile, the number of young Universal Credit or Jobseeker’s Allowance claimants rose in September by 3,100, to 529,400. There are now 159,000 more young claimants of Universal Credit or Jobseeker's Allowance than the number of unemployed young people who are not in education. 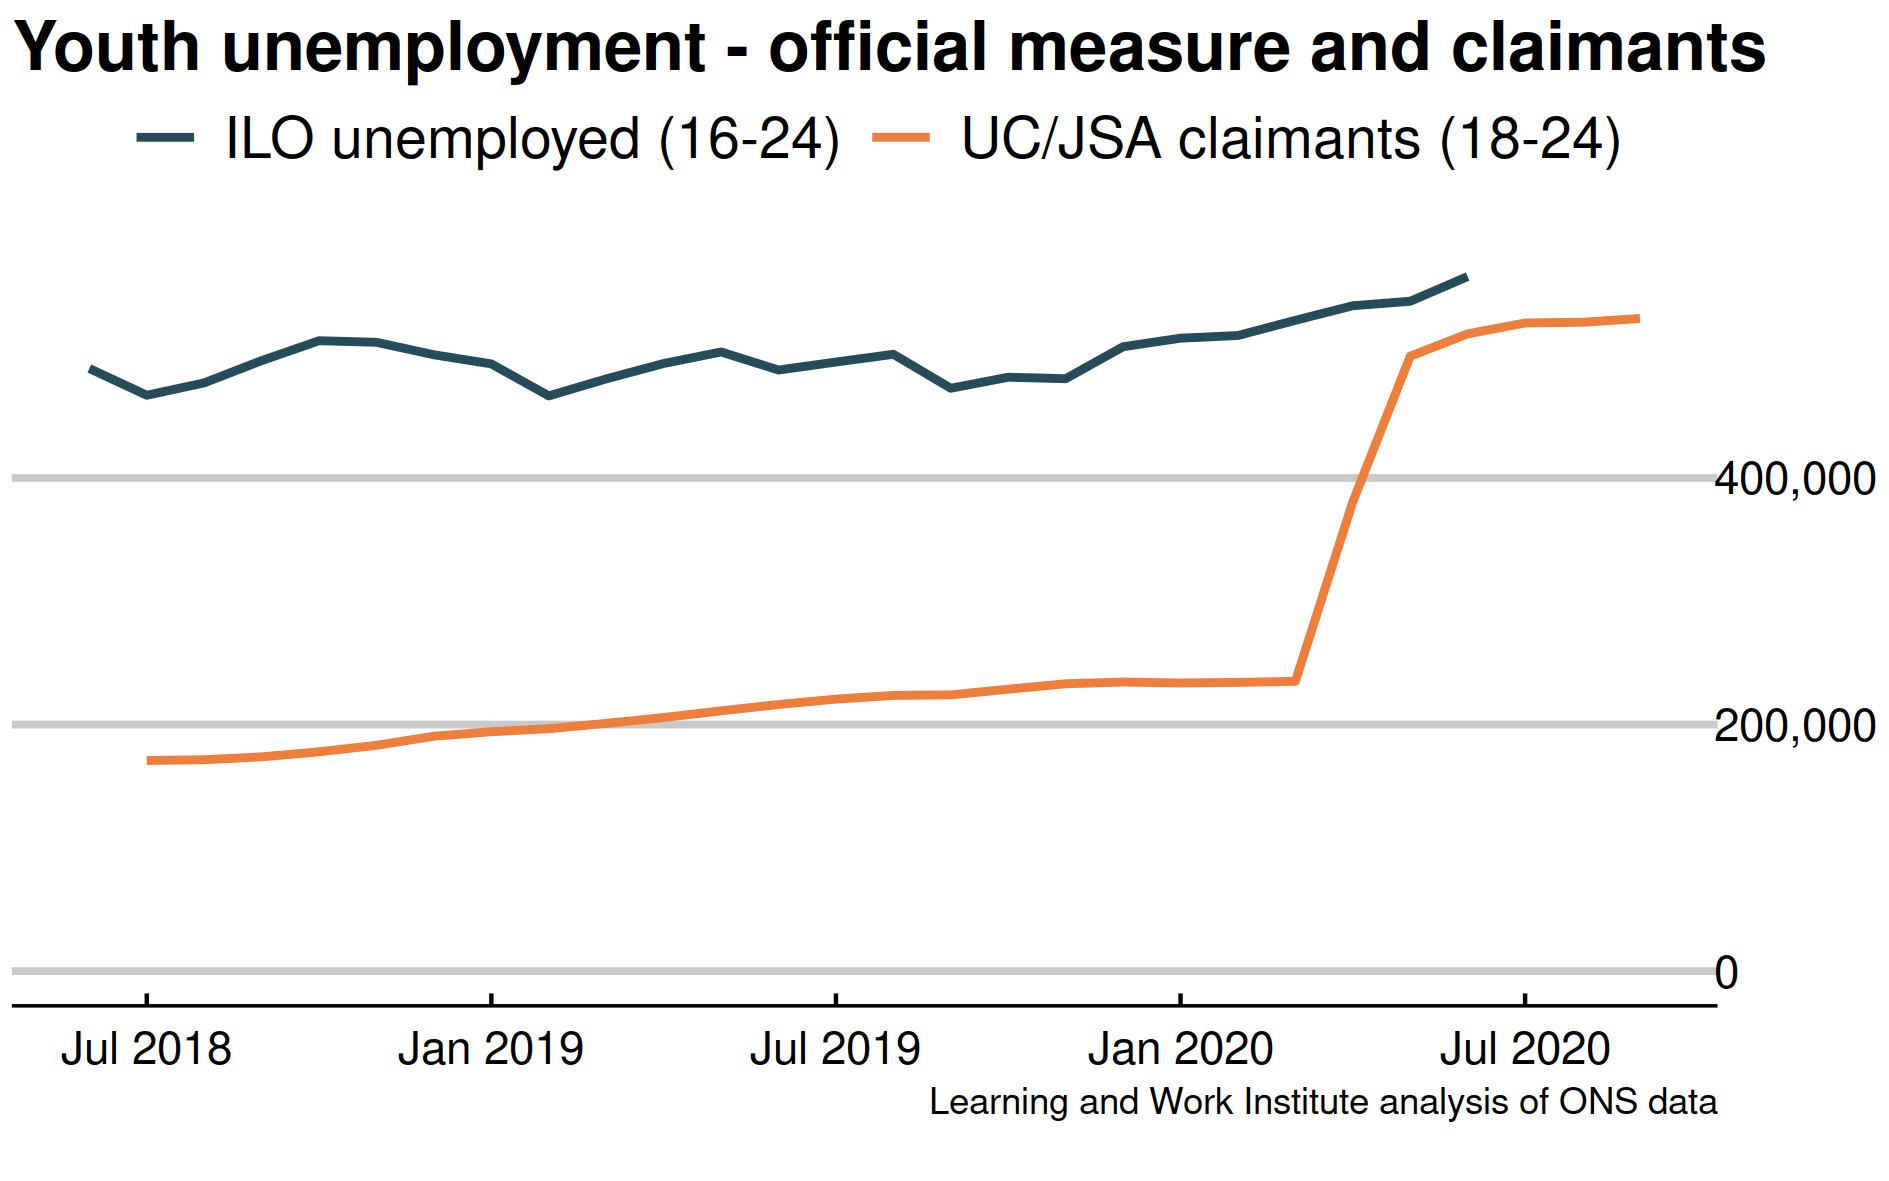 |
|
| Chart 4: Vacancies – whole economy survey Headline vacancies recovered very slightly this month, to 488,000. The ONS' experimental single-month vacancy figures shows a more substantial recovery from 327,000 in May, to 517,000 in September. The headline ONS vacancy figure is both seasonally adjusted and a three-month average. The chart shows both series. 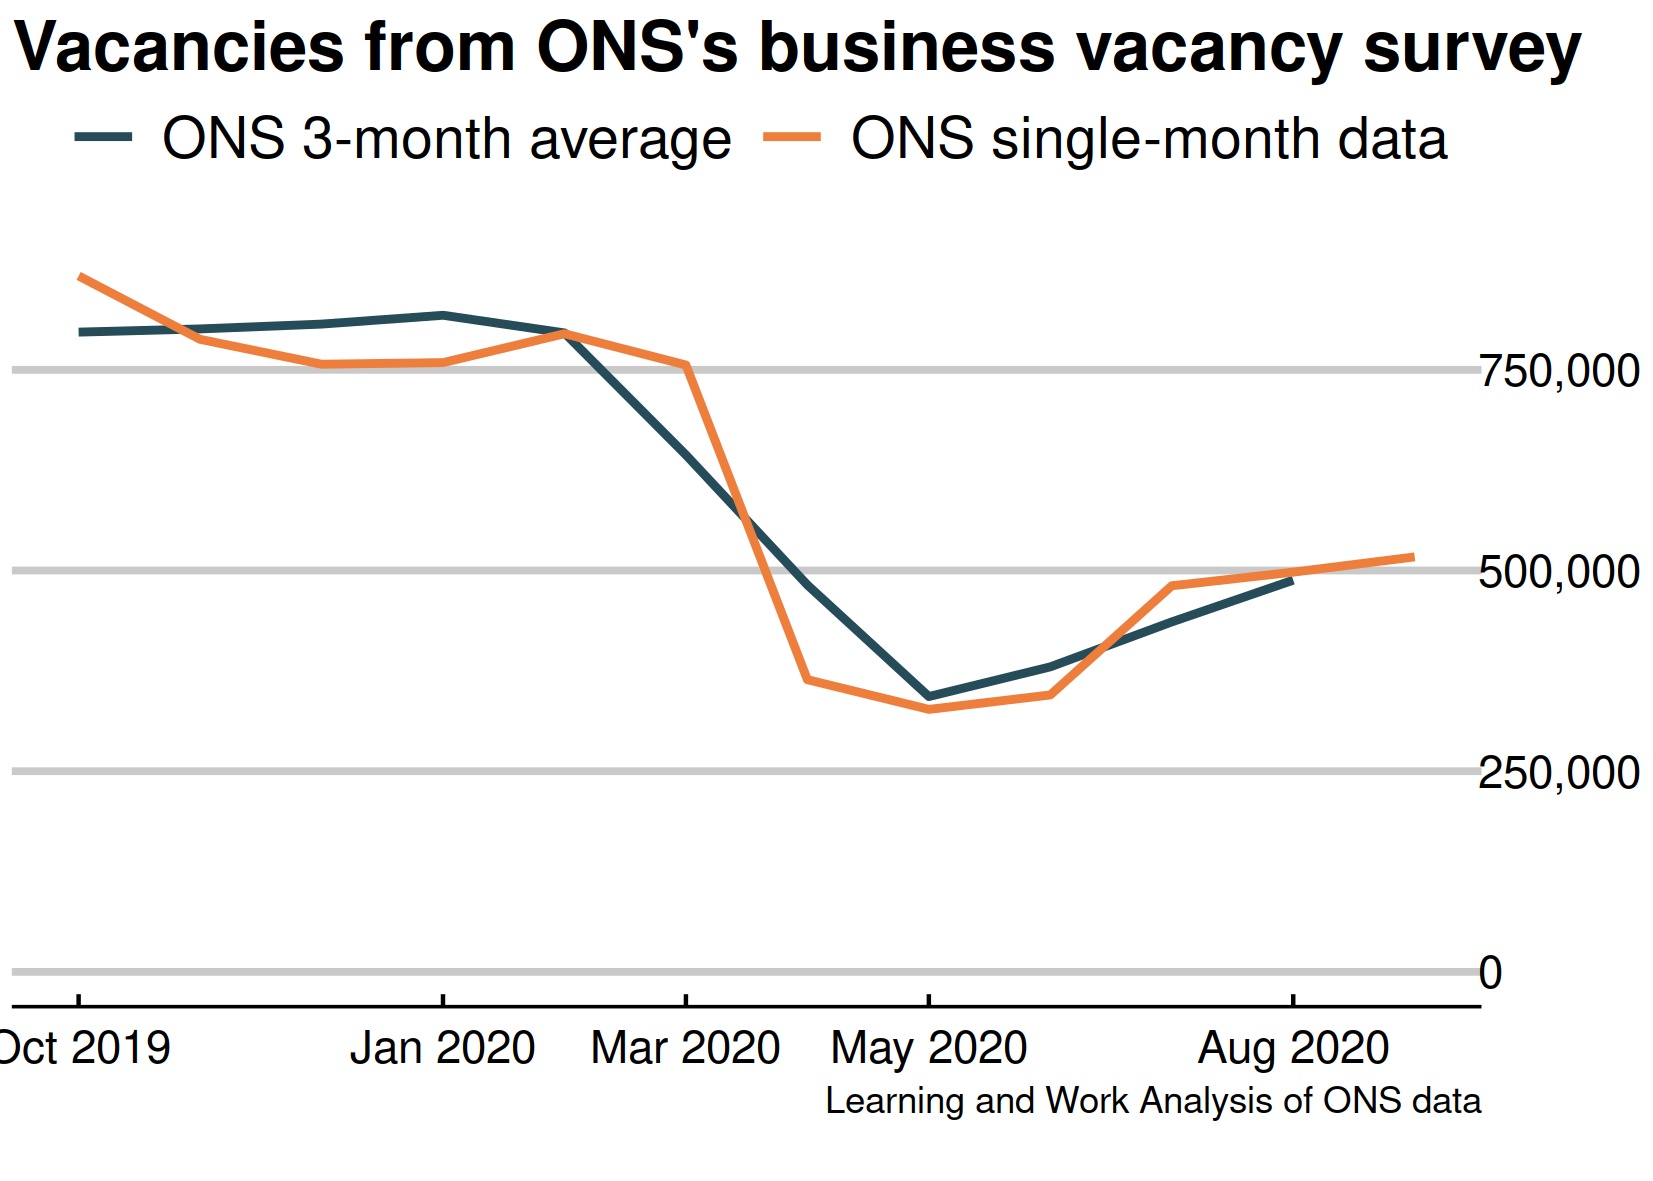 |
|
| Chart 5: Experimental single month vacancies – whole economy survey The Office for National Statistics experimental single month vacancy estimates include sectoral information. As these are not seasonally adjusted, it is better to look at annual changes. This is a new presentation, which we hope will show the context in an improved way. 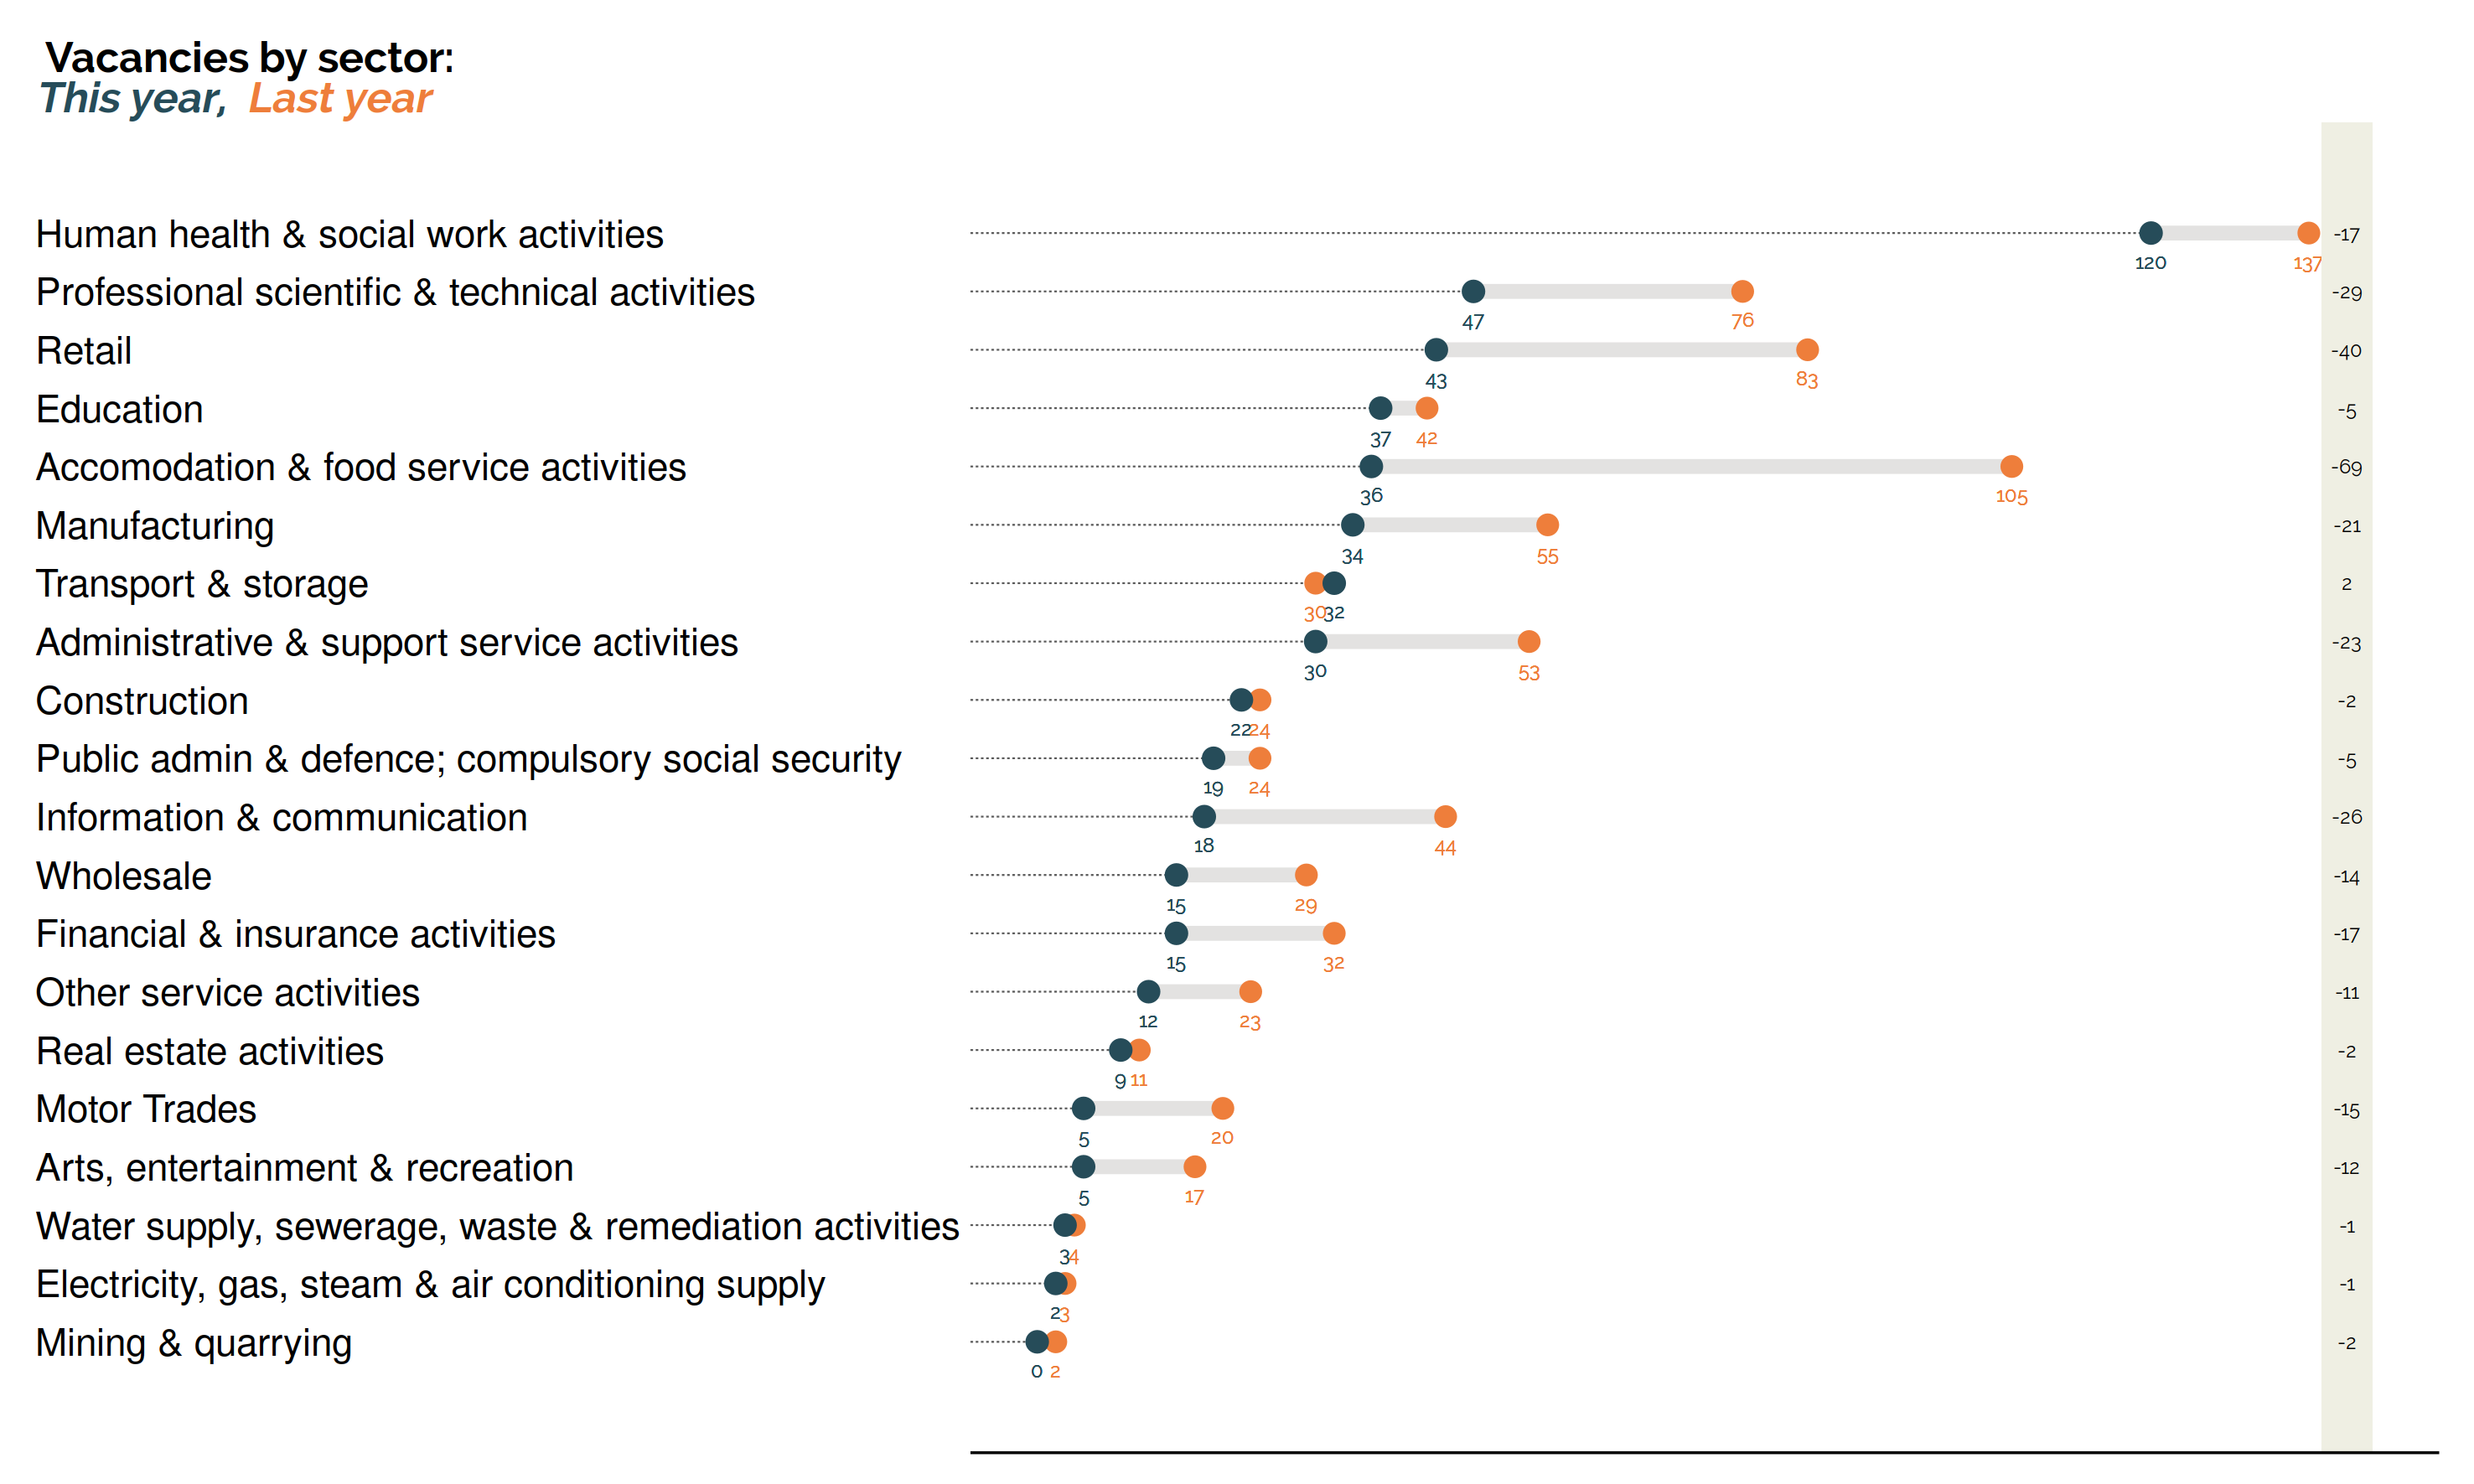 |
|
| Chart 6: Unemployment rates by age The unemployment figures by age have not been updated in this release. However, we think it is useful to give this context from last month's release. The 18 to 24 year old unemployment rate (including students) is 12.3% of the economically active – excluding one million economically inactive students from the calculation. The rate for those aged 25 to 49 is 2.9%. For those aged 50 and over it is 2.6%. The quarterly change is up 1.6 for 18 to 24 year olds, up 0.1 for 25 to 49 year olds, and up 0.1 for the over-50s. 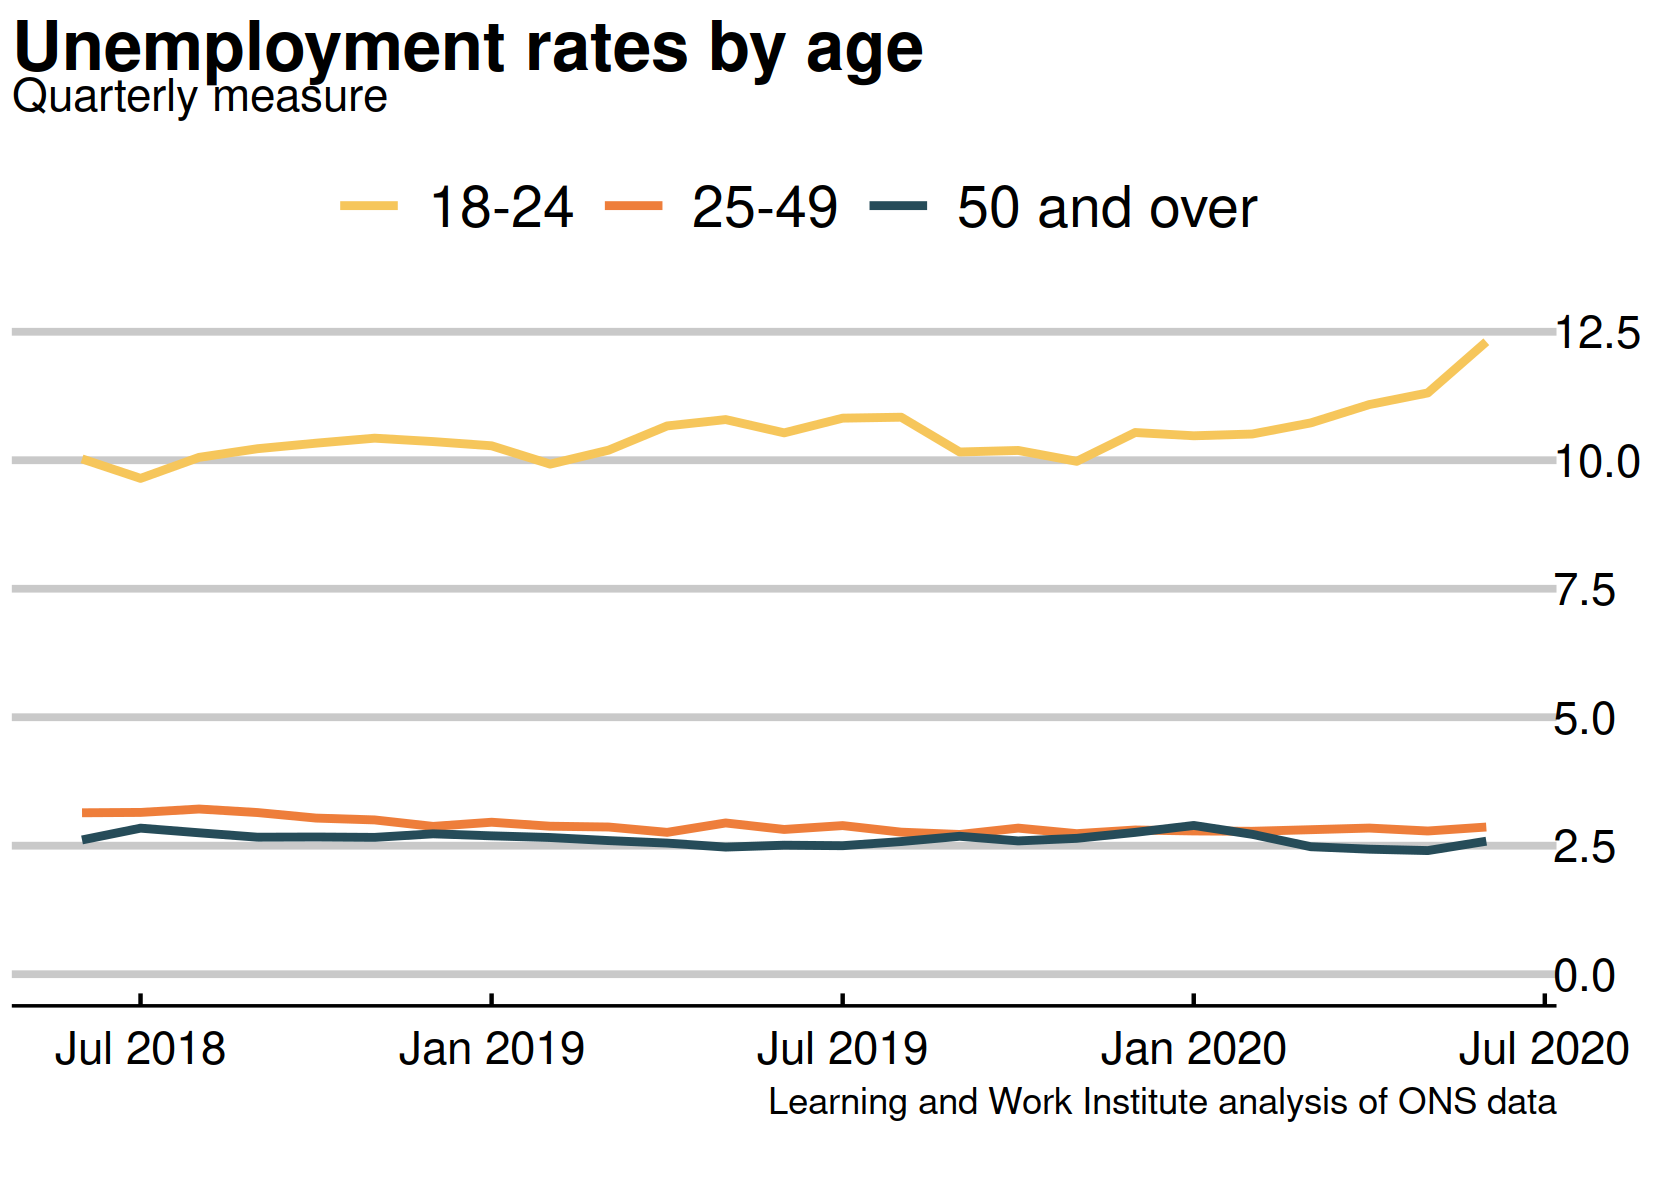 |
|
| Chart 7: UK employment Employment has fallen by 75,000 on last month's revised figure, to 32,591,000. The data revision accounted for a further fall of 314,000 on last month's published figure. 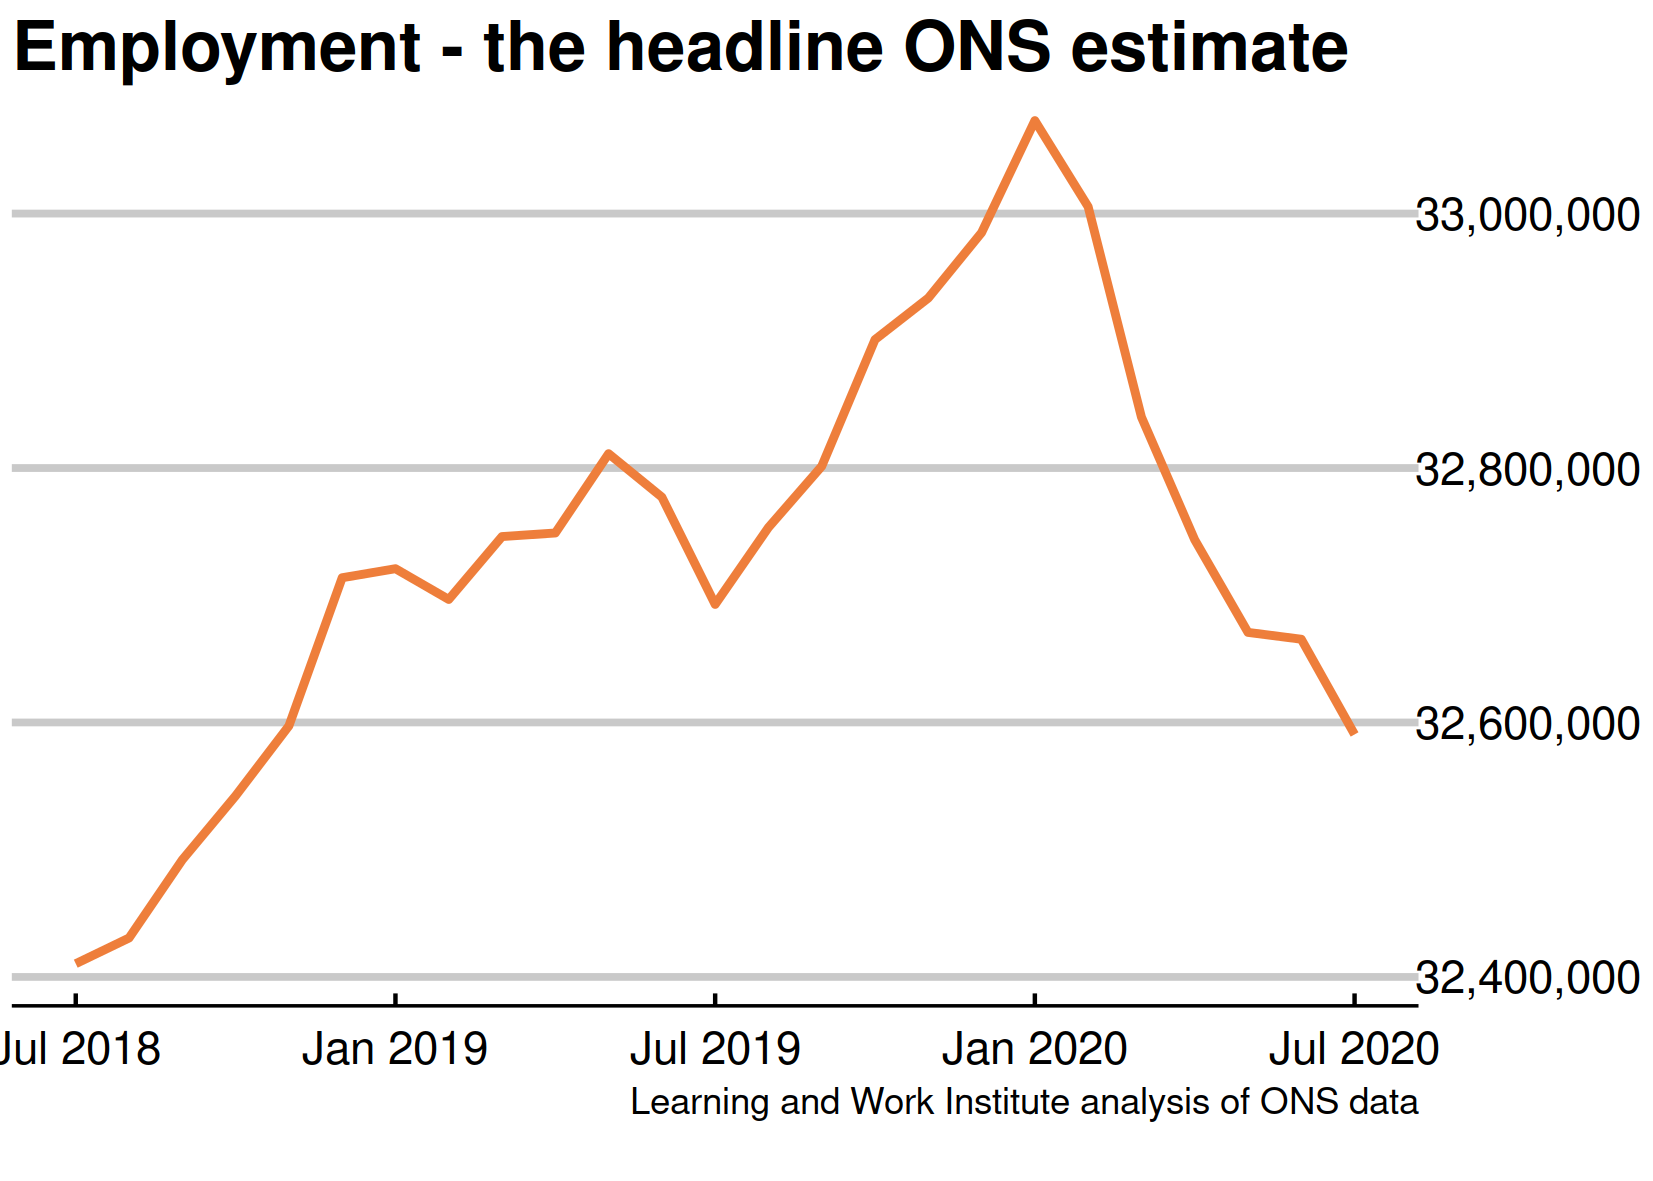 |
|
| Chart 8: Employment rate in the UK The employment rate has fallen by 0.3 percentage points over the quarter, to 75.6%. The data revision accounted for a further 0.6 percentage points fall on last month's published figure. 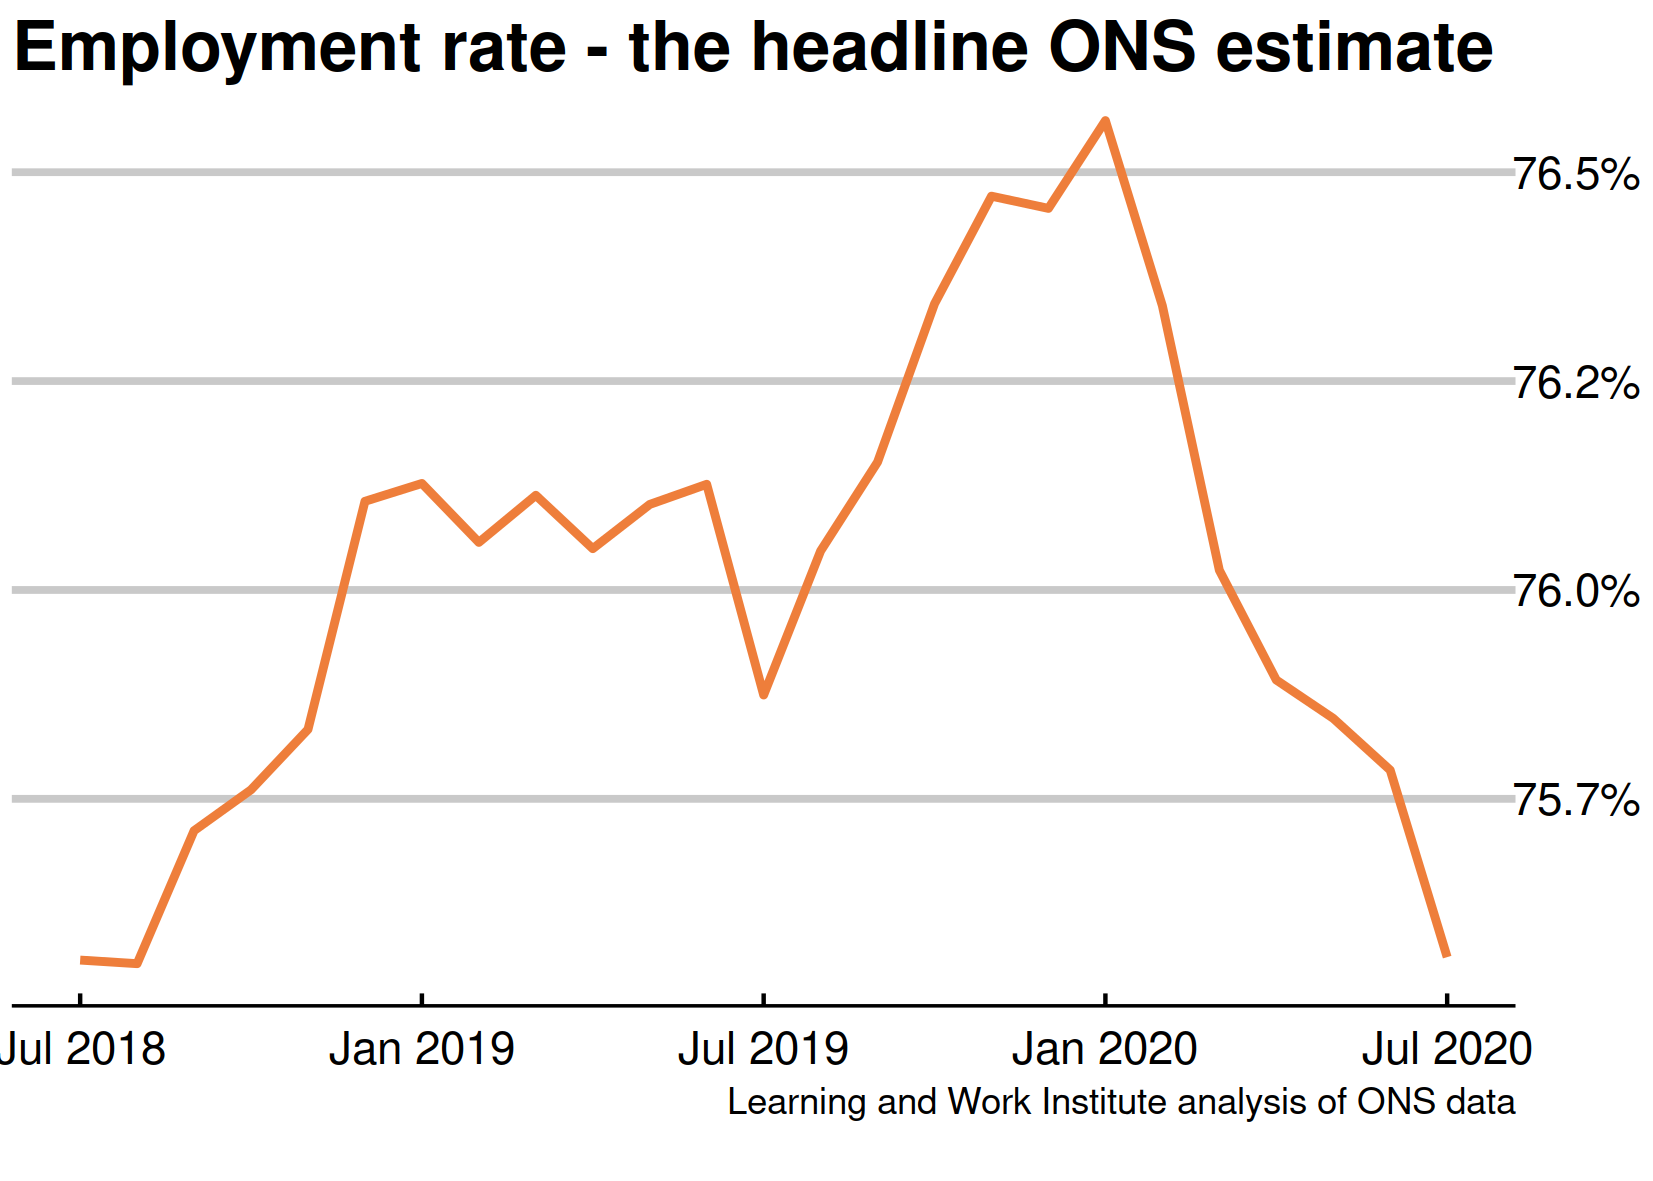 |
|
| Chart 9: Claimants for inactive benefits and the economically inactive – inactivity benefits The number of people inactive owing to long-term sickness rose, while the latest benefit figures (for February 2020) rose. The survey revision has resulted in a reassessment of the recent trend - previous figures had shown a sharp drop in the inactive, long-term sick, which has now been revised into a continuing upwards trend. This chart shows claimants of Employment and Support Allowance, and Universal Credit without work requirements (the orange dots), compared with survey figures for the economically inactive owing to long-term sickness. Survey responses as to the reasons for inactivity may be volatile at the moment. 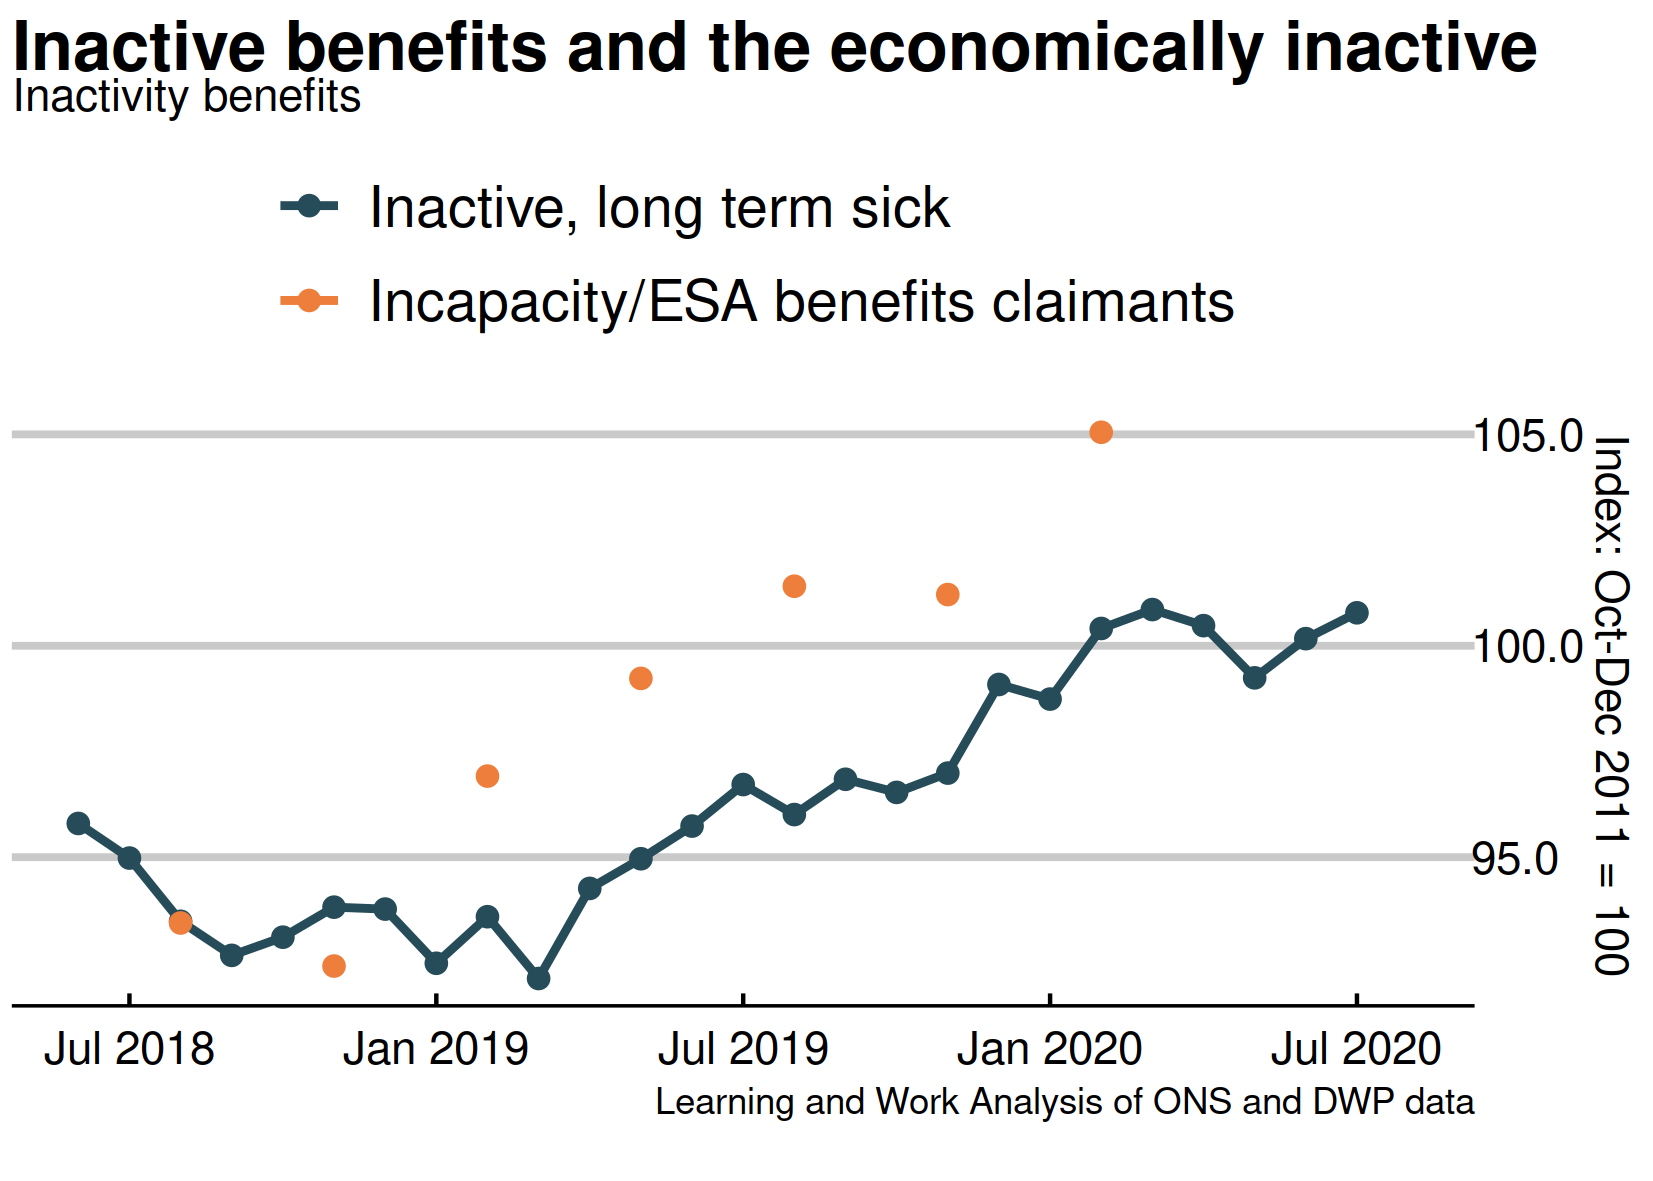 |
|
| Chart 10: Claimants for inactive benefits and the economically inactive – lone parents This chart shows claimants of out of work benefits as lone parents (the orange dots) and survey figures for all those who are economically inactive looking after family (including couple families). The survey figures (showing those looking after family) fell sharply while benefit measures continued to fall in the latest (February 2020) data. 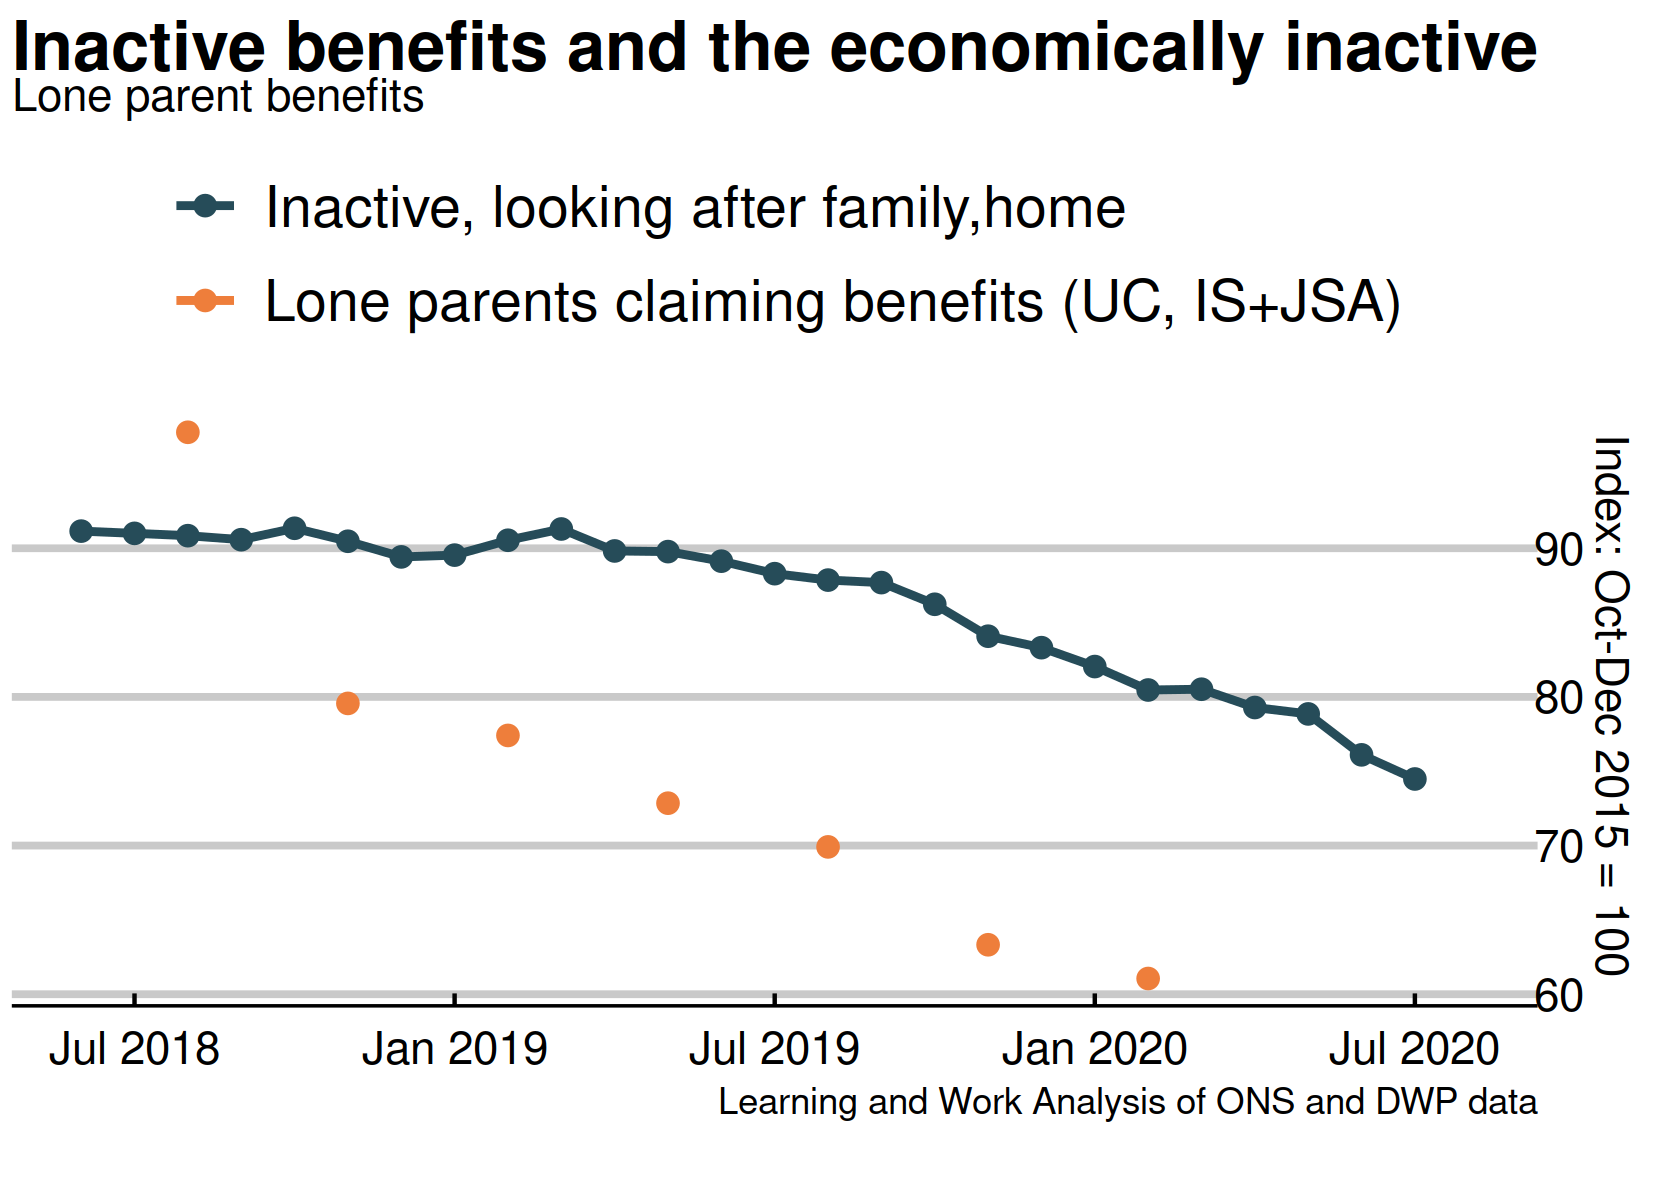 |
|
| Chart 11: Employment rate annual change in regions to– June 2020 to August 2020 Compared to last year, four regions showed a rise in the employment rate, while eight showed a fall. The largest rises were in London and the North West, and the largest falls were in the South West and Wales. 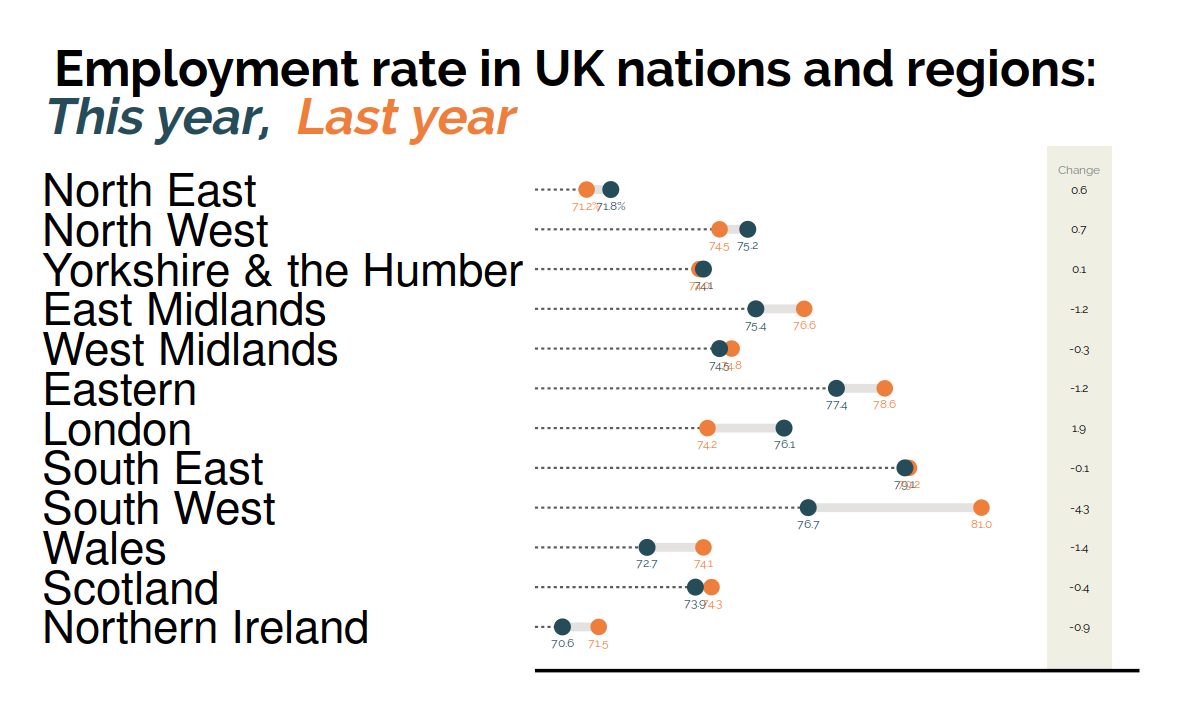 |
|
| Chart 12: Unemployment rate annual change in regions to – June 2020 to August 2020 Compared to last year, ten regions showed a rise in unemployment, while two showed a fall. The largest rises were in the South West, and the North East. The falls were in Wales and the East Midlands. 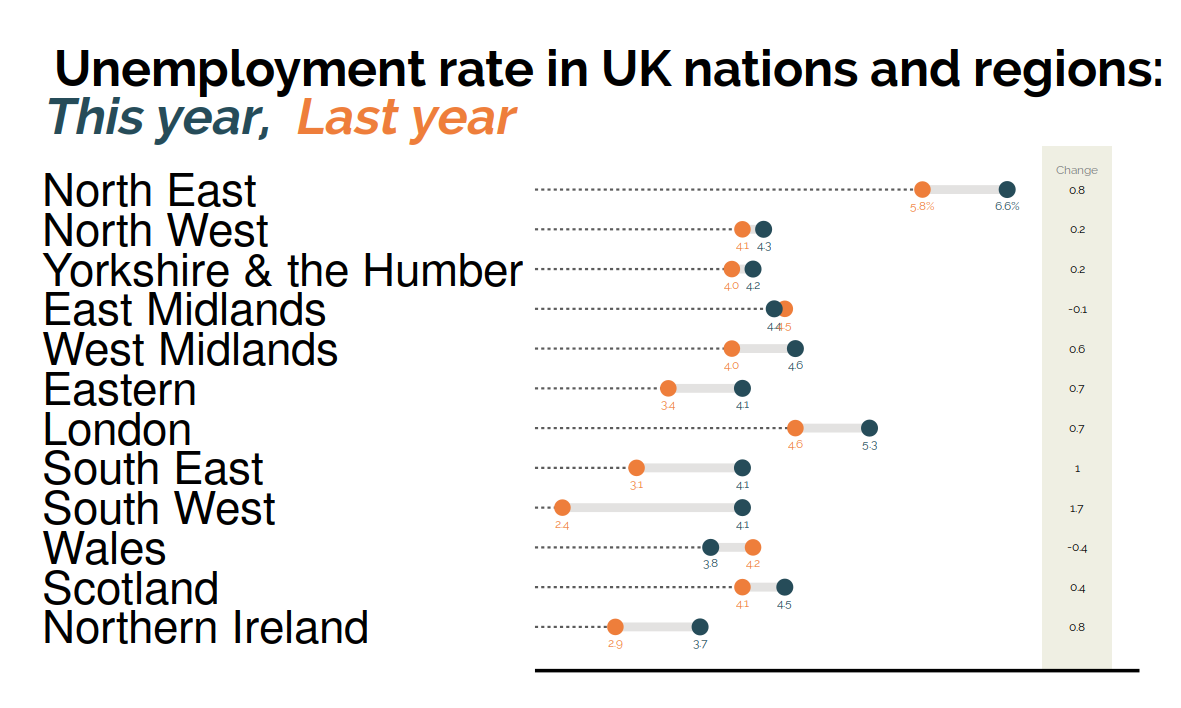 |
|
| Chart 13: Inactivity rate annual change in regions to– June 2020 to August 2020 Compared to last year, six regions showed a rise in the inactivity rate, led by the South West and Wales, while six showed falls, led by the North East and the North West. 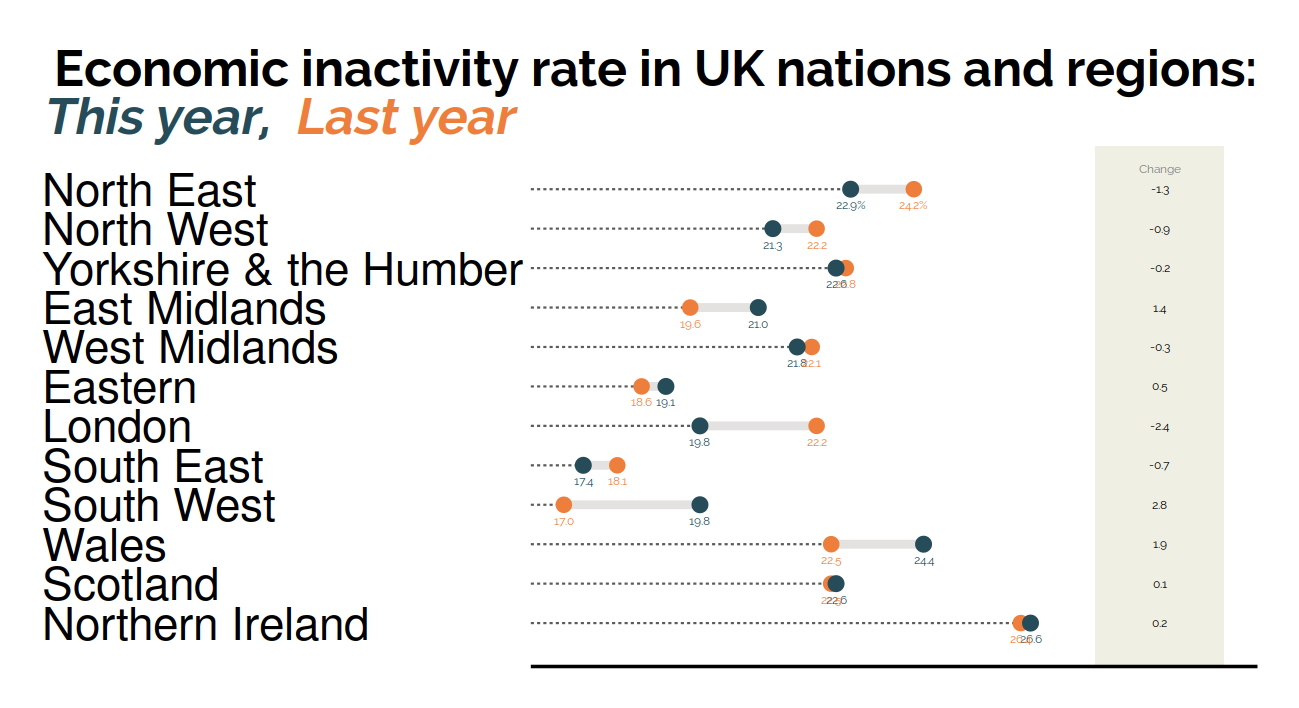 |
|
|
This newsletter is produced by Learning and Work Institute and keeps readers up to date on a wide range of learning and work issues. |
|