 |
|
| Making learning and work count Labour market LIVE from Learning and Work Institute 15 March 2022
Learning and Work Institute comment |
|
| Chart 1: UK unemployment (ILO) The latest unemployment rate decreased by 0.2 percentage points in the quarter to 3.9%. This compares to a decrease of 0.4 points in the previous quarter. 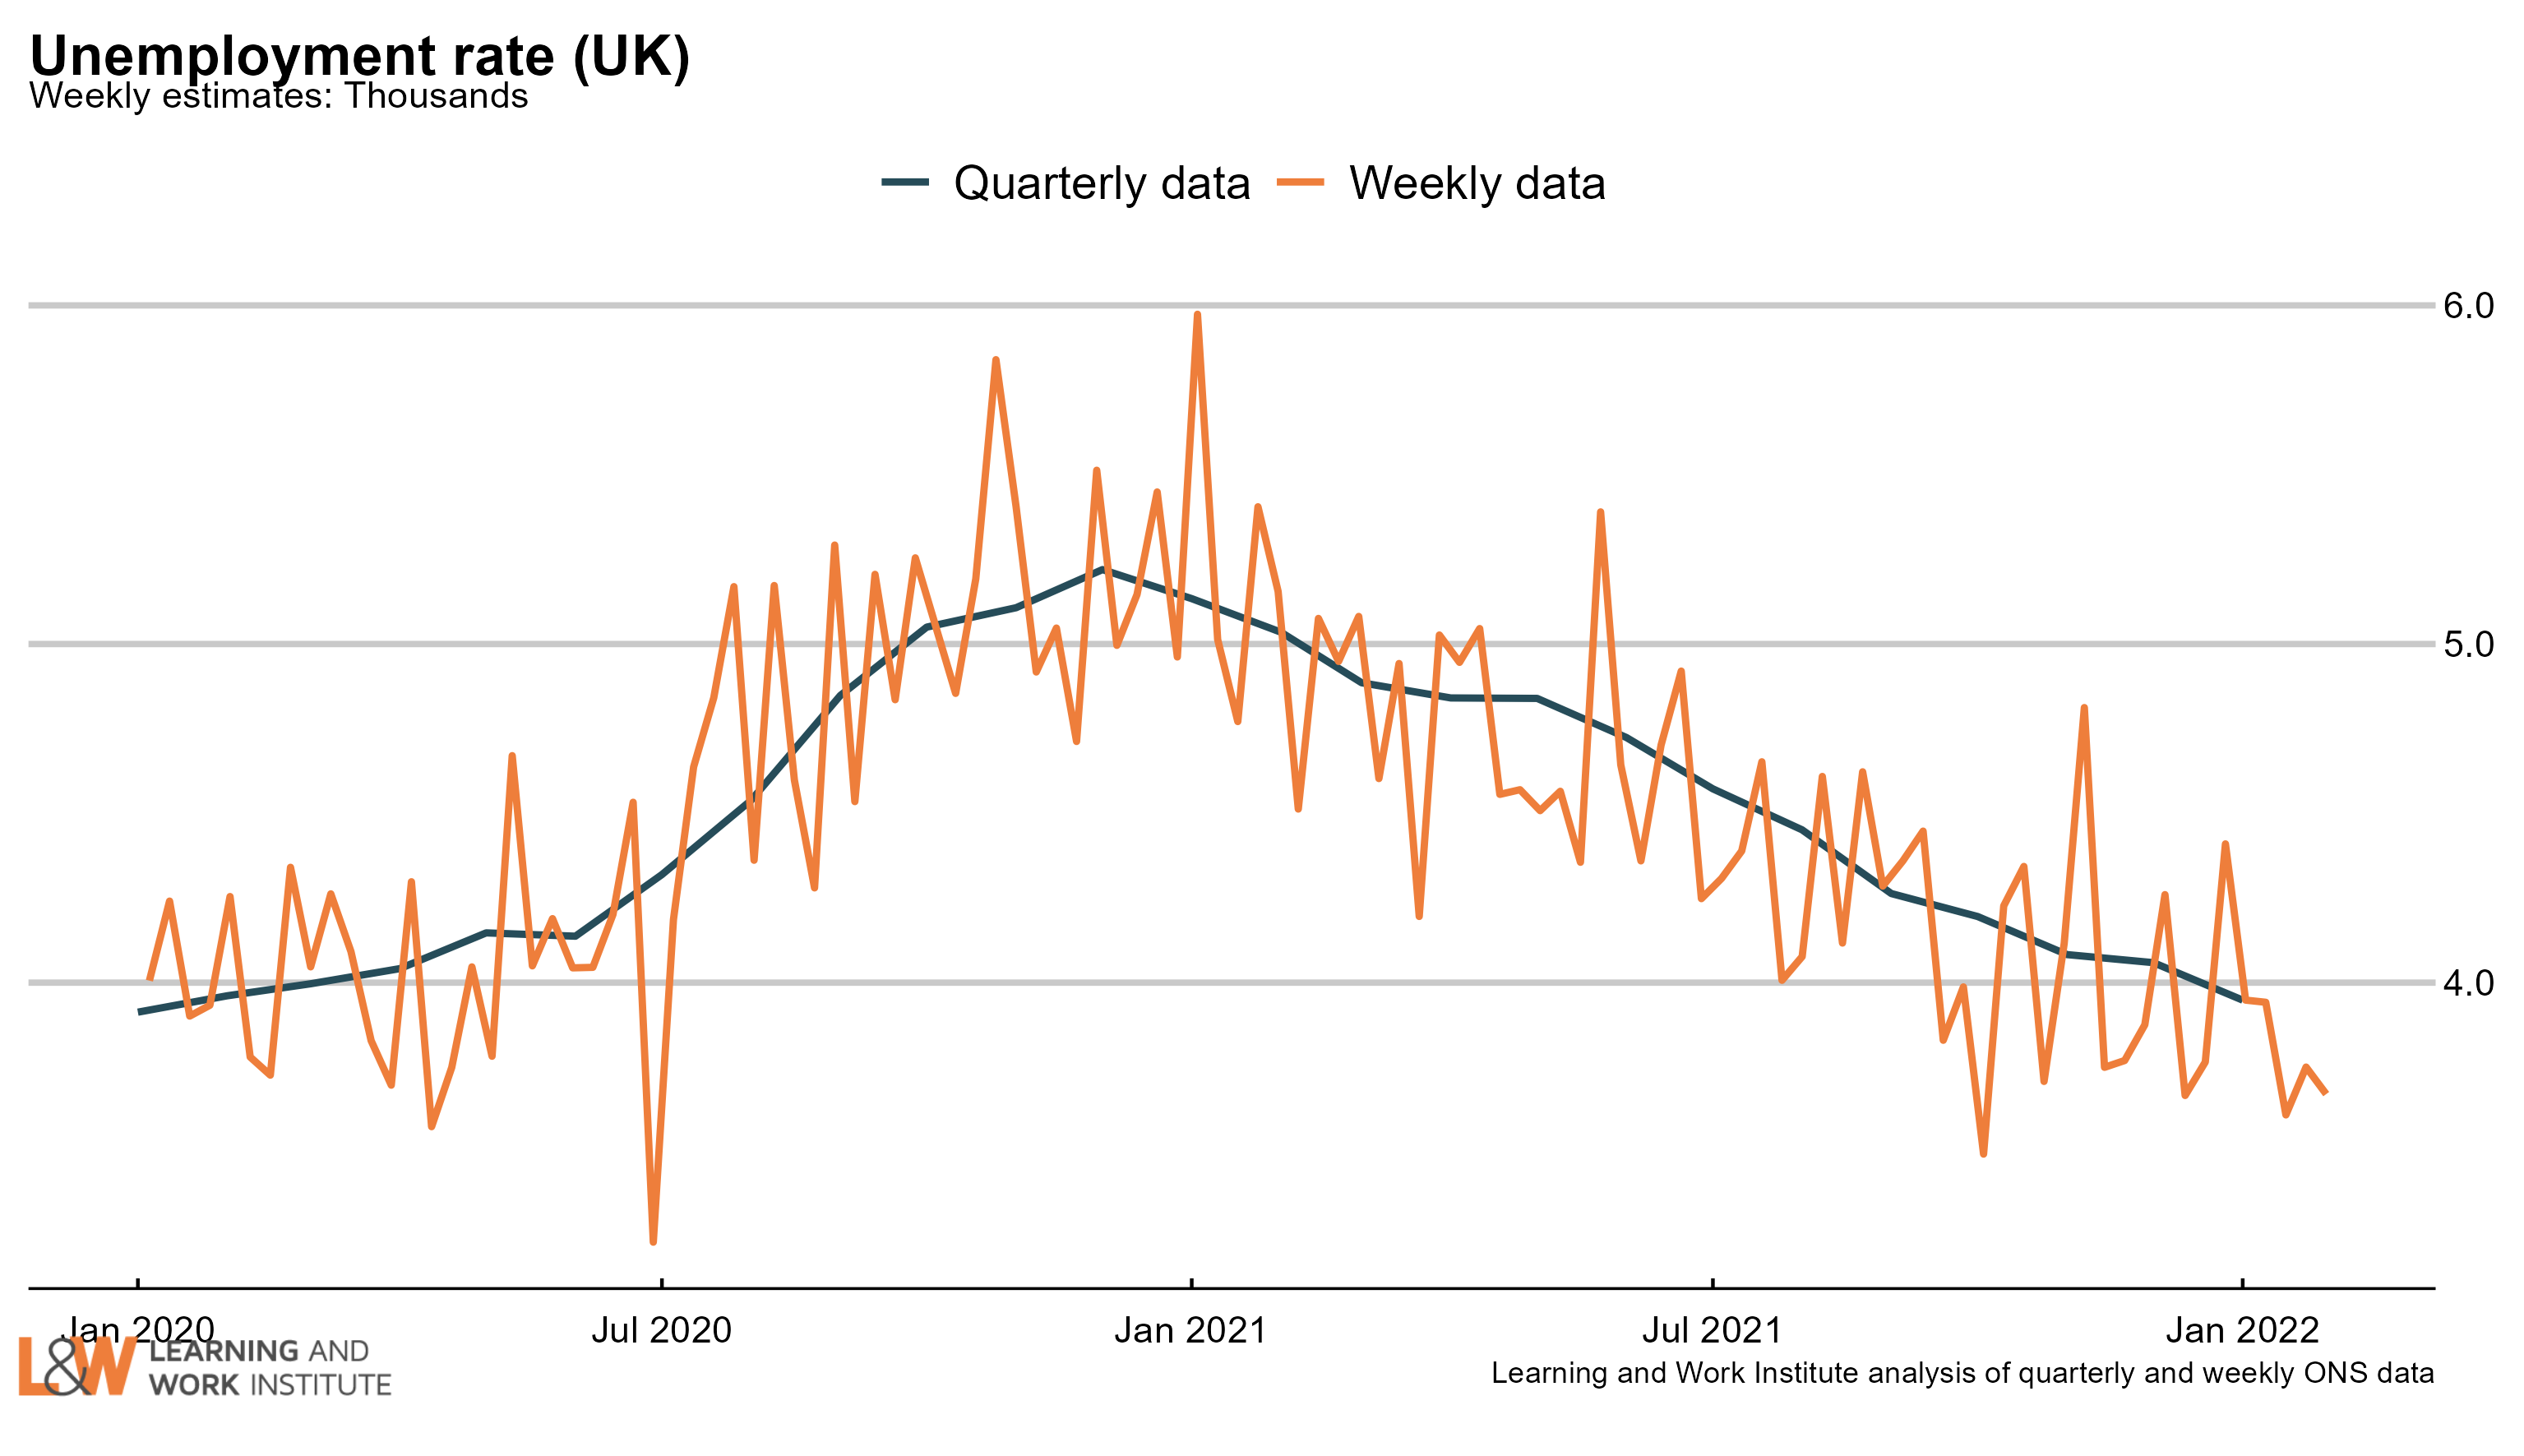 |
|
| Chart 2: The claimant count and UK unemployment compared The number of unemployed people who are claiming unemployment-related benefits is now 421,700 higher than the number of unemployed in the official measure, though the gap is closing. 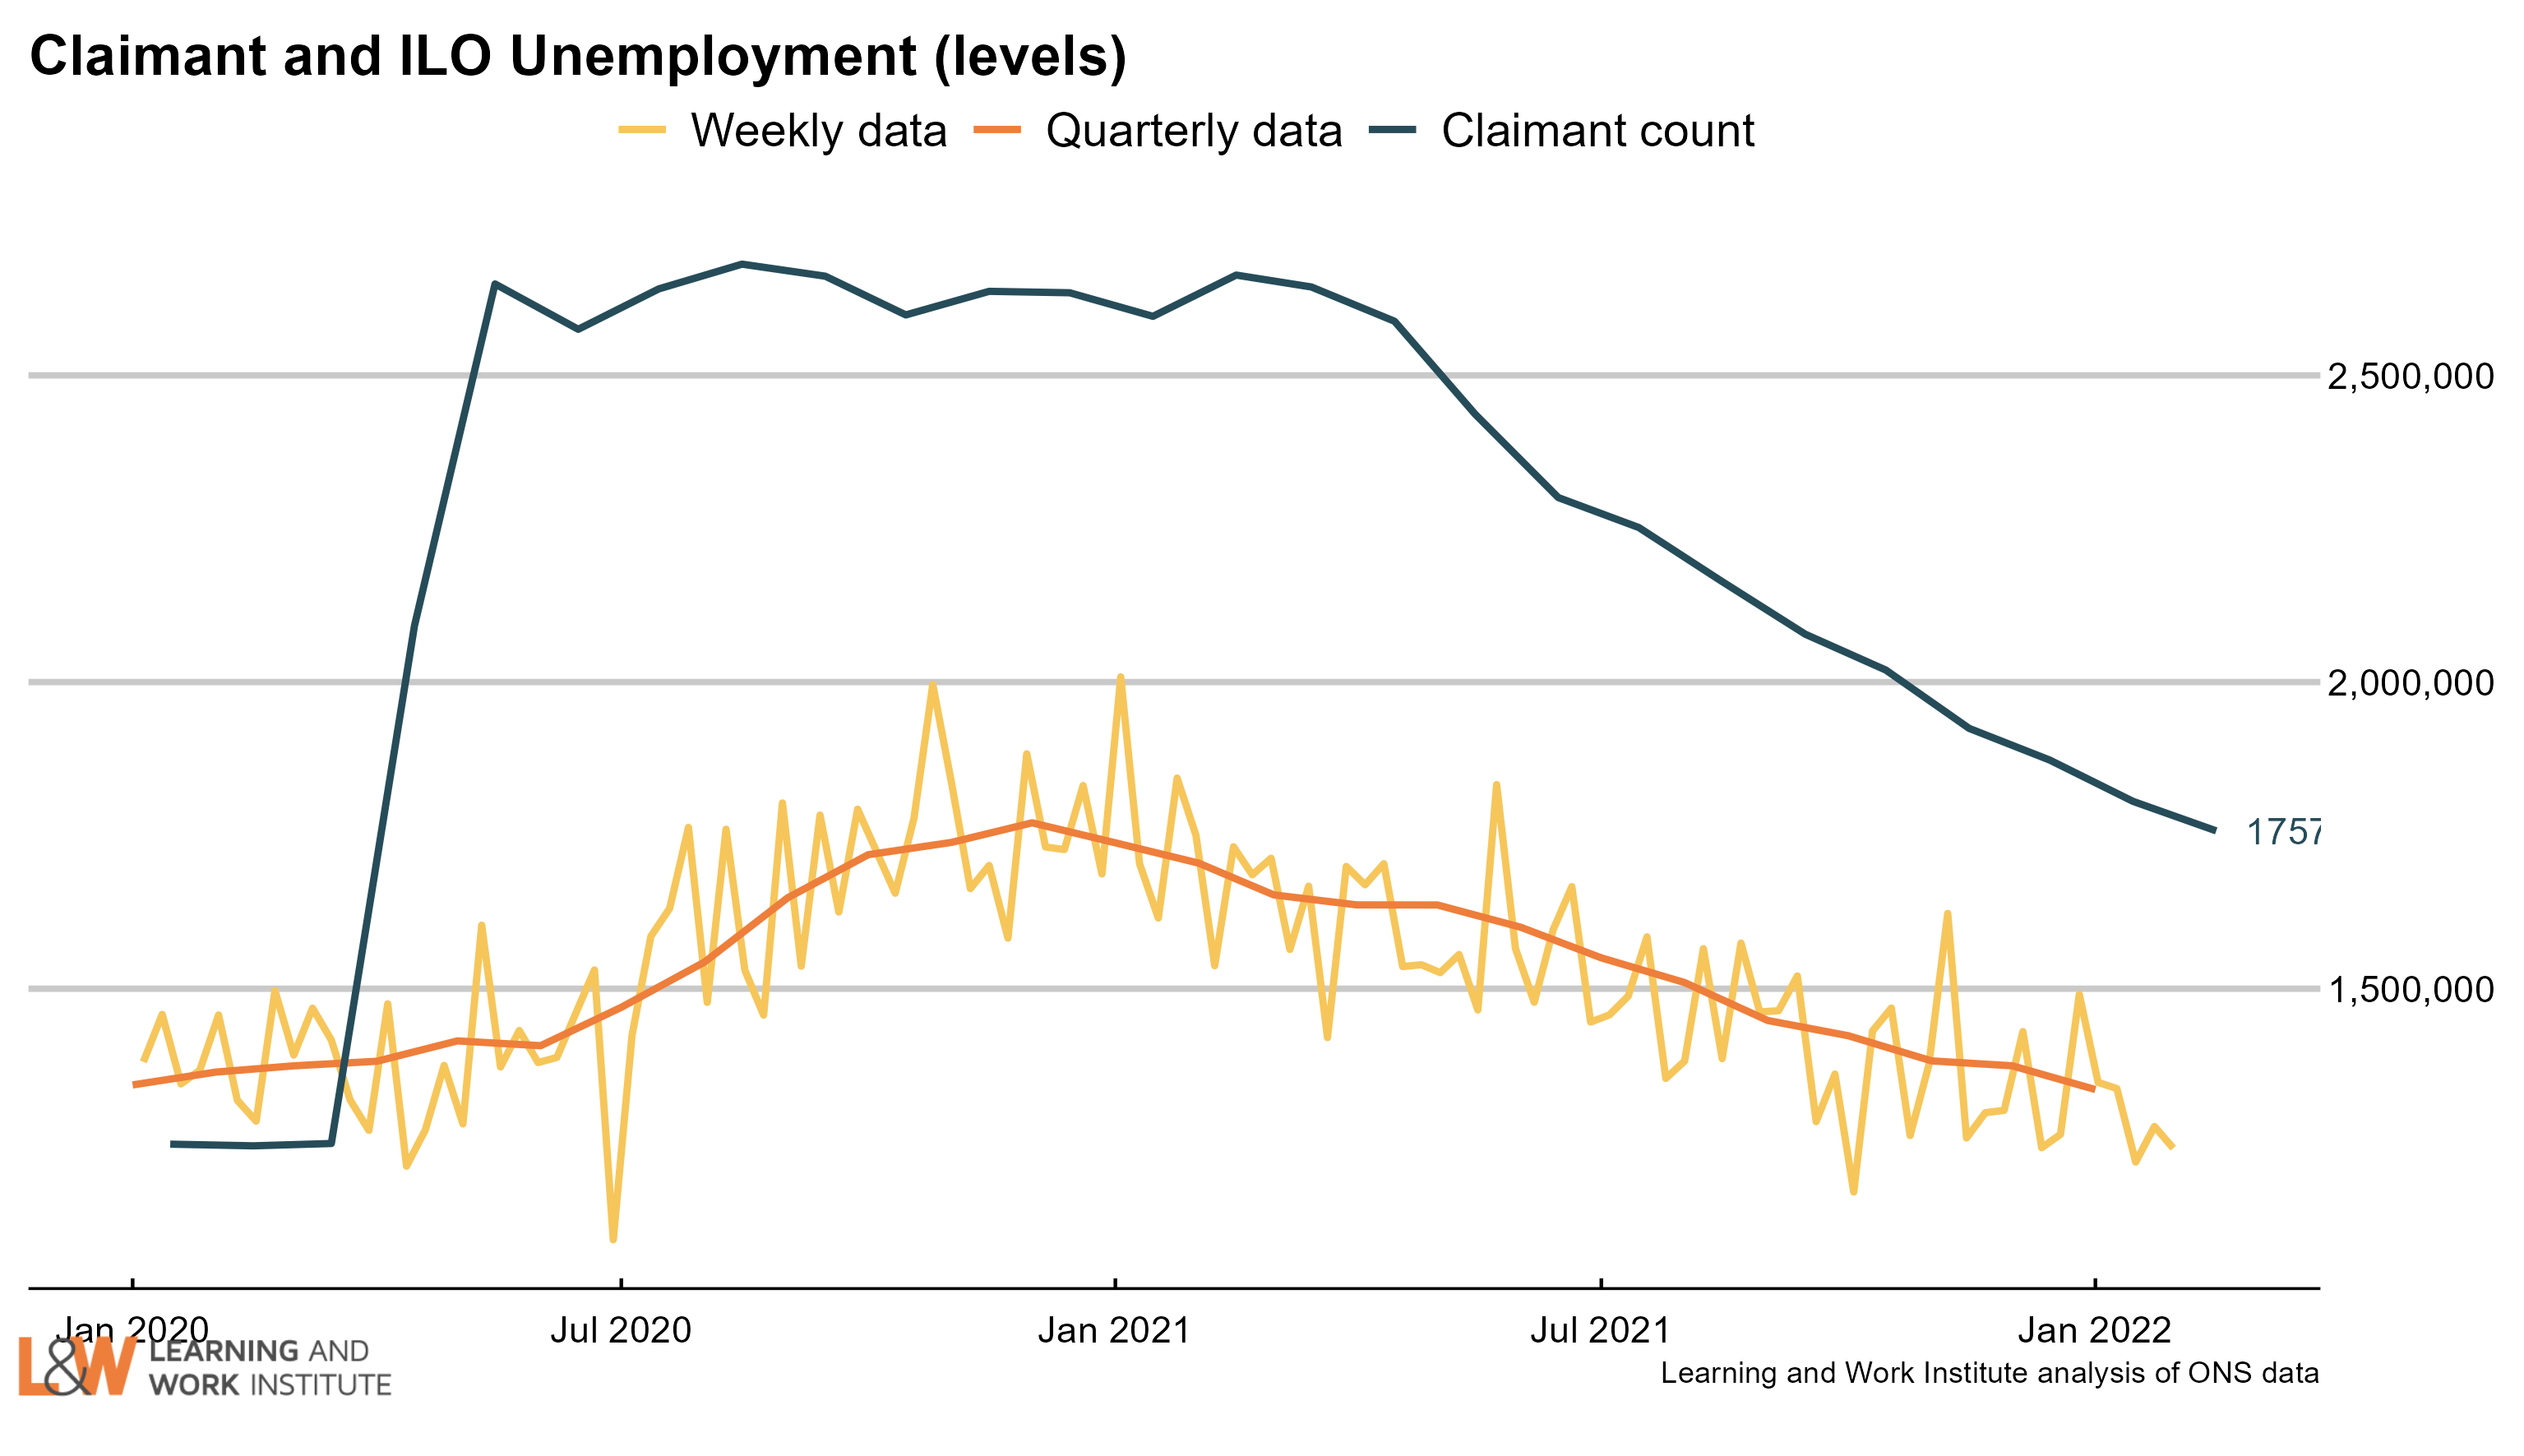 |
|
| Chart 3: Youth unemployment The number of unemployed young people has fallen by 8,000 since last month’s figures, to 457,000. Meanwhile, the number of young Universal Credit or Jobseeker’s Allowance claimants fell last month by 7,200, to 285,800. 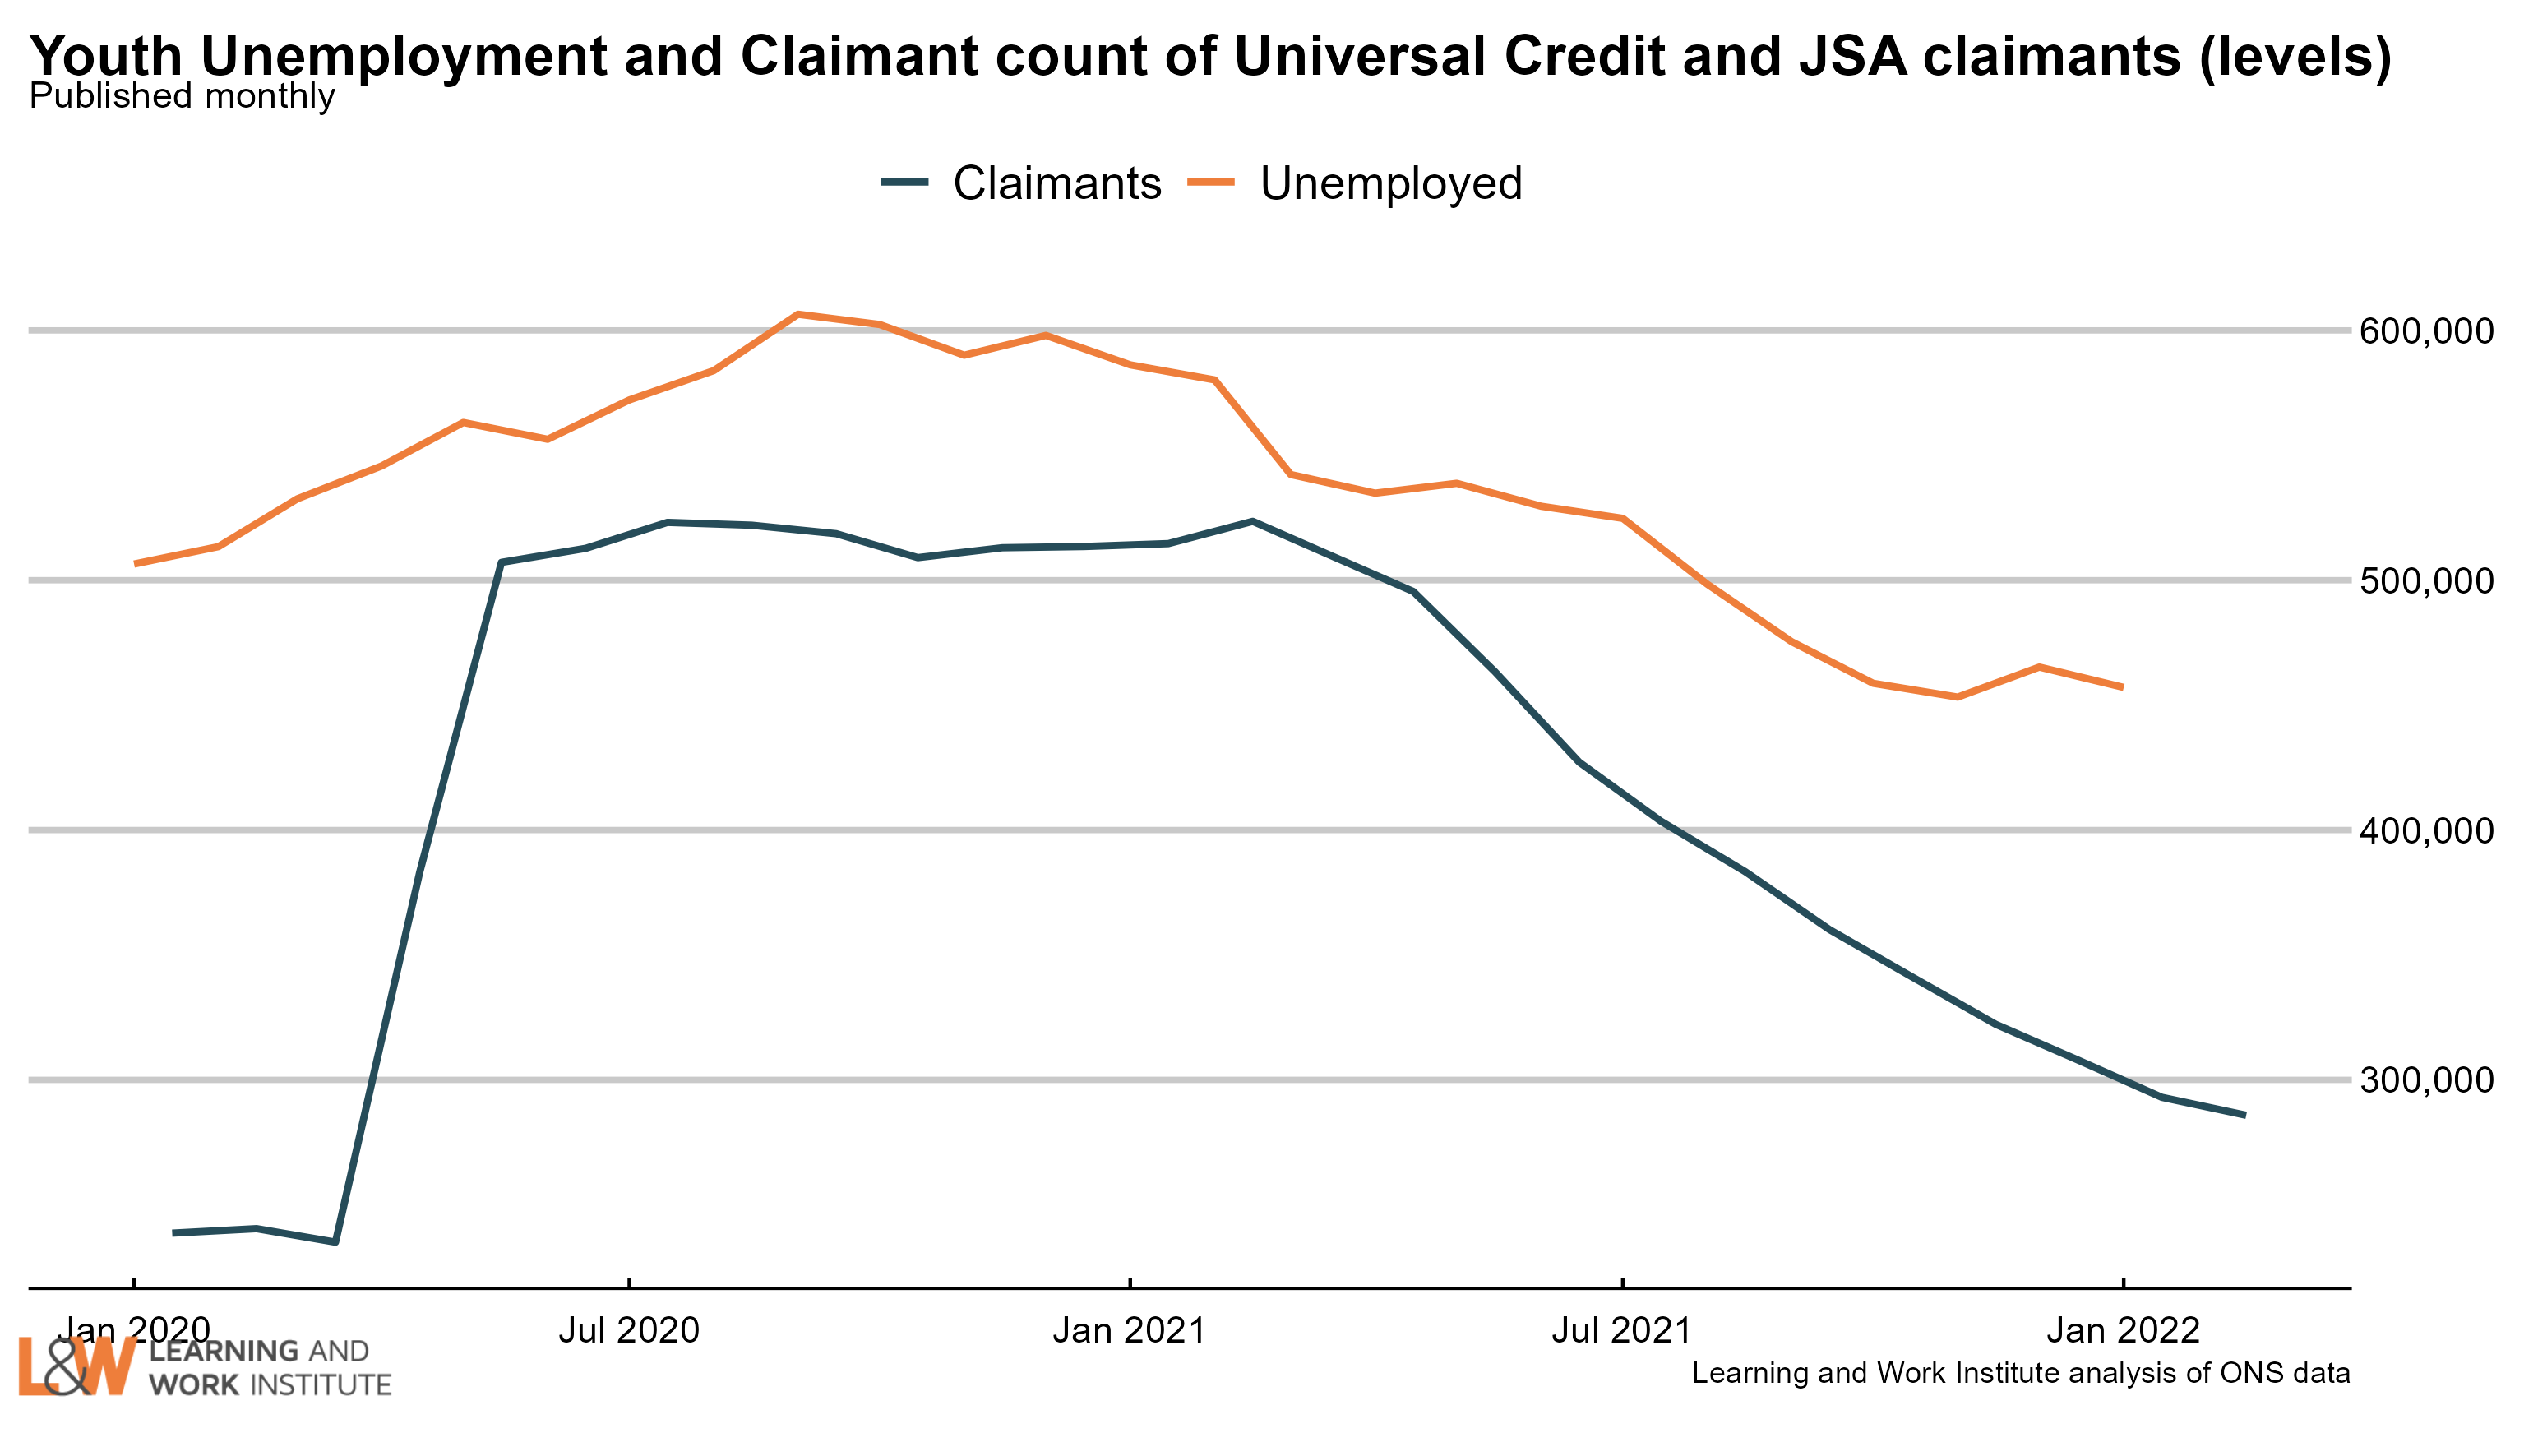 |
|
| Chart 4: Young people not in employment, full-time education or training The number of out of work young people who are not in full-time education (885,000) is down by 15,000 in the last quarter, or 1.7%. Two-thirds (67%) of young people not in full-time education or employment are economically inactive, rather than unemployed. 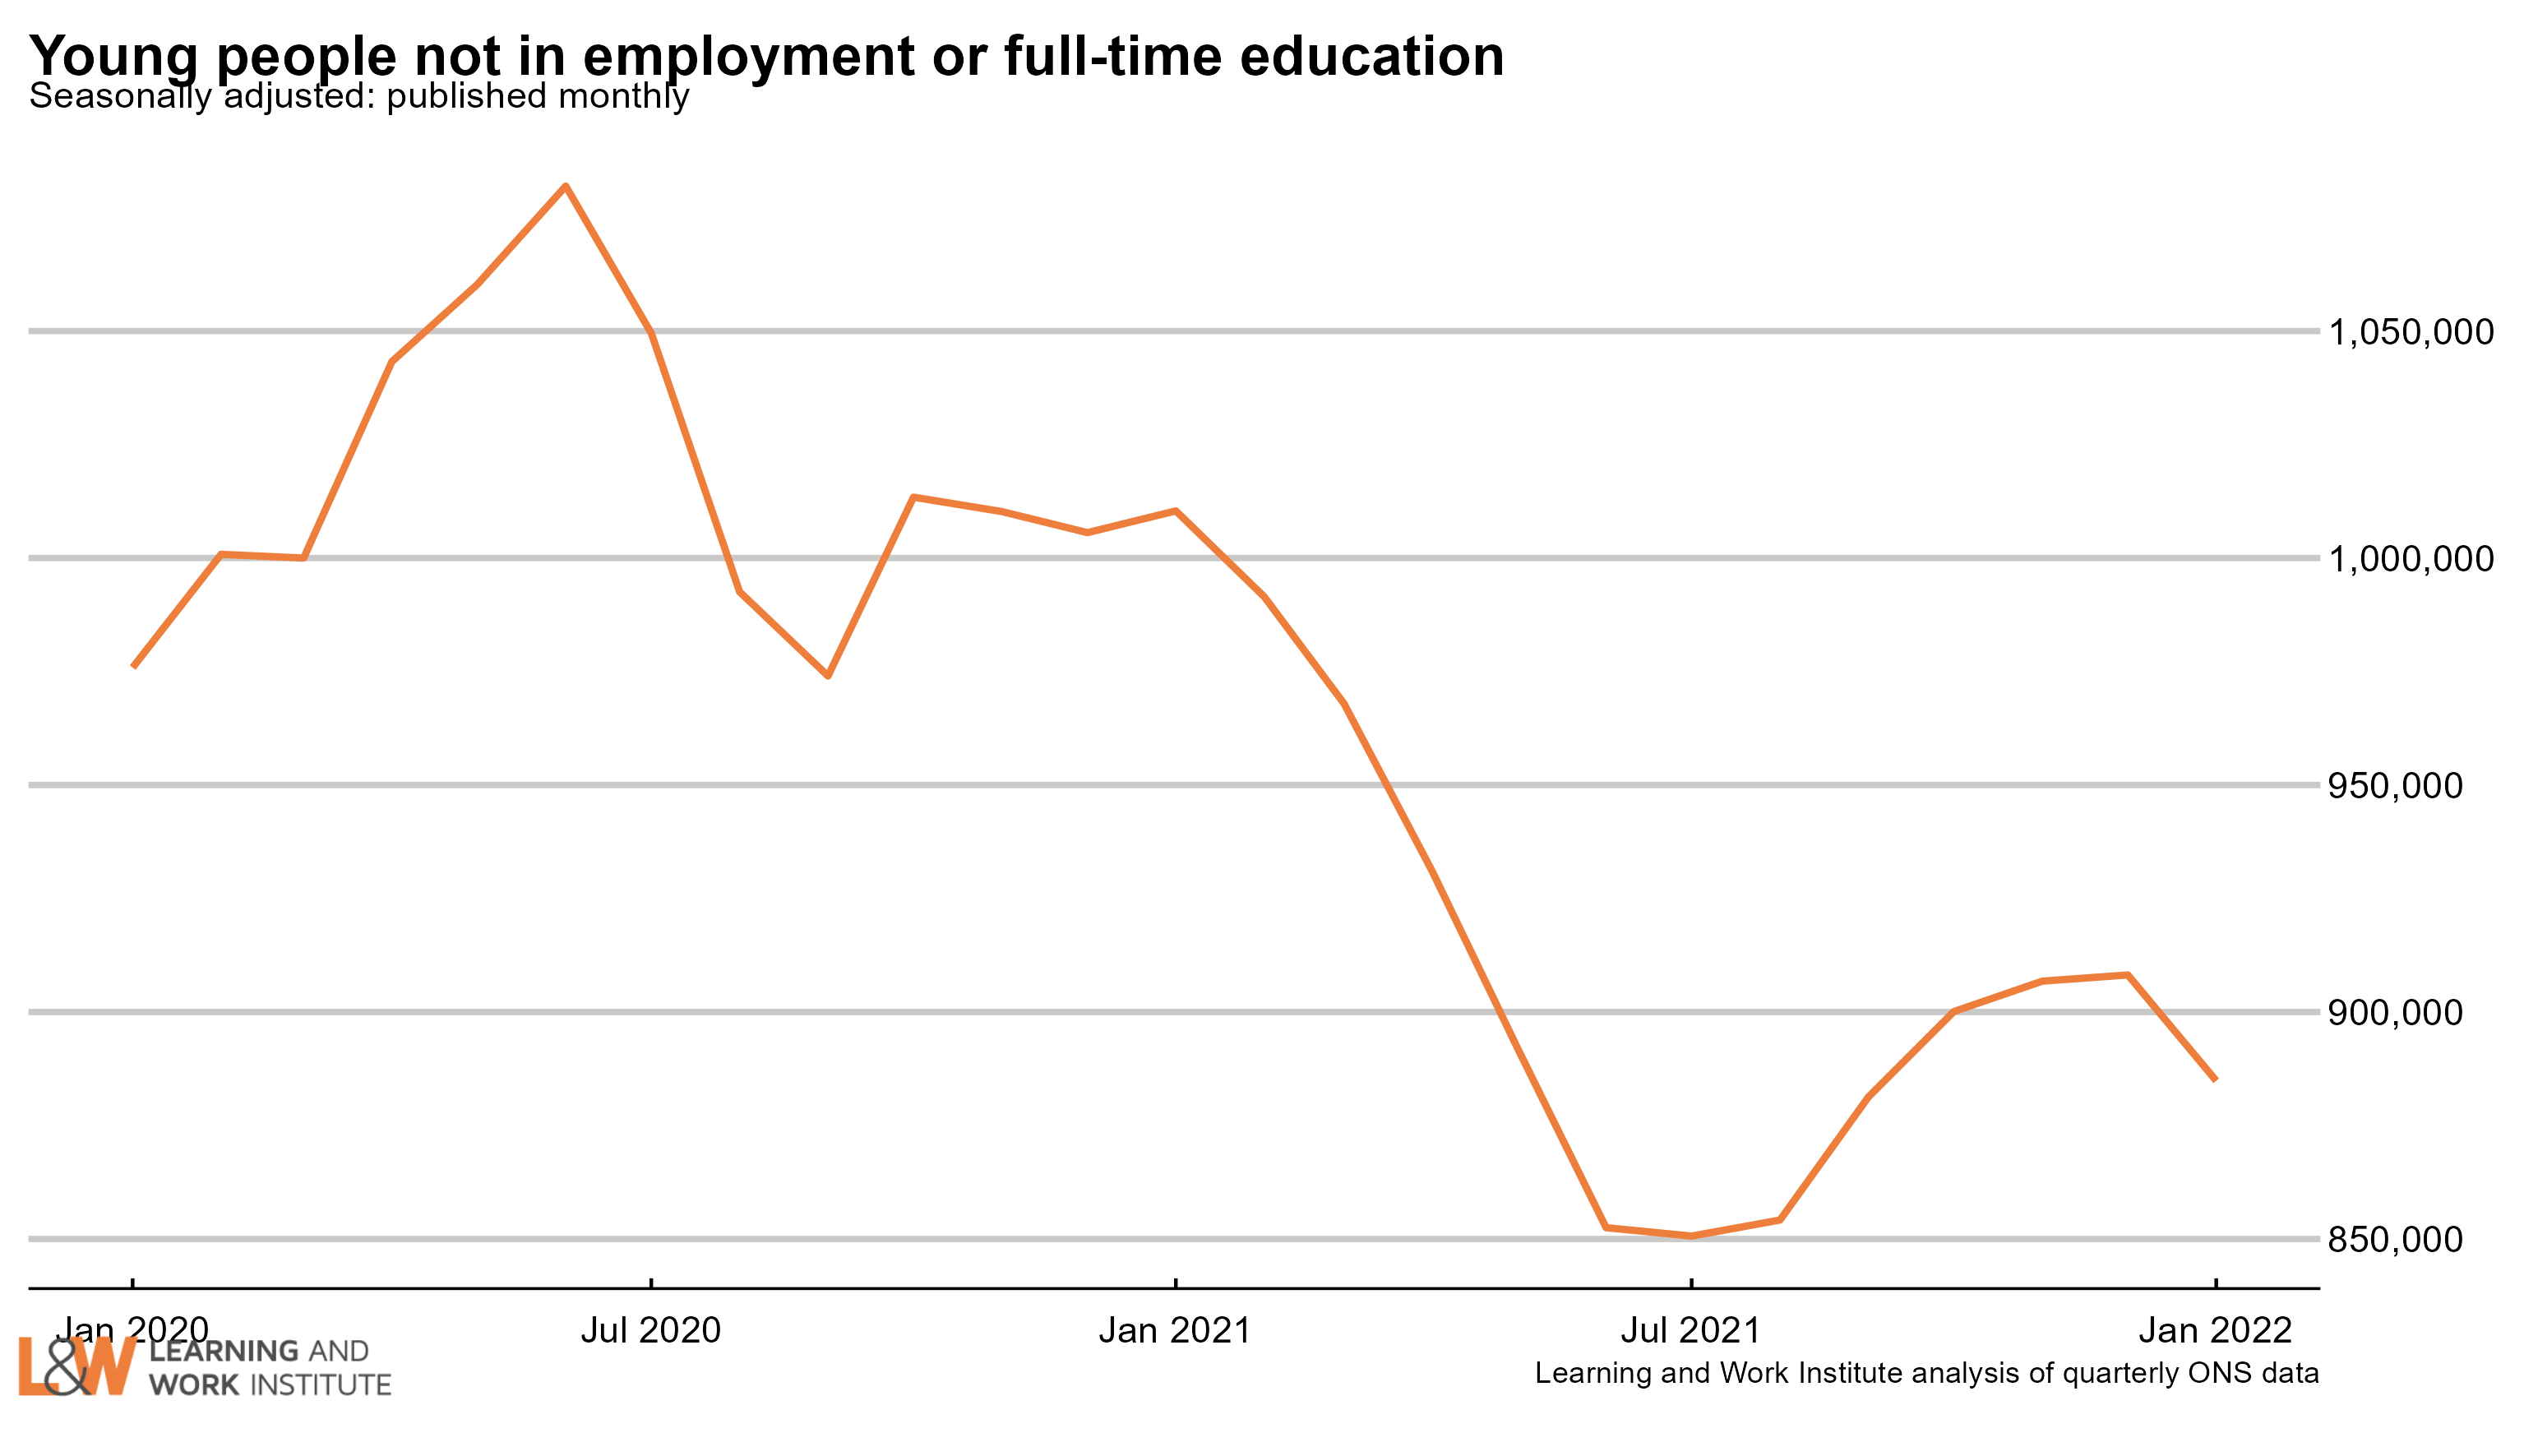 |
|
| Chart 5: Youth long-term unemployment (six months and over, 16-24) Youth long-term unemployment (which can include students) has fallen by 7,000 over the last quarter and is now 149,000. 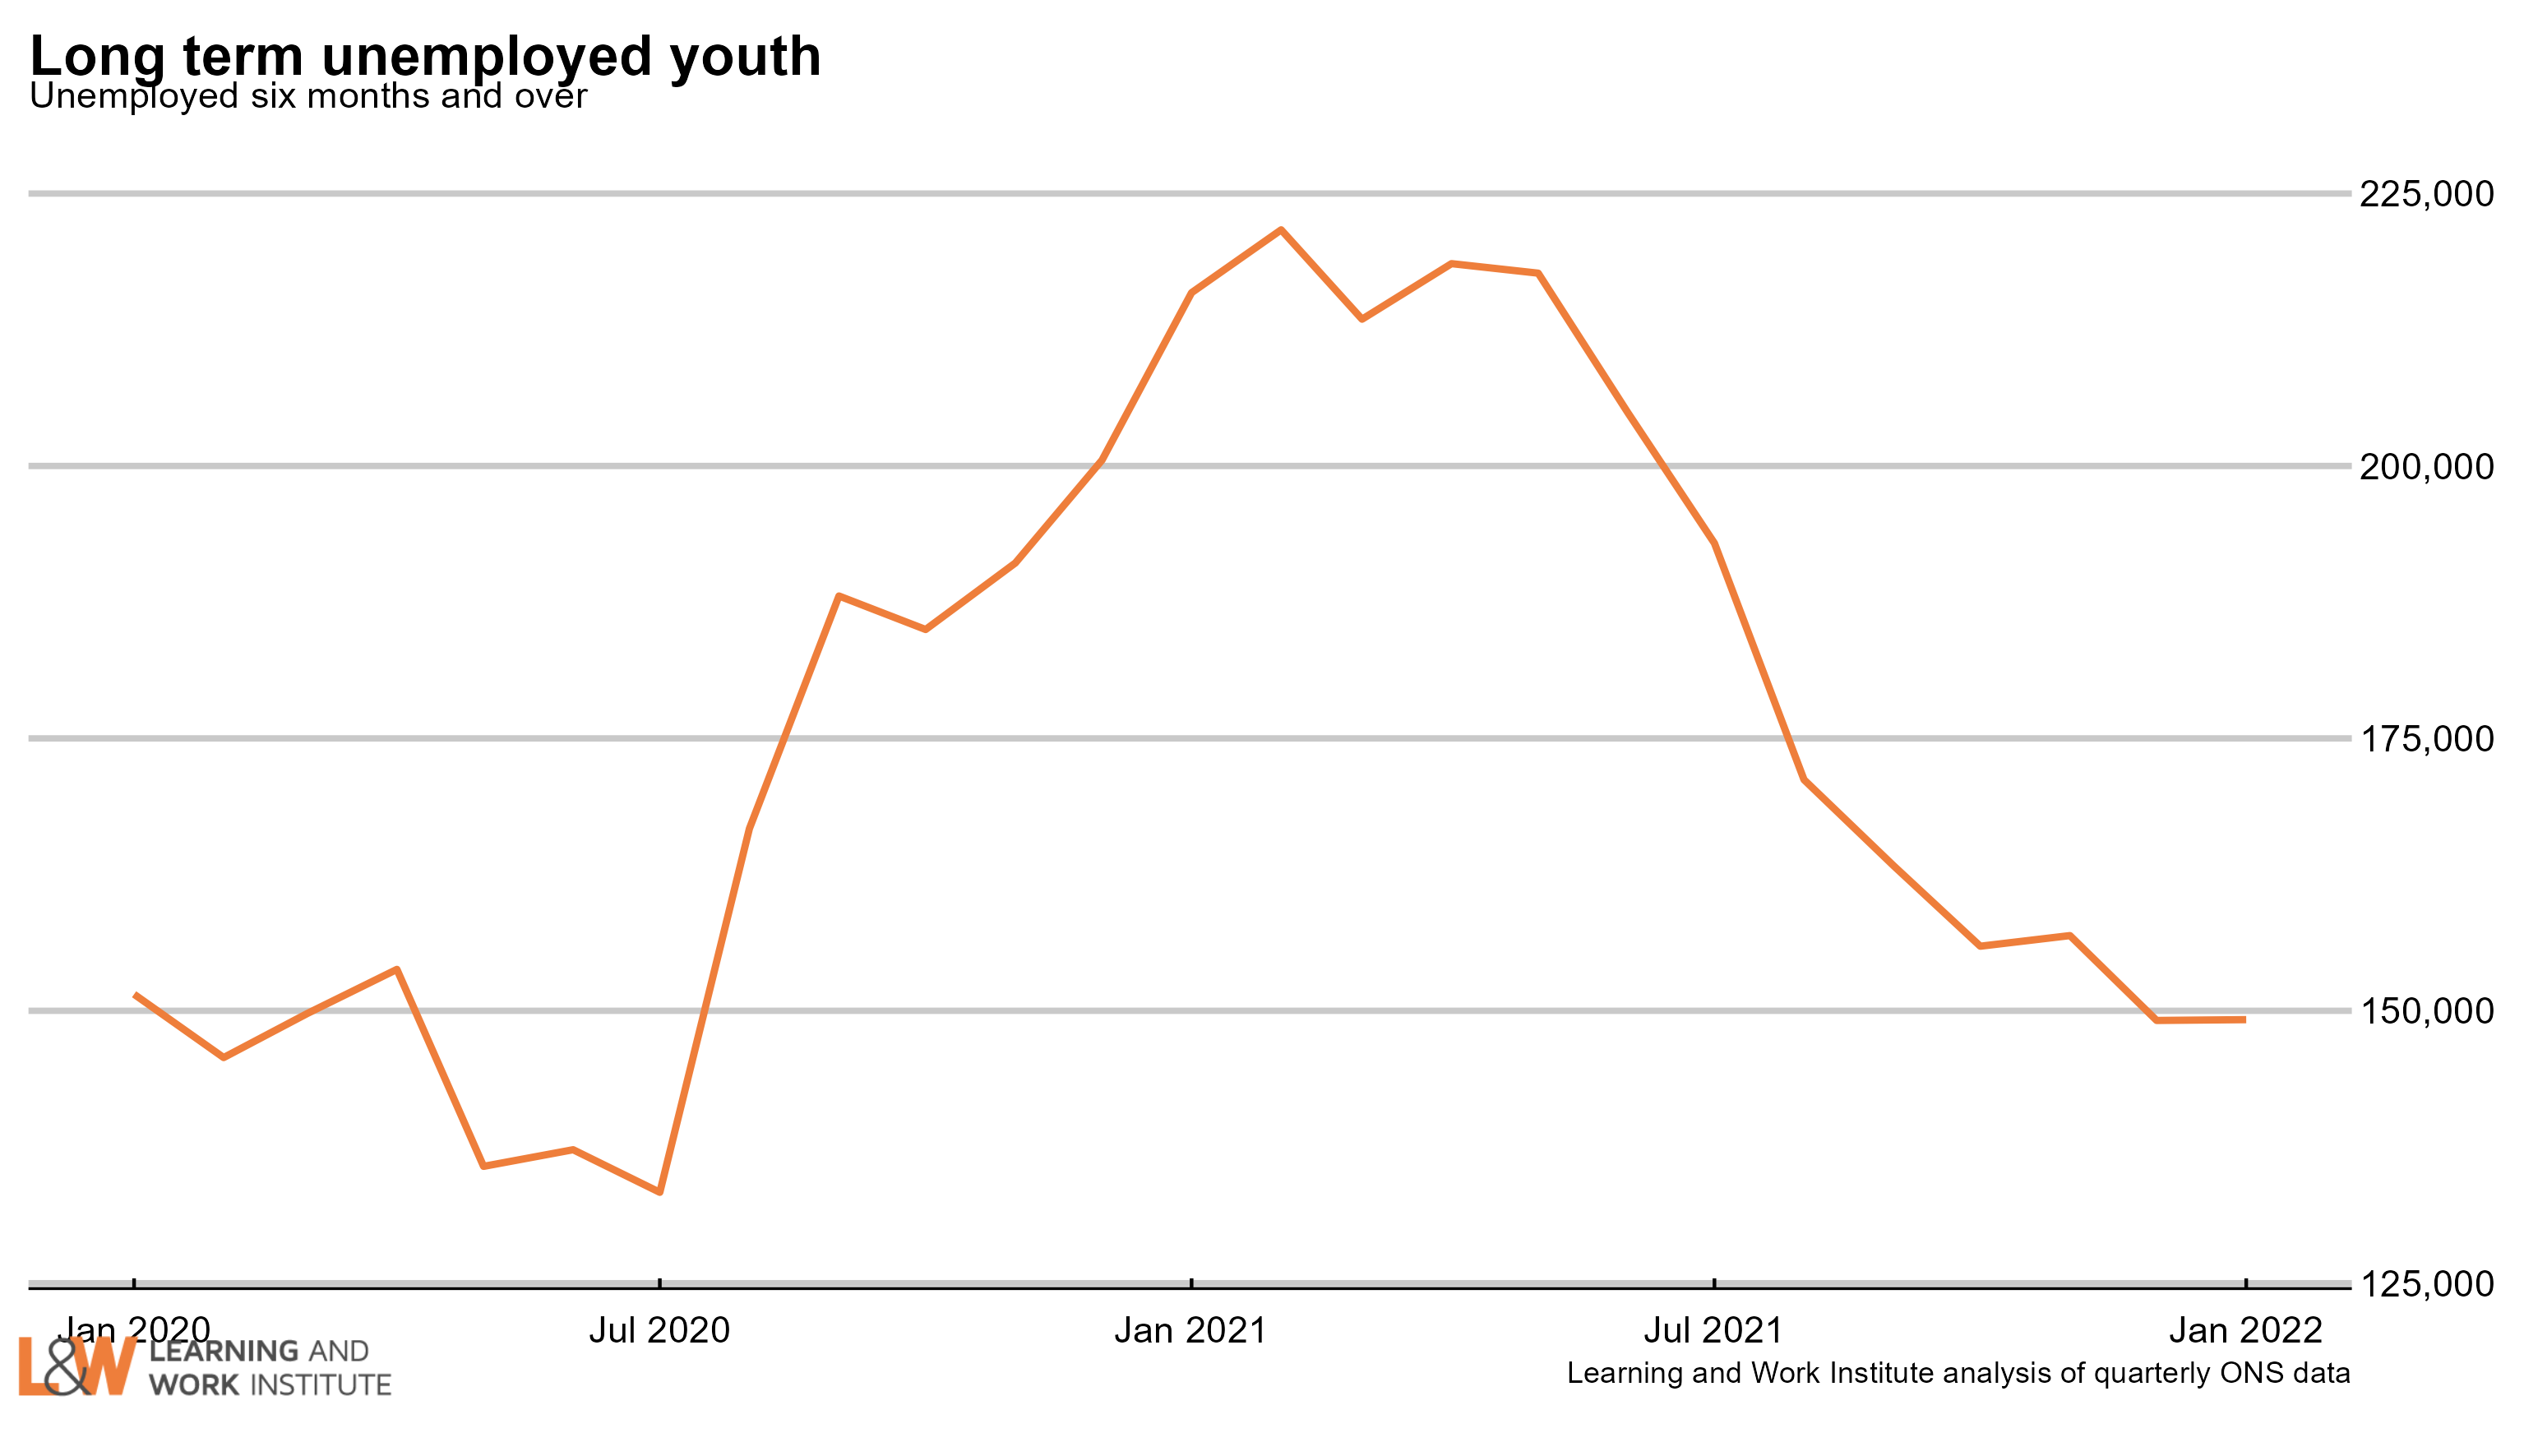 |
|
| Chart 6: Adult long-term unemployment (12 months and over, 25+) Adult long-term unemployment on the survey measure is now 317,000. There are 79,000 more people aged 25 and over out of work for 12 months or more than before the pandemic (Dec 19-Feb 20), though this is now falling (either due to people finding work or moving into economic inactivity). 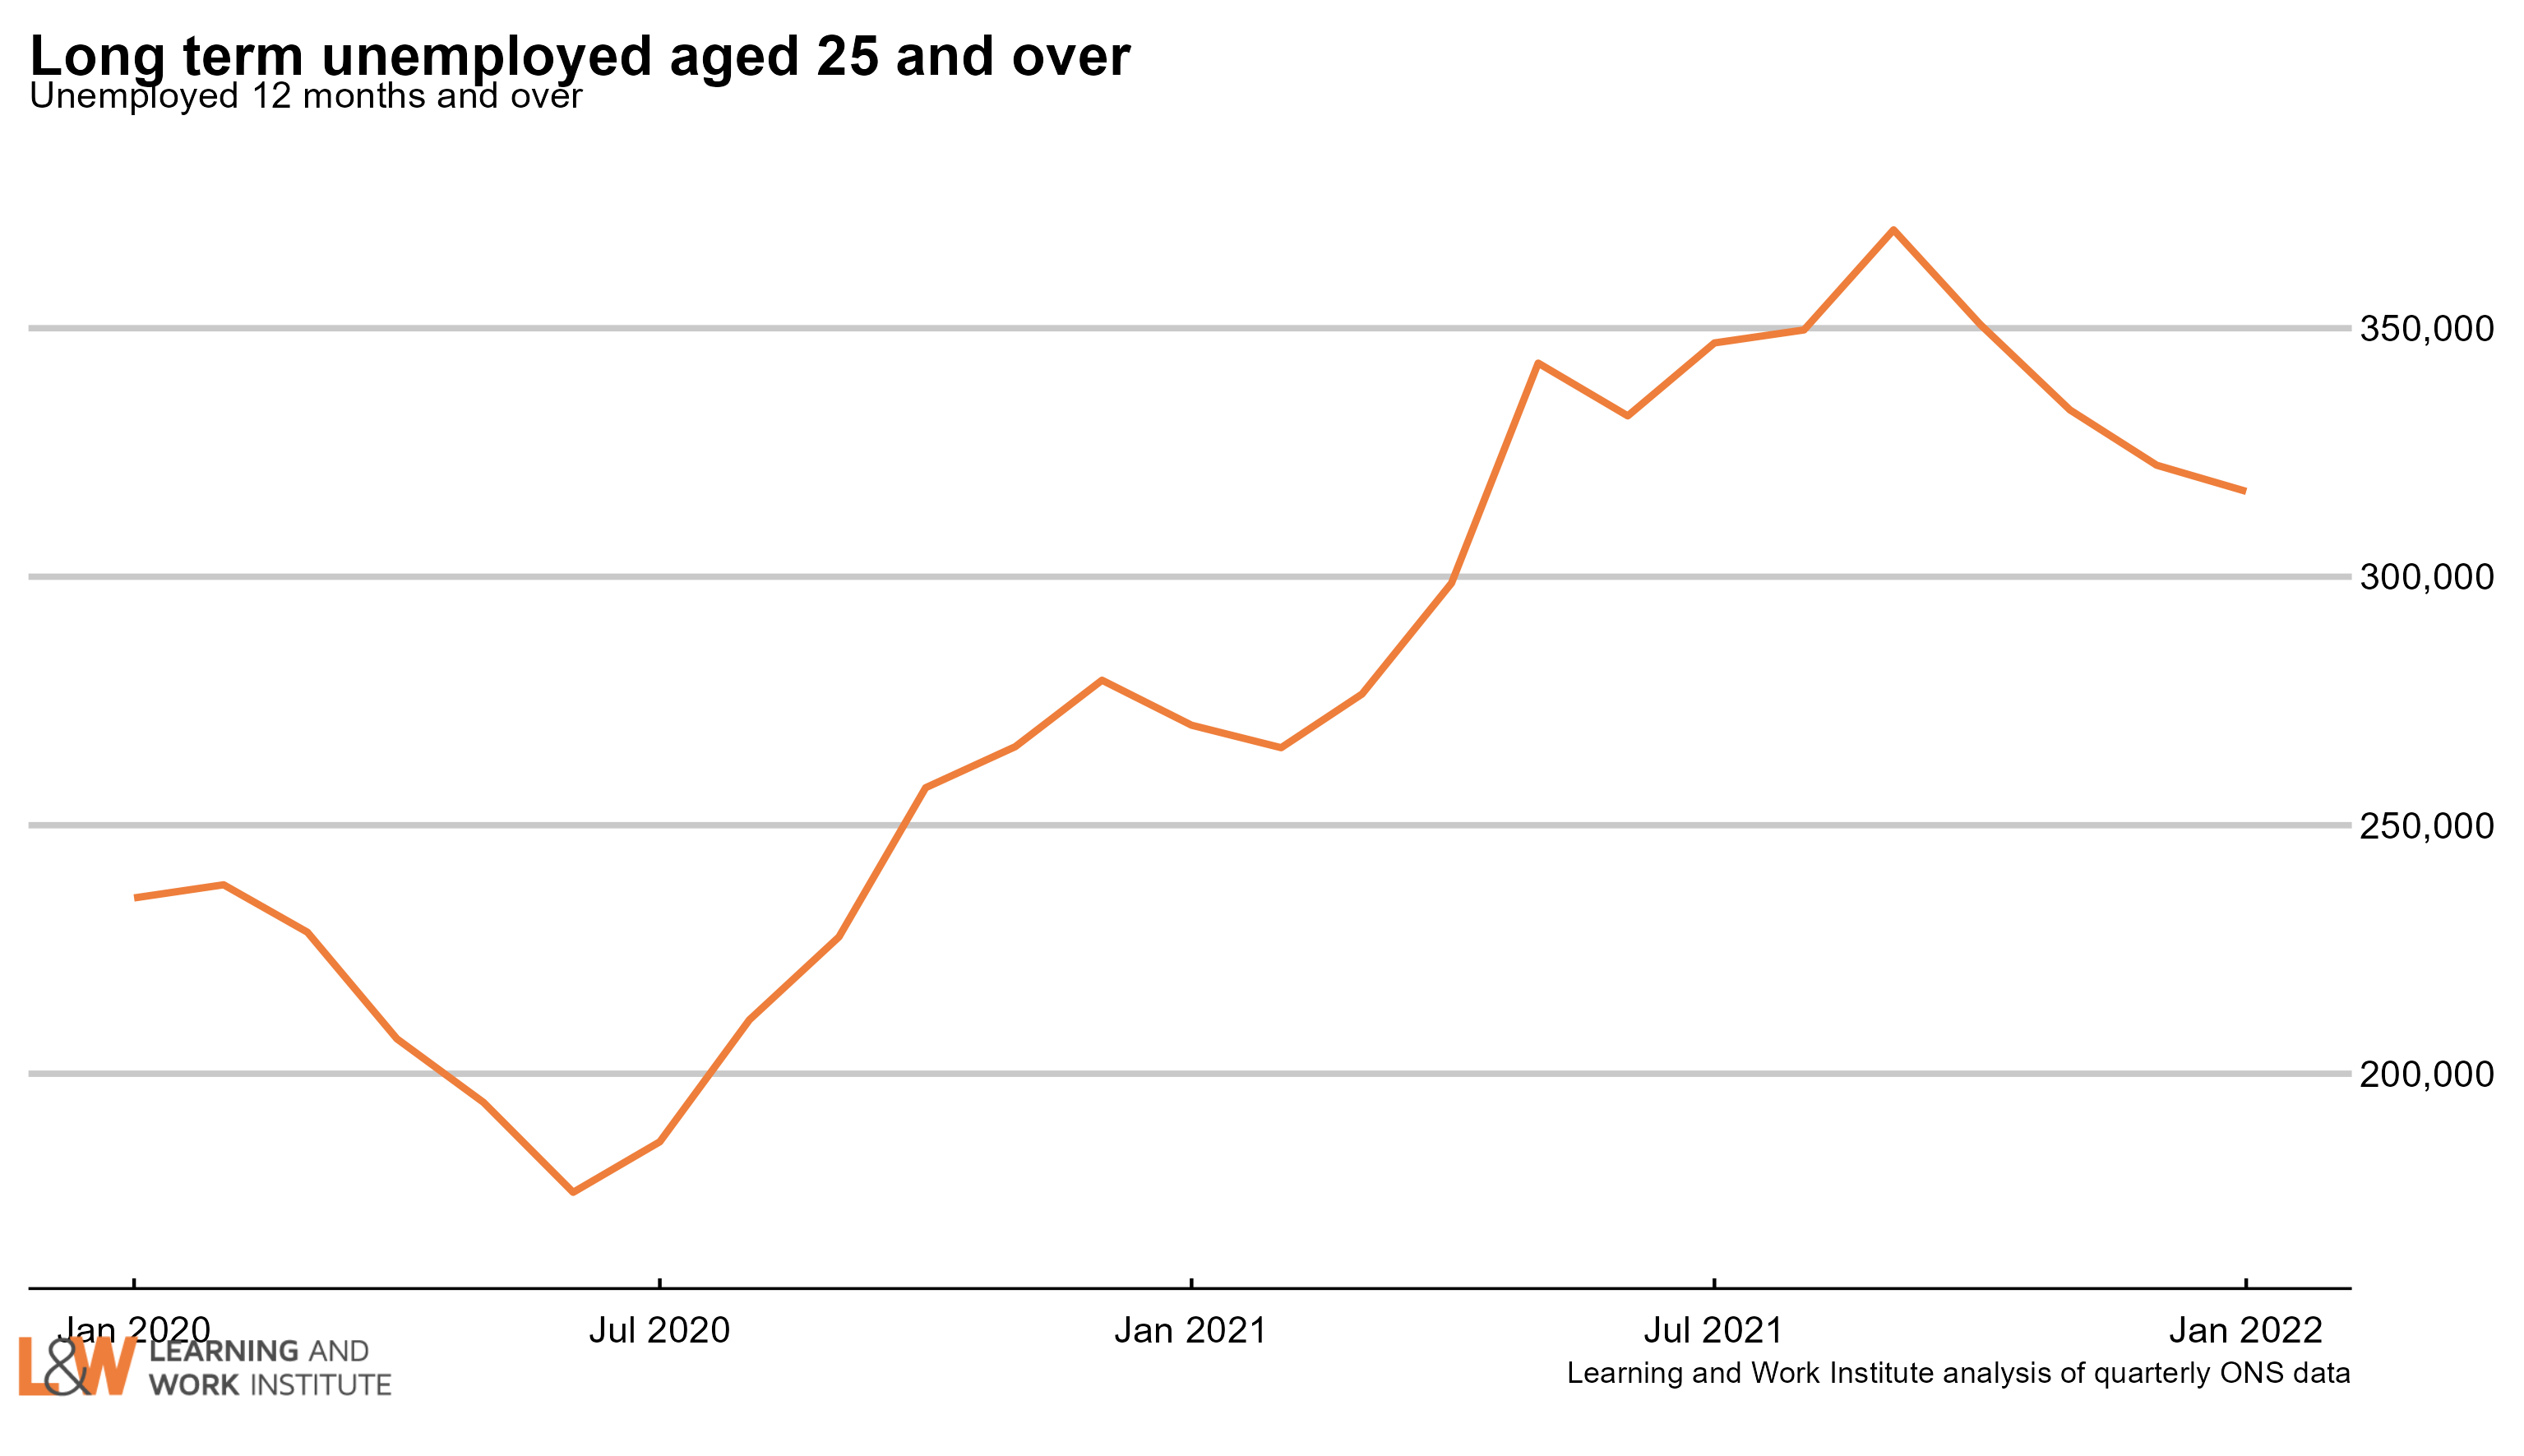 |
|
| Chart 7: Unemployment rates by age The 18 to 24 year old unemployment rate (including students) is 9.7% of the economically active –. The unemployment rate is defined as unemployed as a percentage of the sum of the employed and the unemployed, not counting anyone economically inactive. This excludes over one million economically inactive students from the calculation. The rate for those aged 25 to 49 is 3.0%. For those aged 50 and over it is 2.8%. The quarterly change is down 0.3 percentage points for 18 to 24 year olds, down 0.2 points for 25 to 49 year olds, and down 0.5 points for the over-50s. 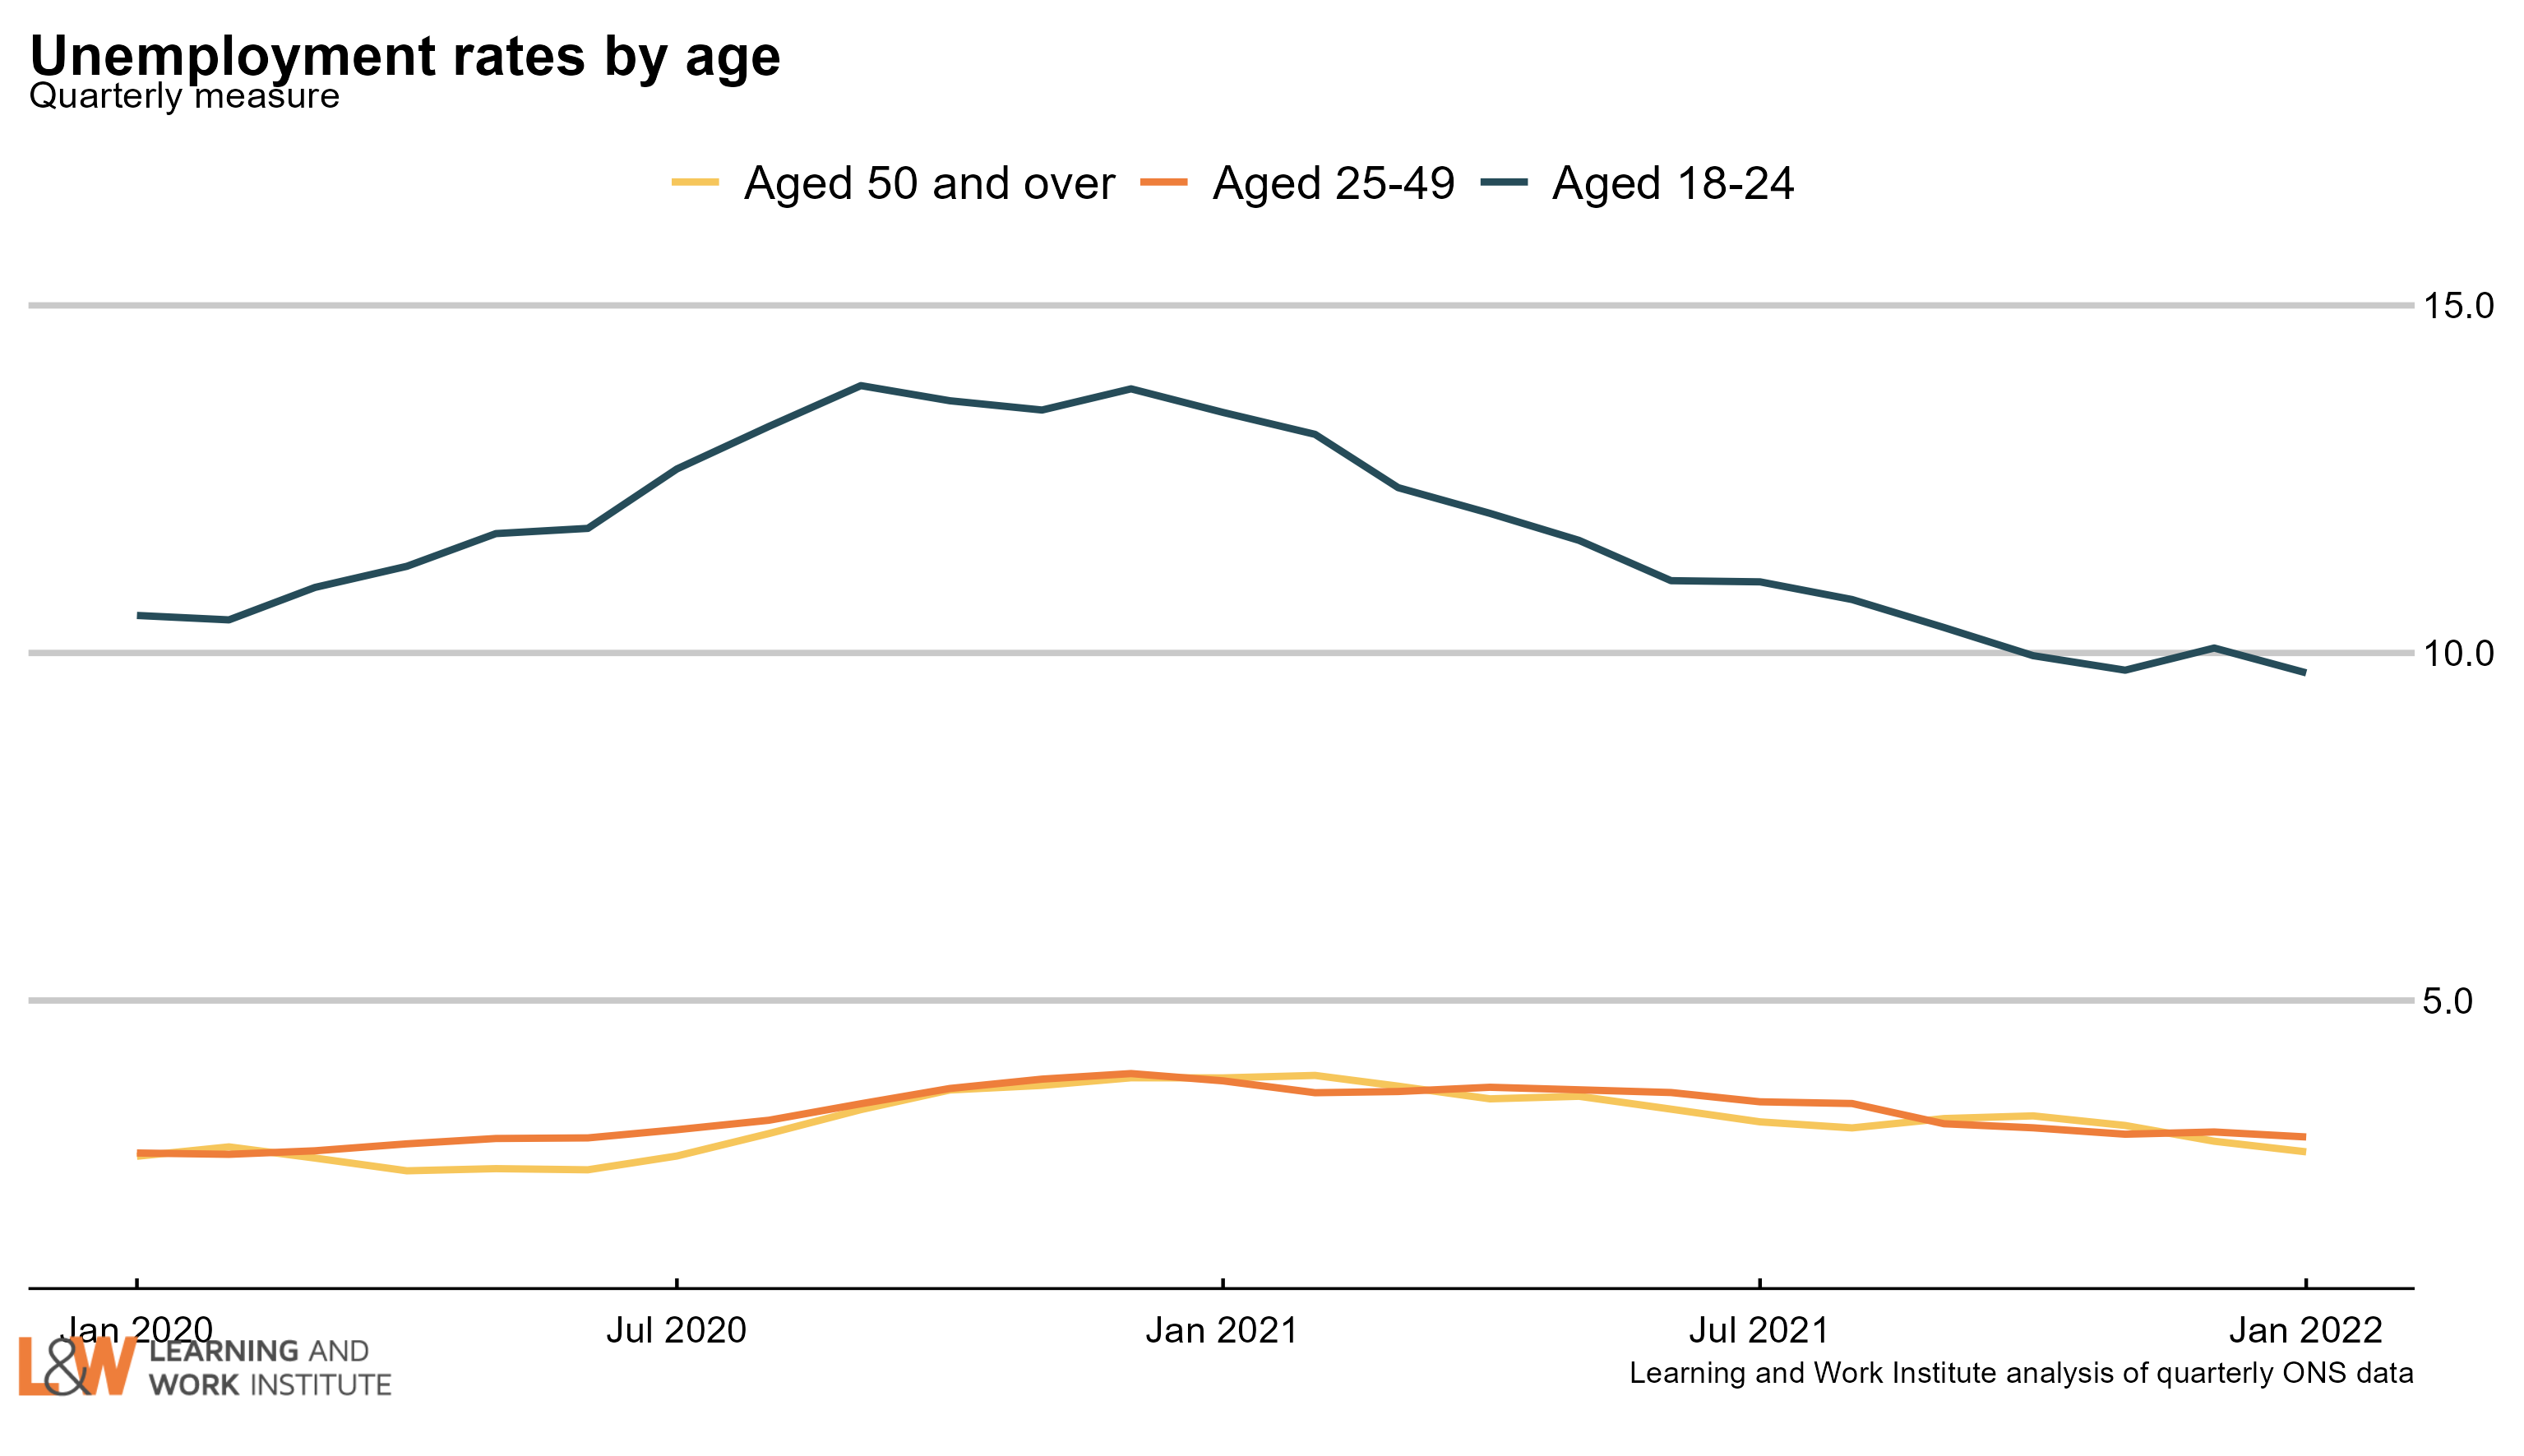 |
|
| Chart 8: Unemployment rate changes by age (counting February 2020 as 100) The 18 to 24 year old unemployment rate (including students) is down 0.8 percentage points on February 2020. The change for those aged 25 to 34 is up 0.3 points. The change for those aged 35 to 49 is up 0.2 points. The change for those aged 50 to 64 is down 0.1 points. The change for those aged over 65 is down 0.1 points. 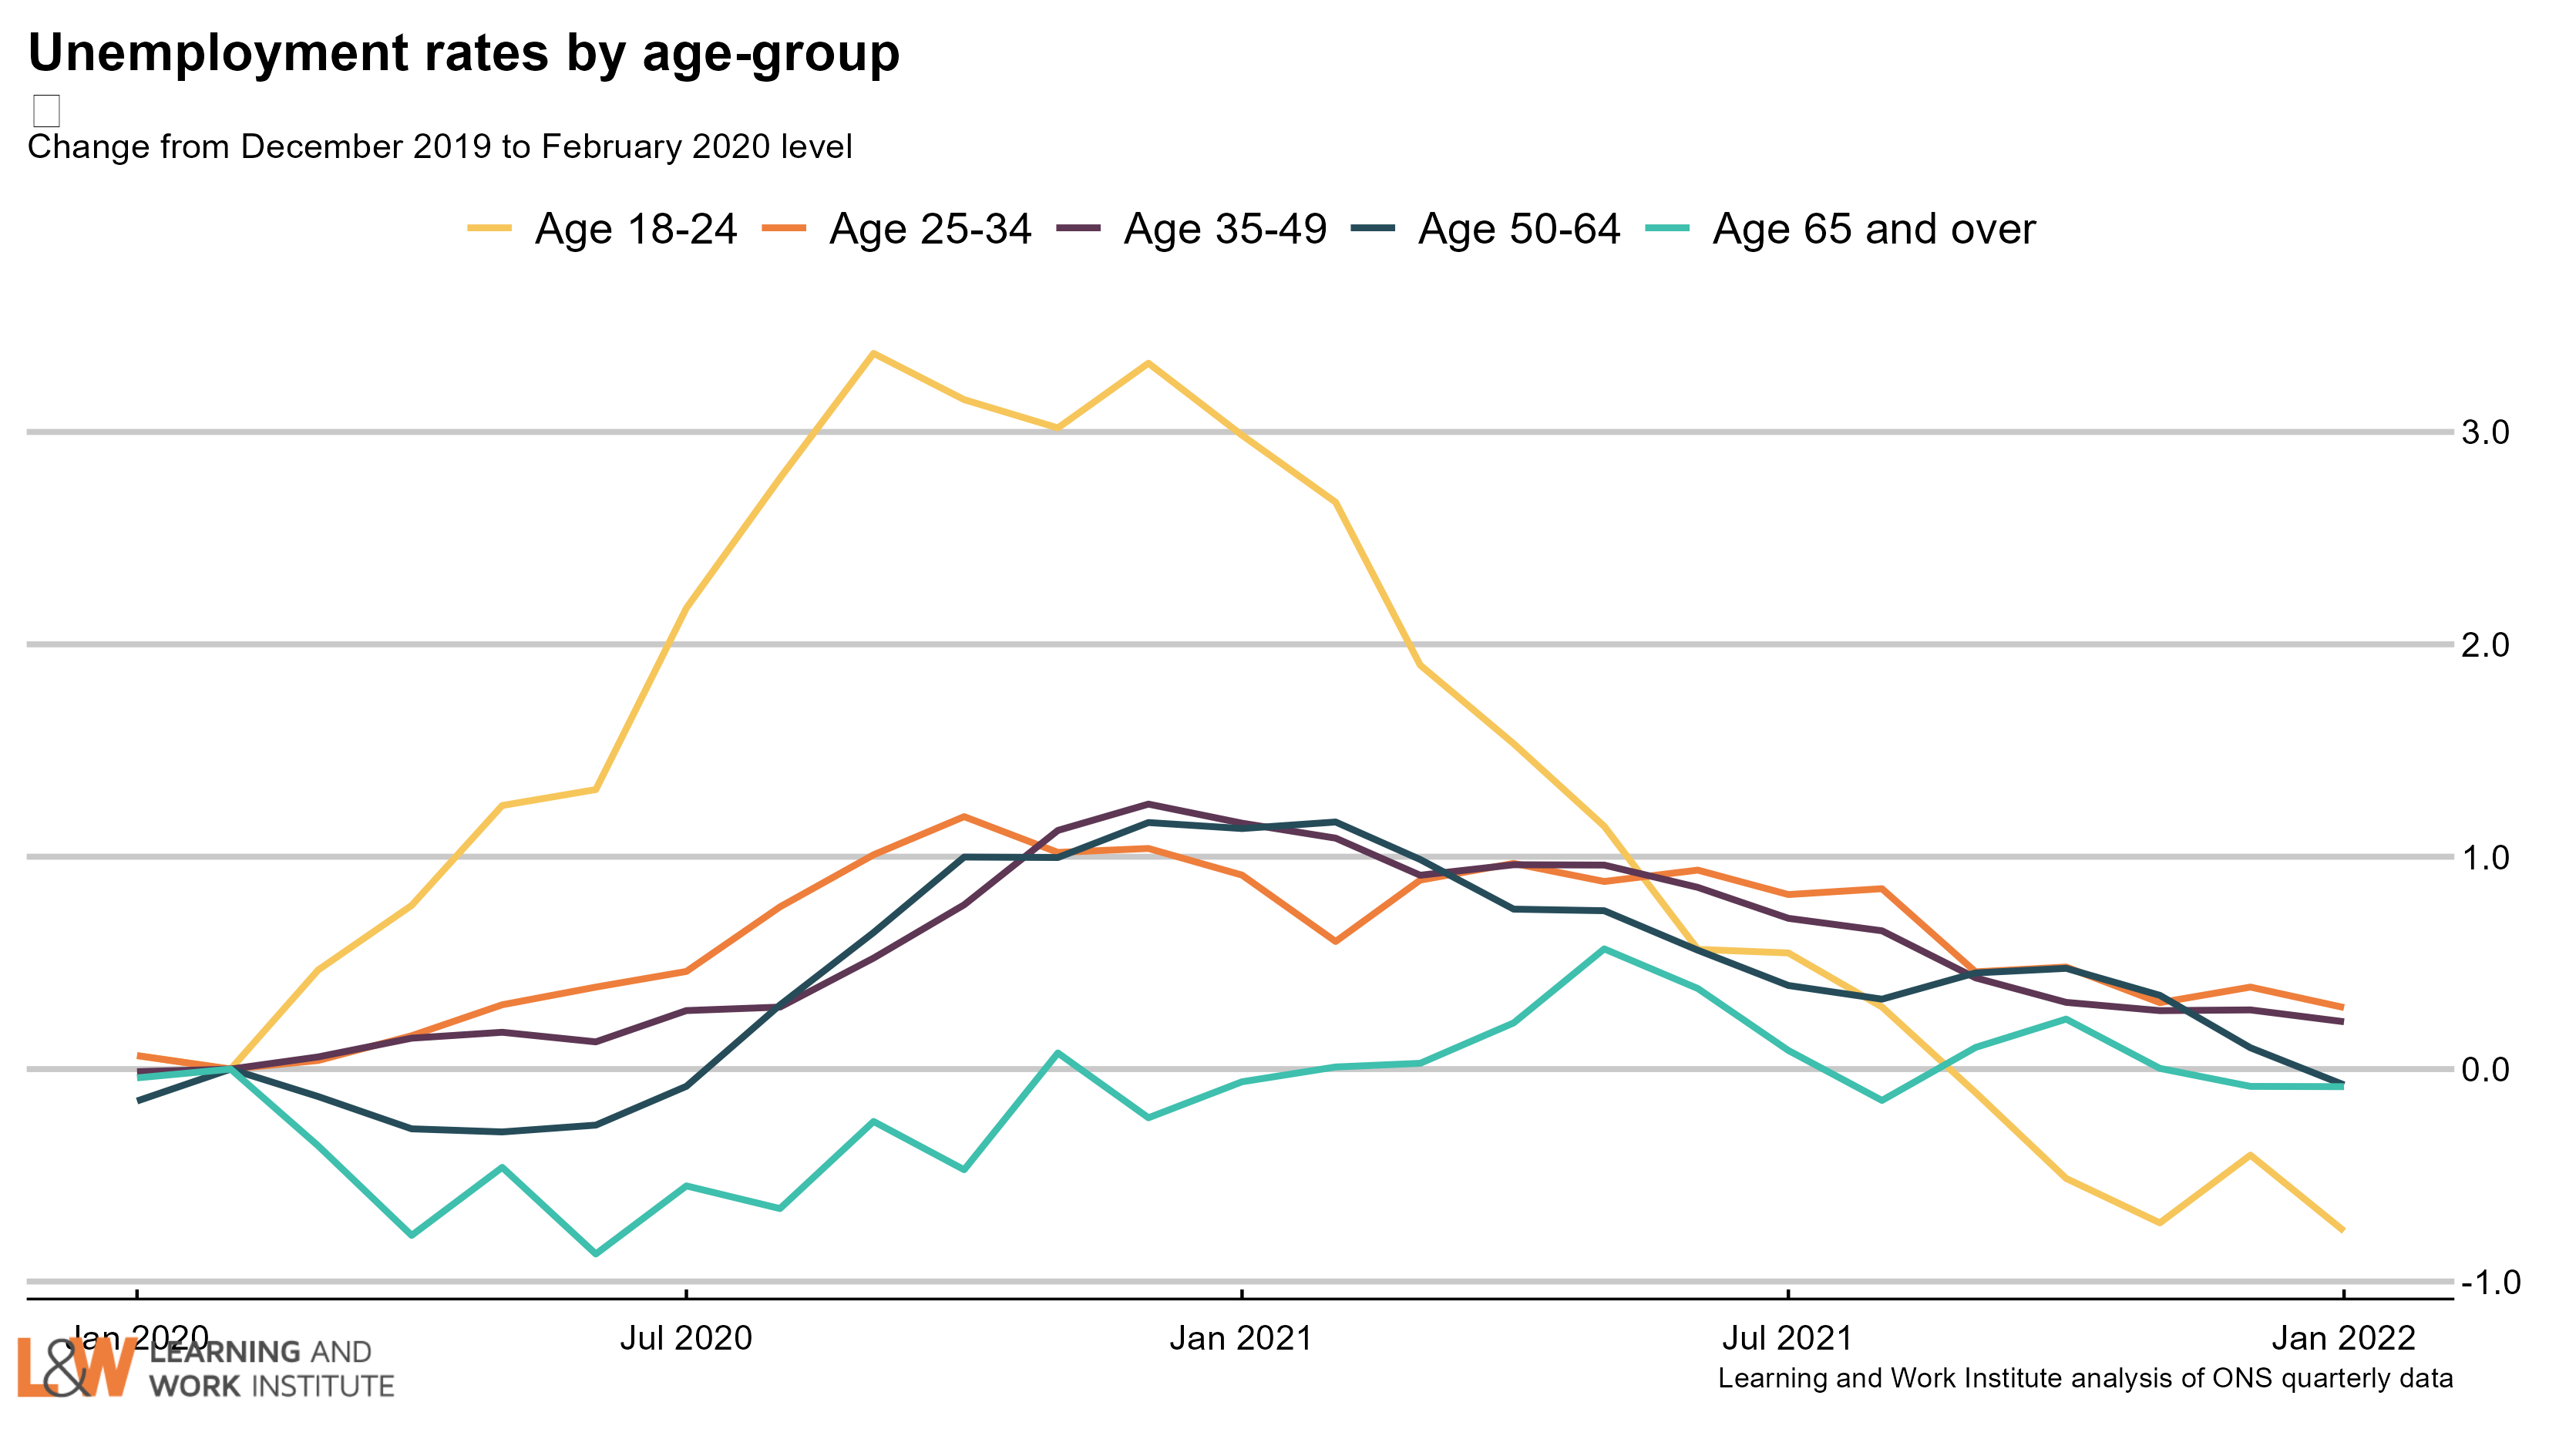 Chart 9: Vacancies – whole economy survey Headline vacancies this month increased by 23,000 to 1,318,000. The ONS' experimental single-month vacancy figures has risen by 48,000 In the last quarter. The headline ONS vacancy figure is both seasonally adjusted and a three-month average. The chart shows both series. 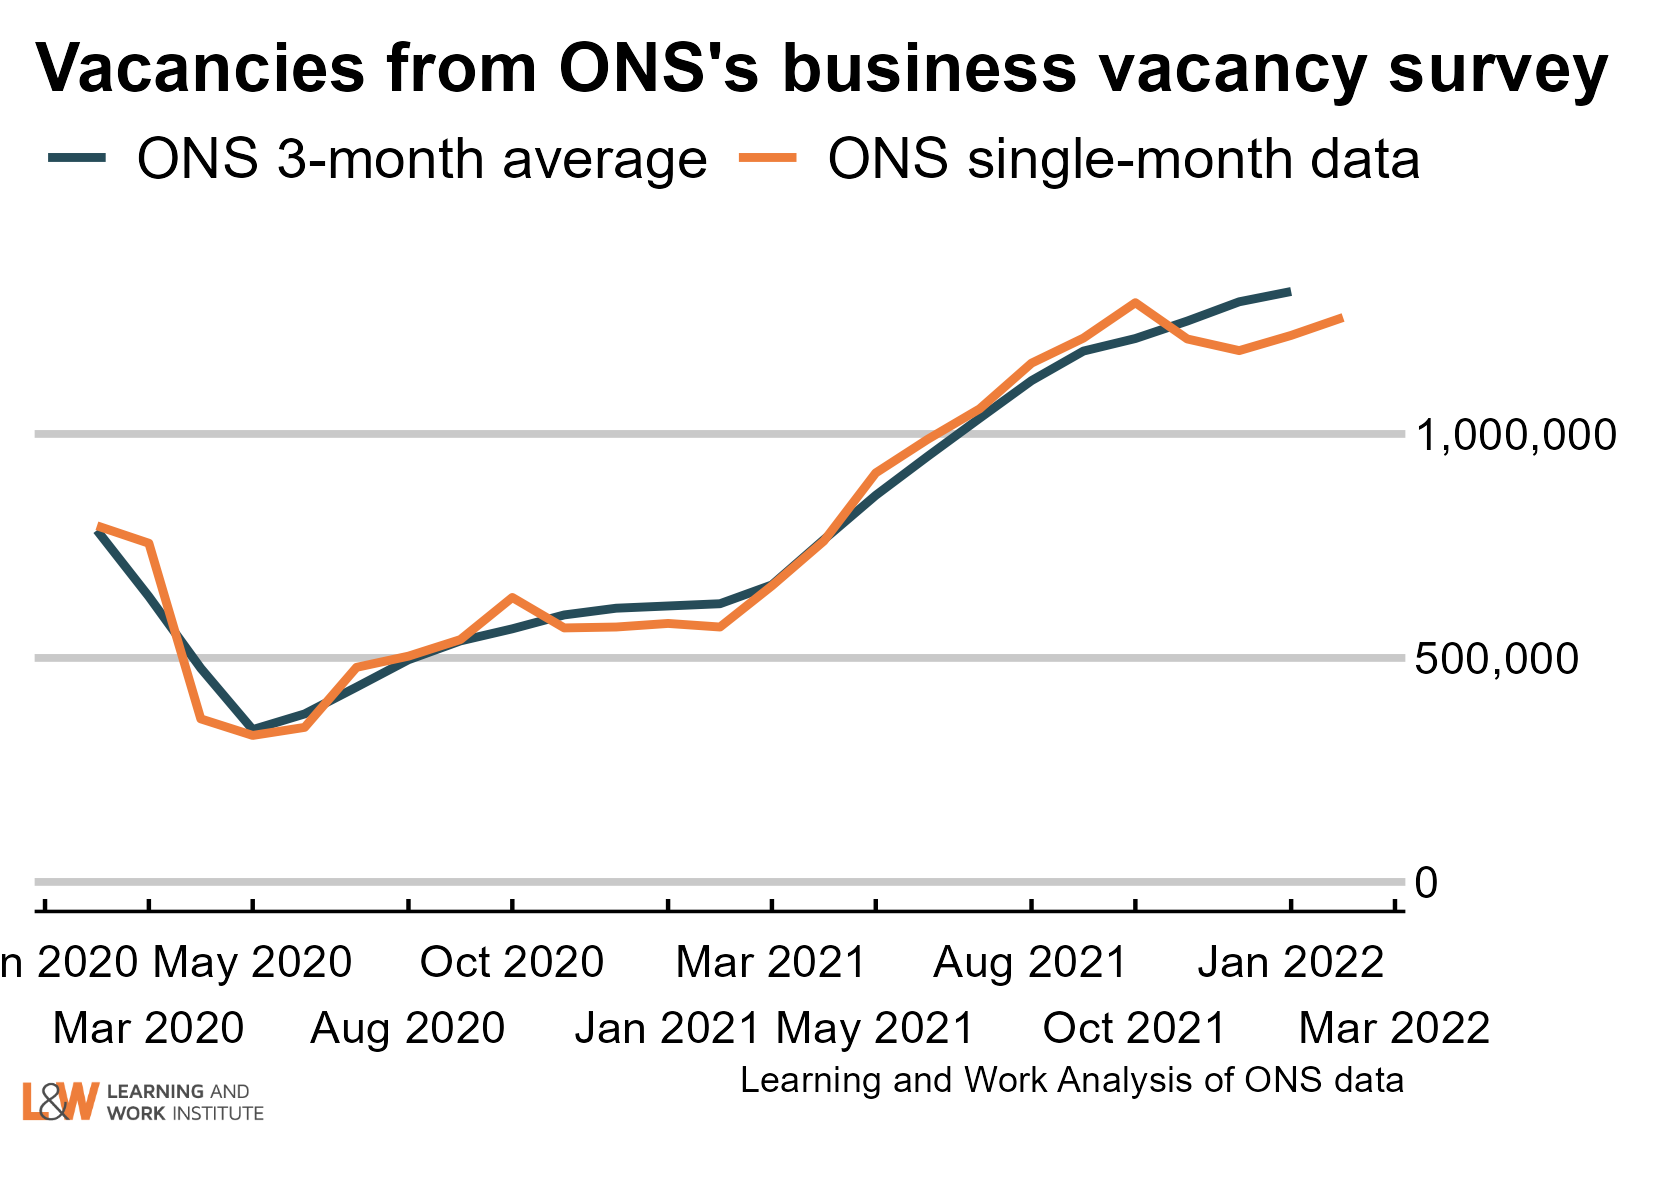 |
|
| Chart 10: Experimental single month vacancies – whole economy survey The ONS experimental single month vacancy estimates include sectoral information. The numbers are thousands of vacancies, under each orange and blue dot, and on the right, the two-year change in thousands of vacancies. The comparison period is February 2020, immediately before the pandemic. 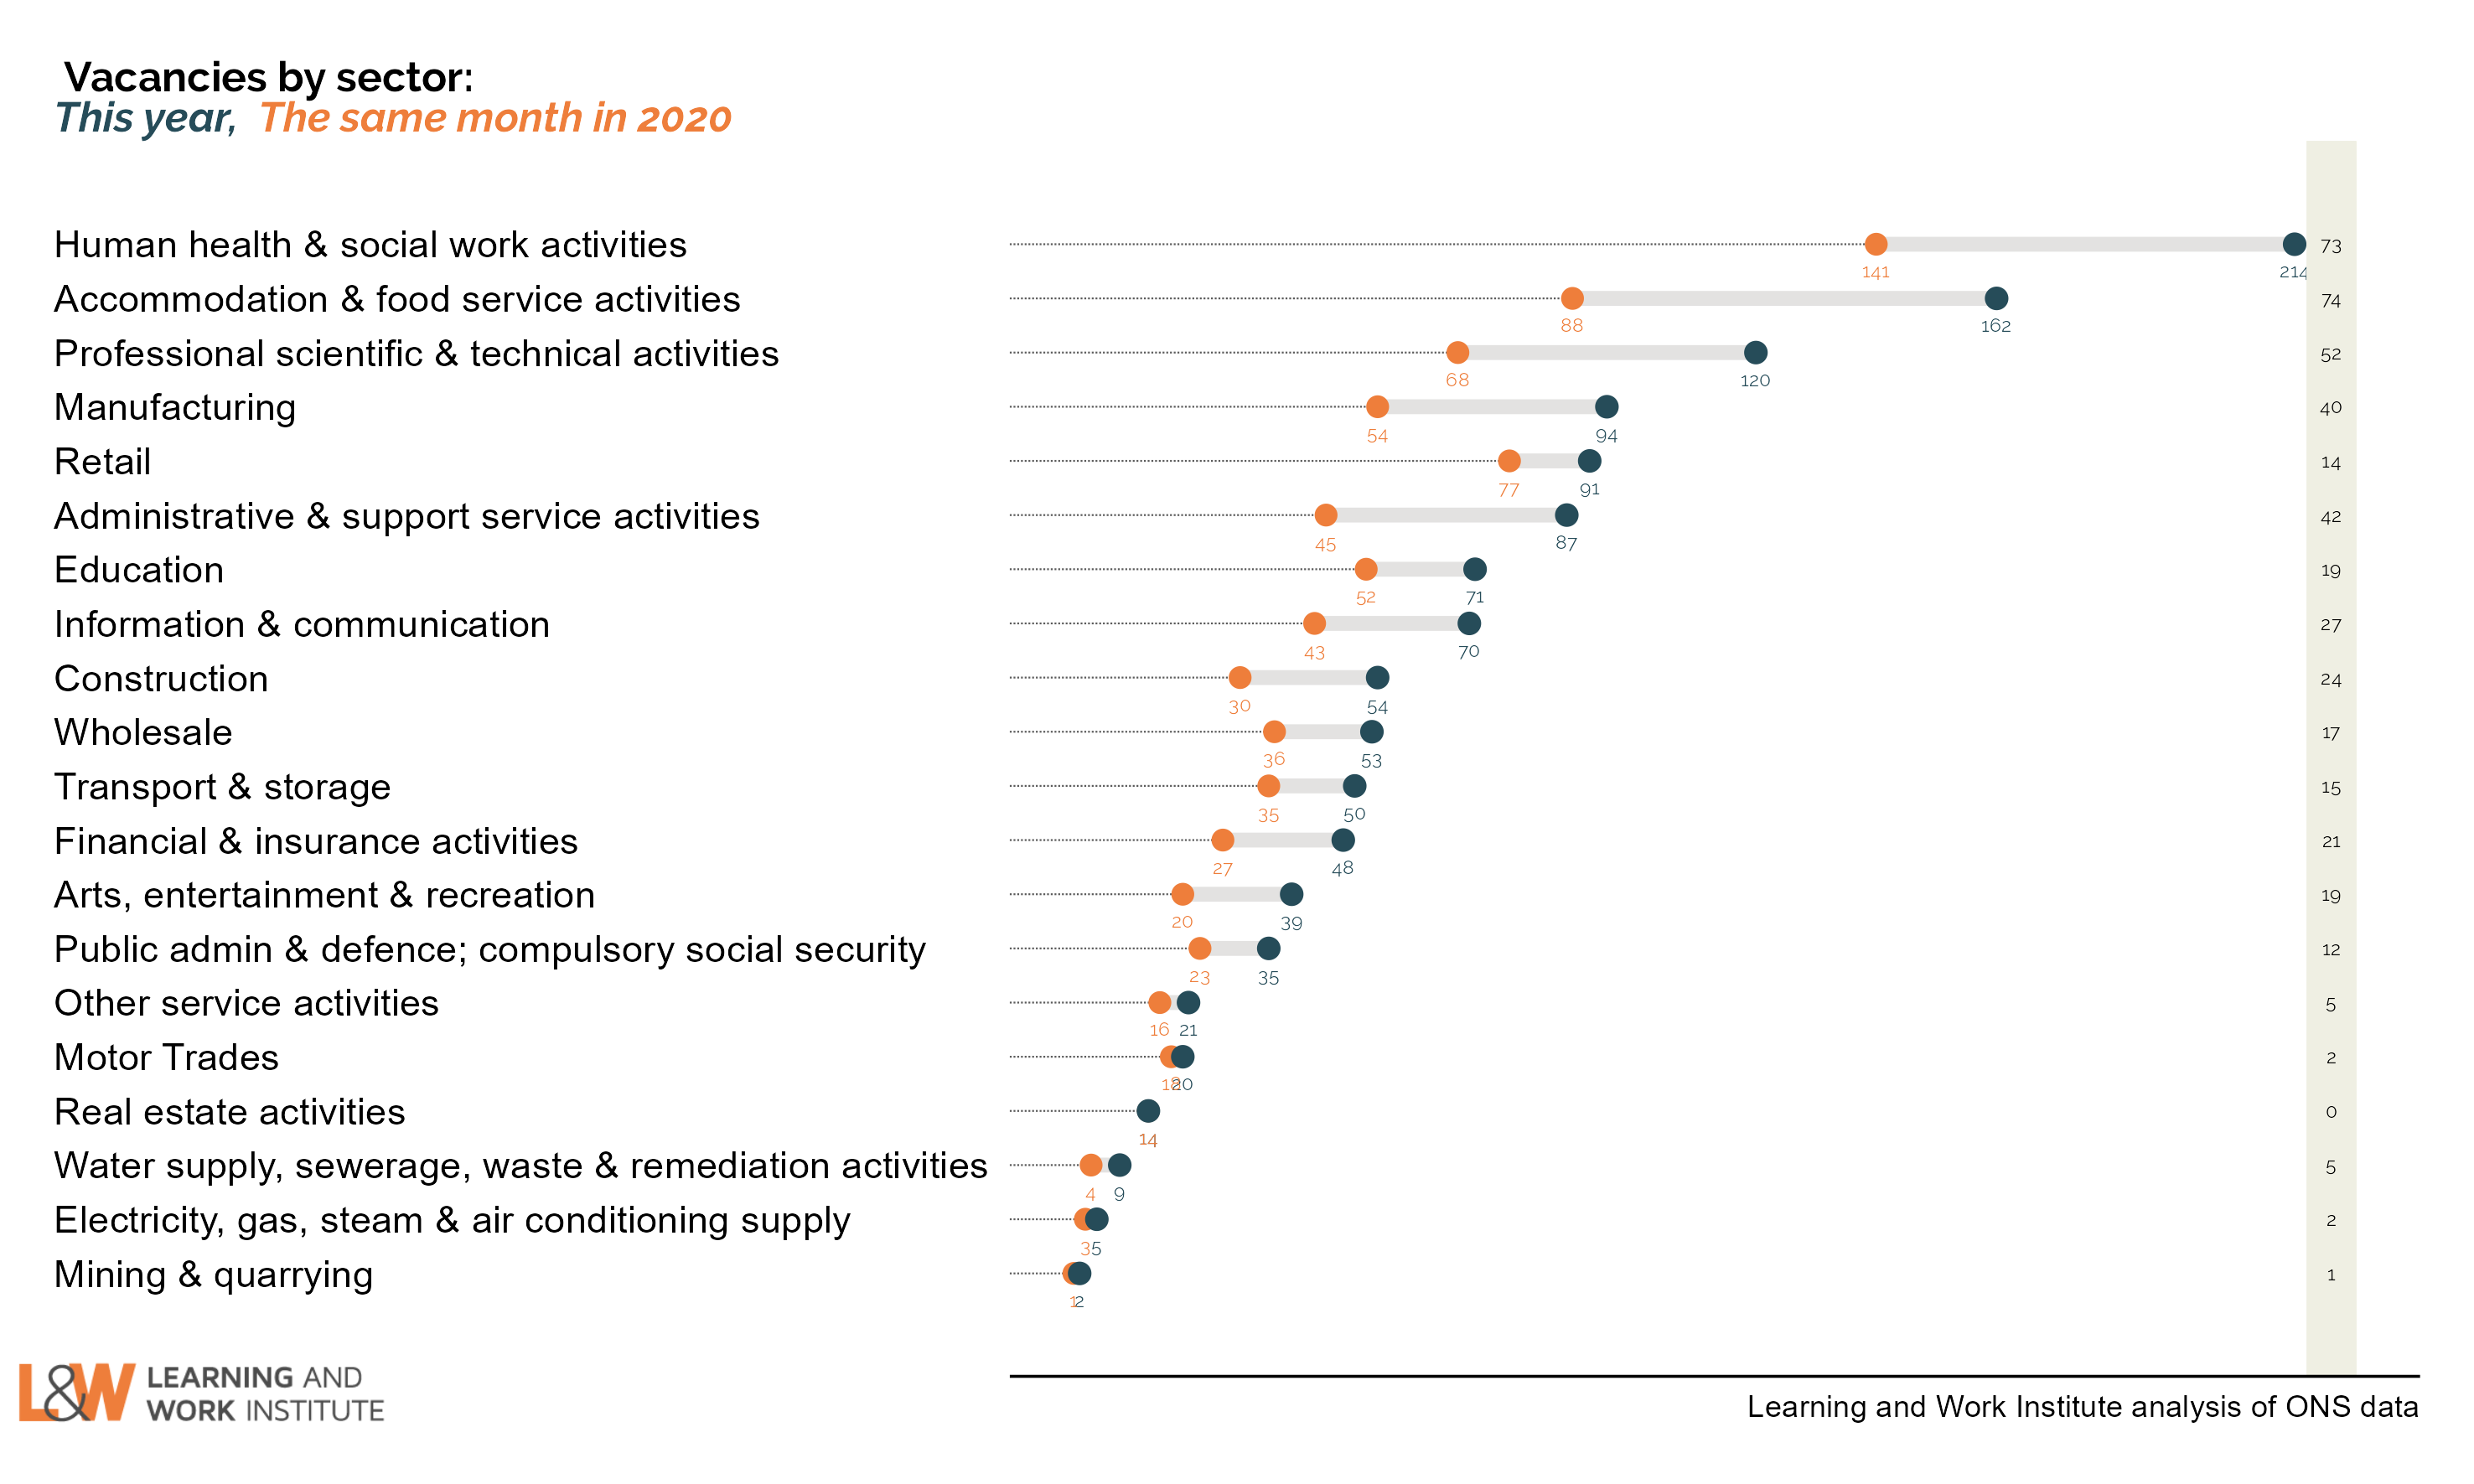 |
|
| Chart 11: Unemployed people per vacancy There are 1.0 unemployed people per vacancy. This is the lowest number on record, and is likely to fall below 1 next month as the vacancies figure (later than included in this measure) reached a new record and unemployment is still trending down. 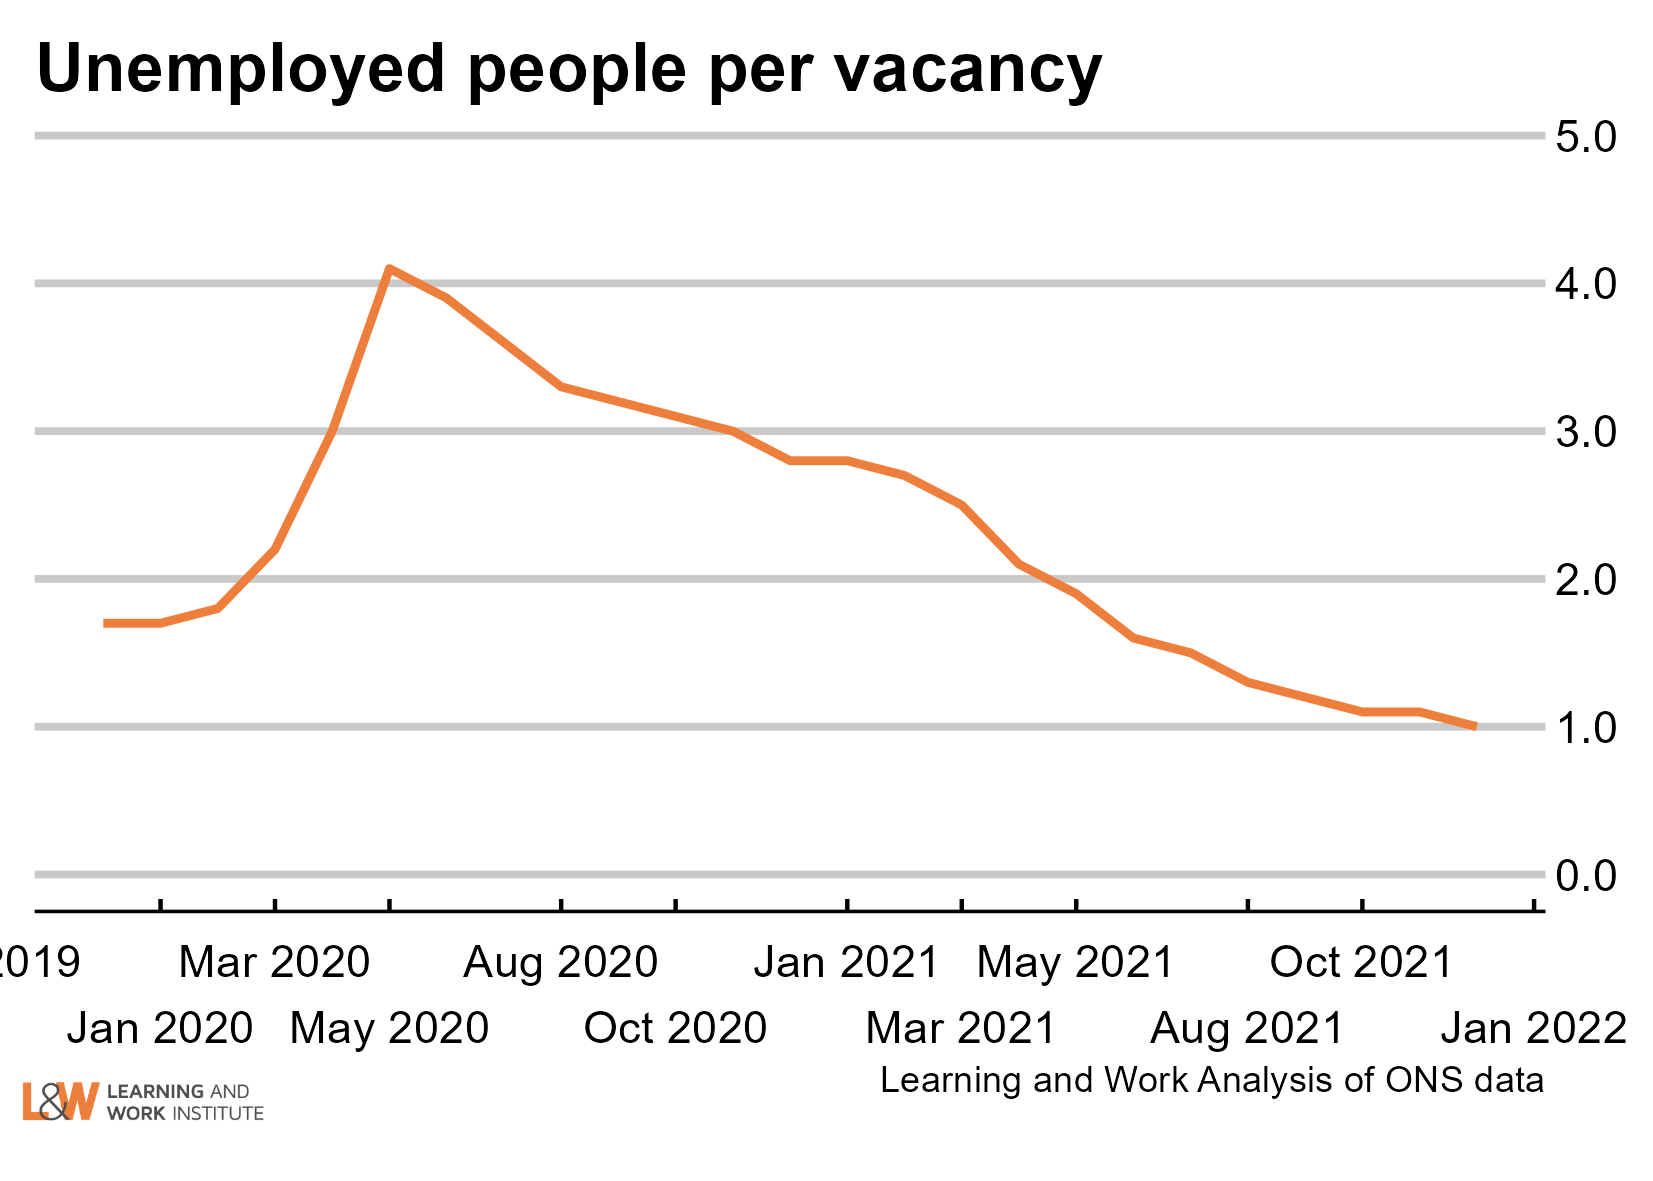 |
|
| Chart 12: Online vacancies to early March from Indeed Online vacancies as published by Indeed have reached 49% above the February 2020 level. These are seasonally adjusted, so do not show the large swings around Christmas that are shown in the non-seasonally adjusted figures. 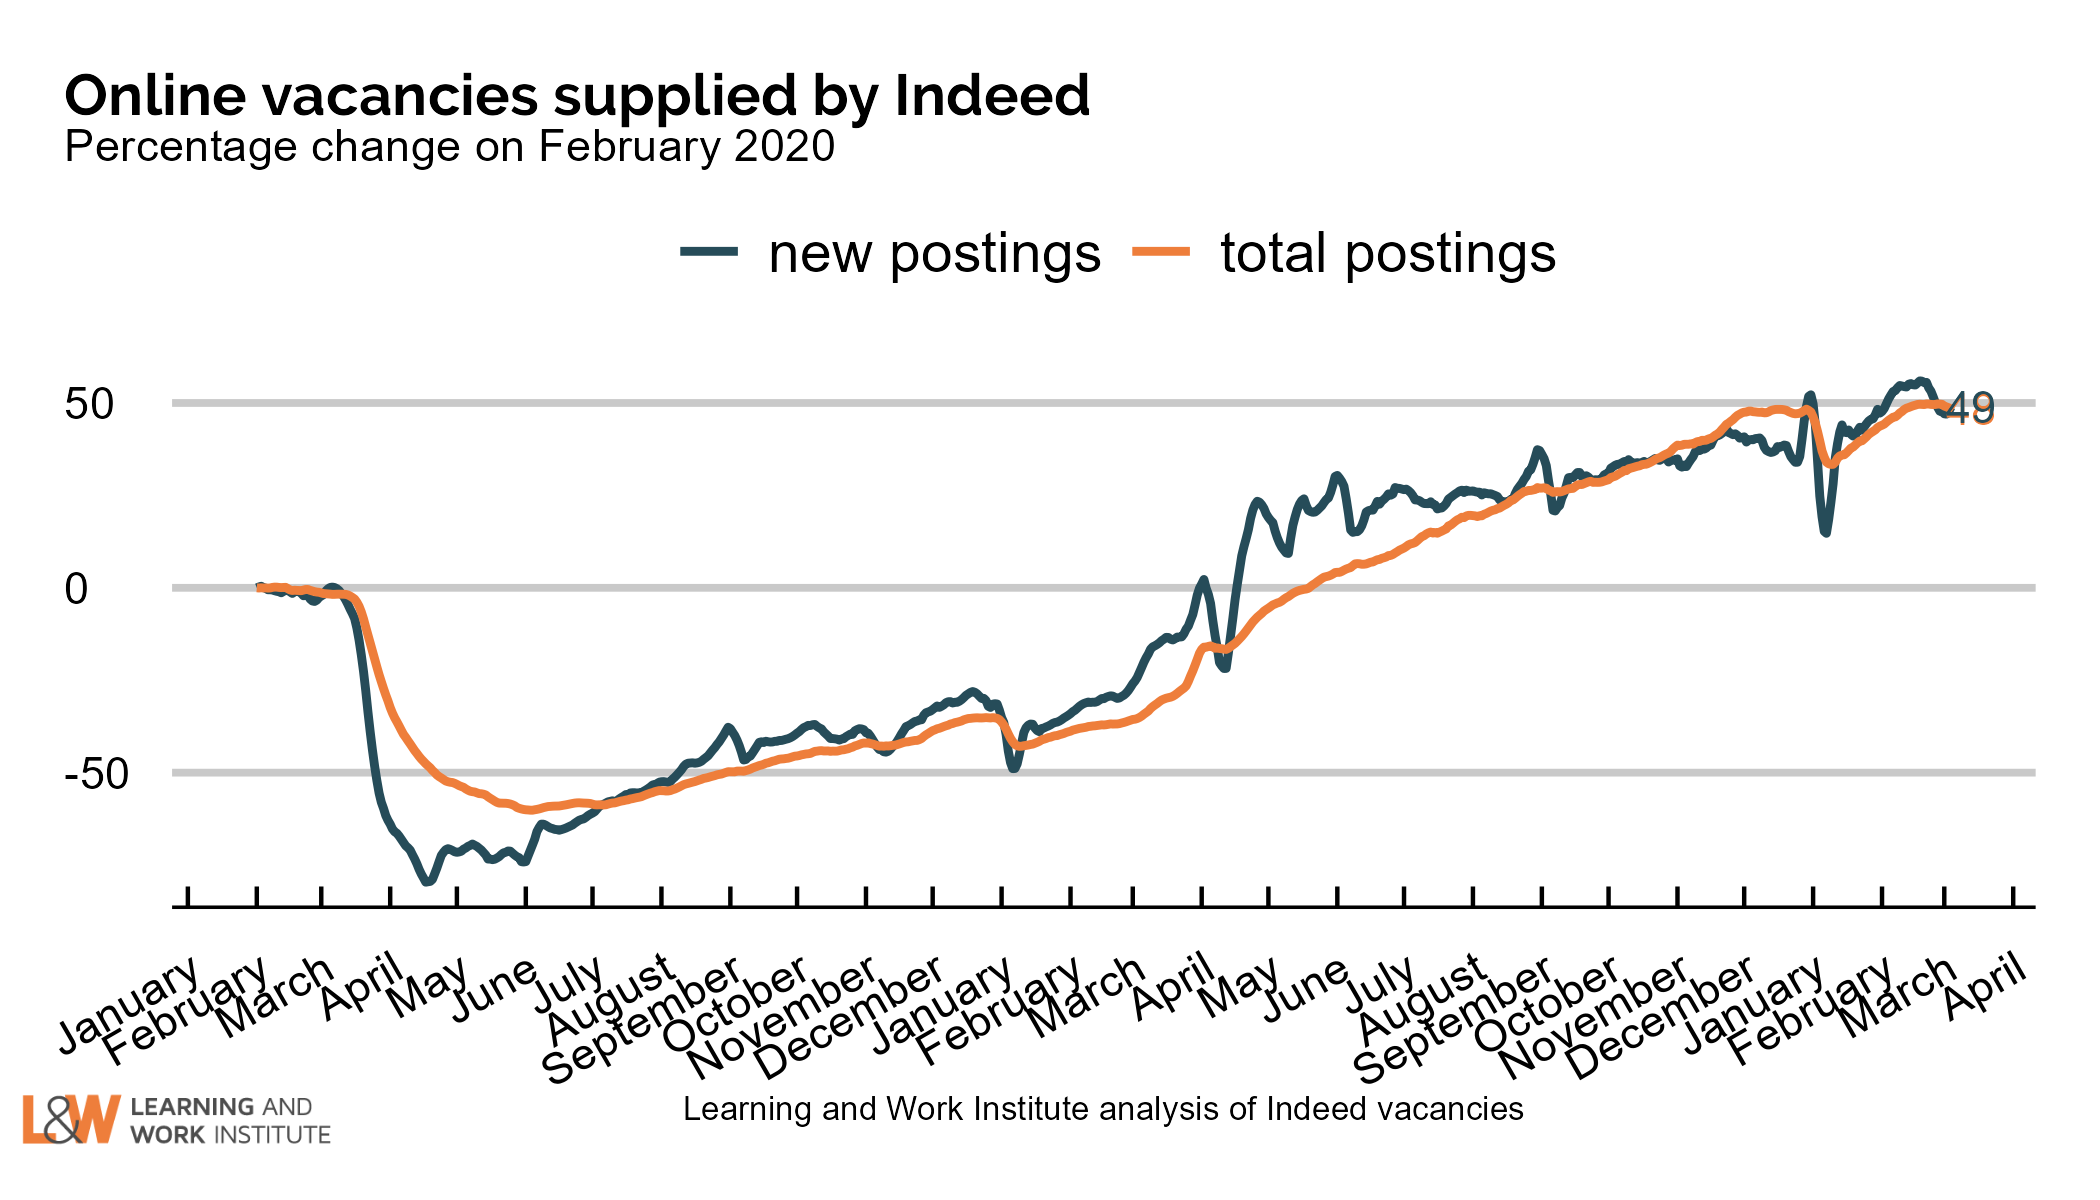 |
|
| Chart 13: UK employment Employment increased by 8,000 on the figure published last month, to 32,493,000. The chart shows both the official figures and the experimental weekly figures. The trend is likely to be upwards. 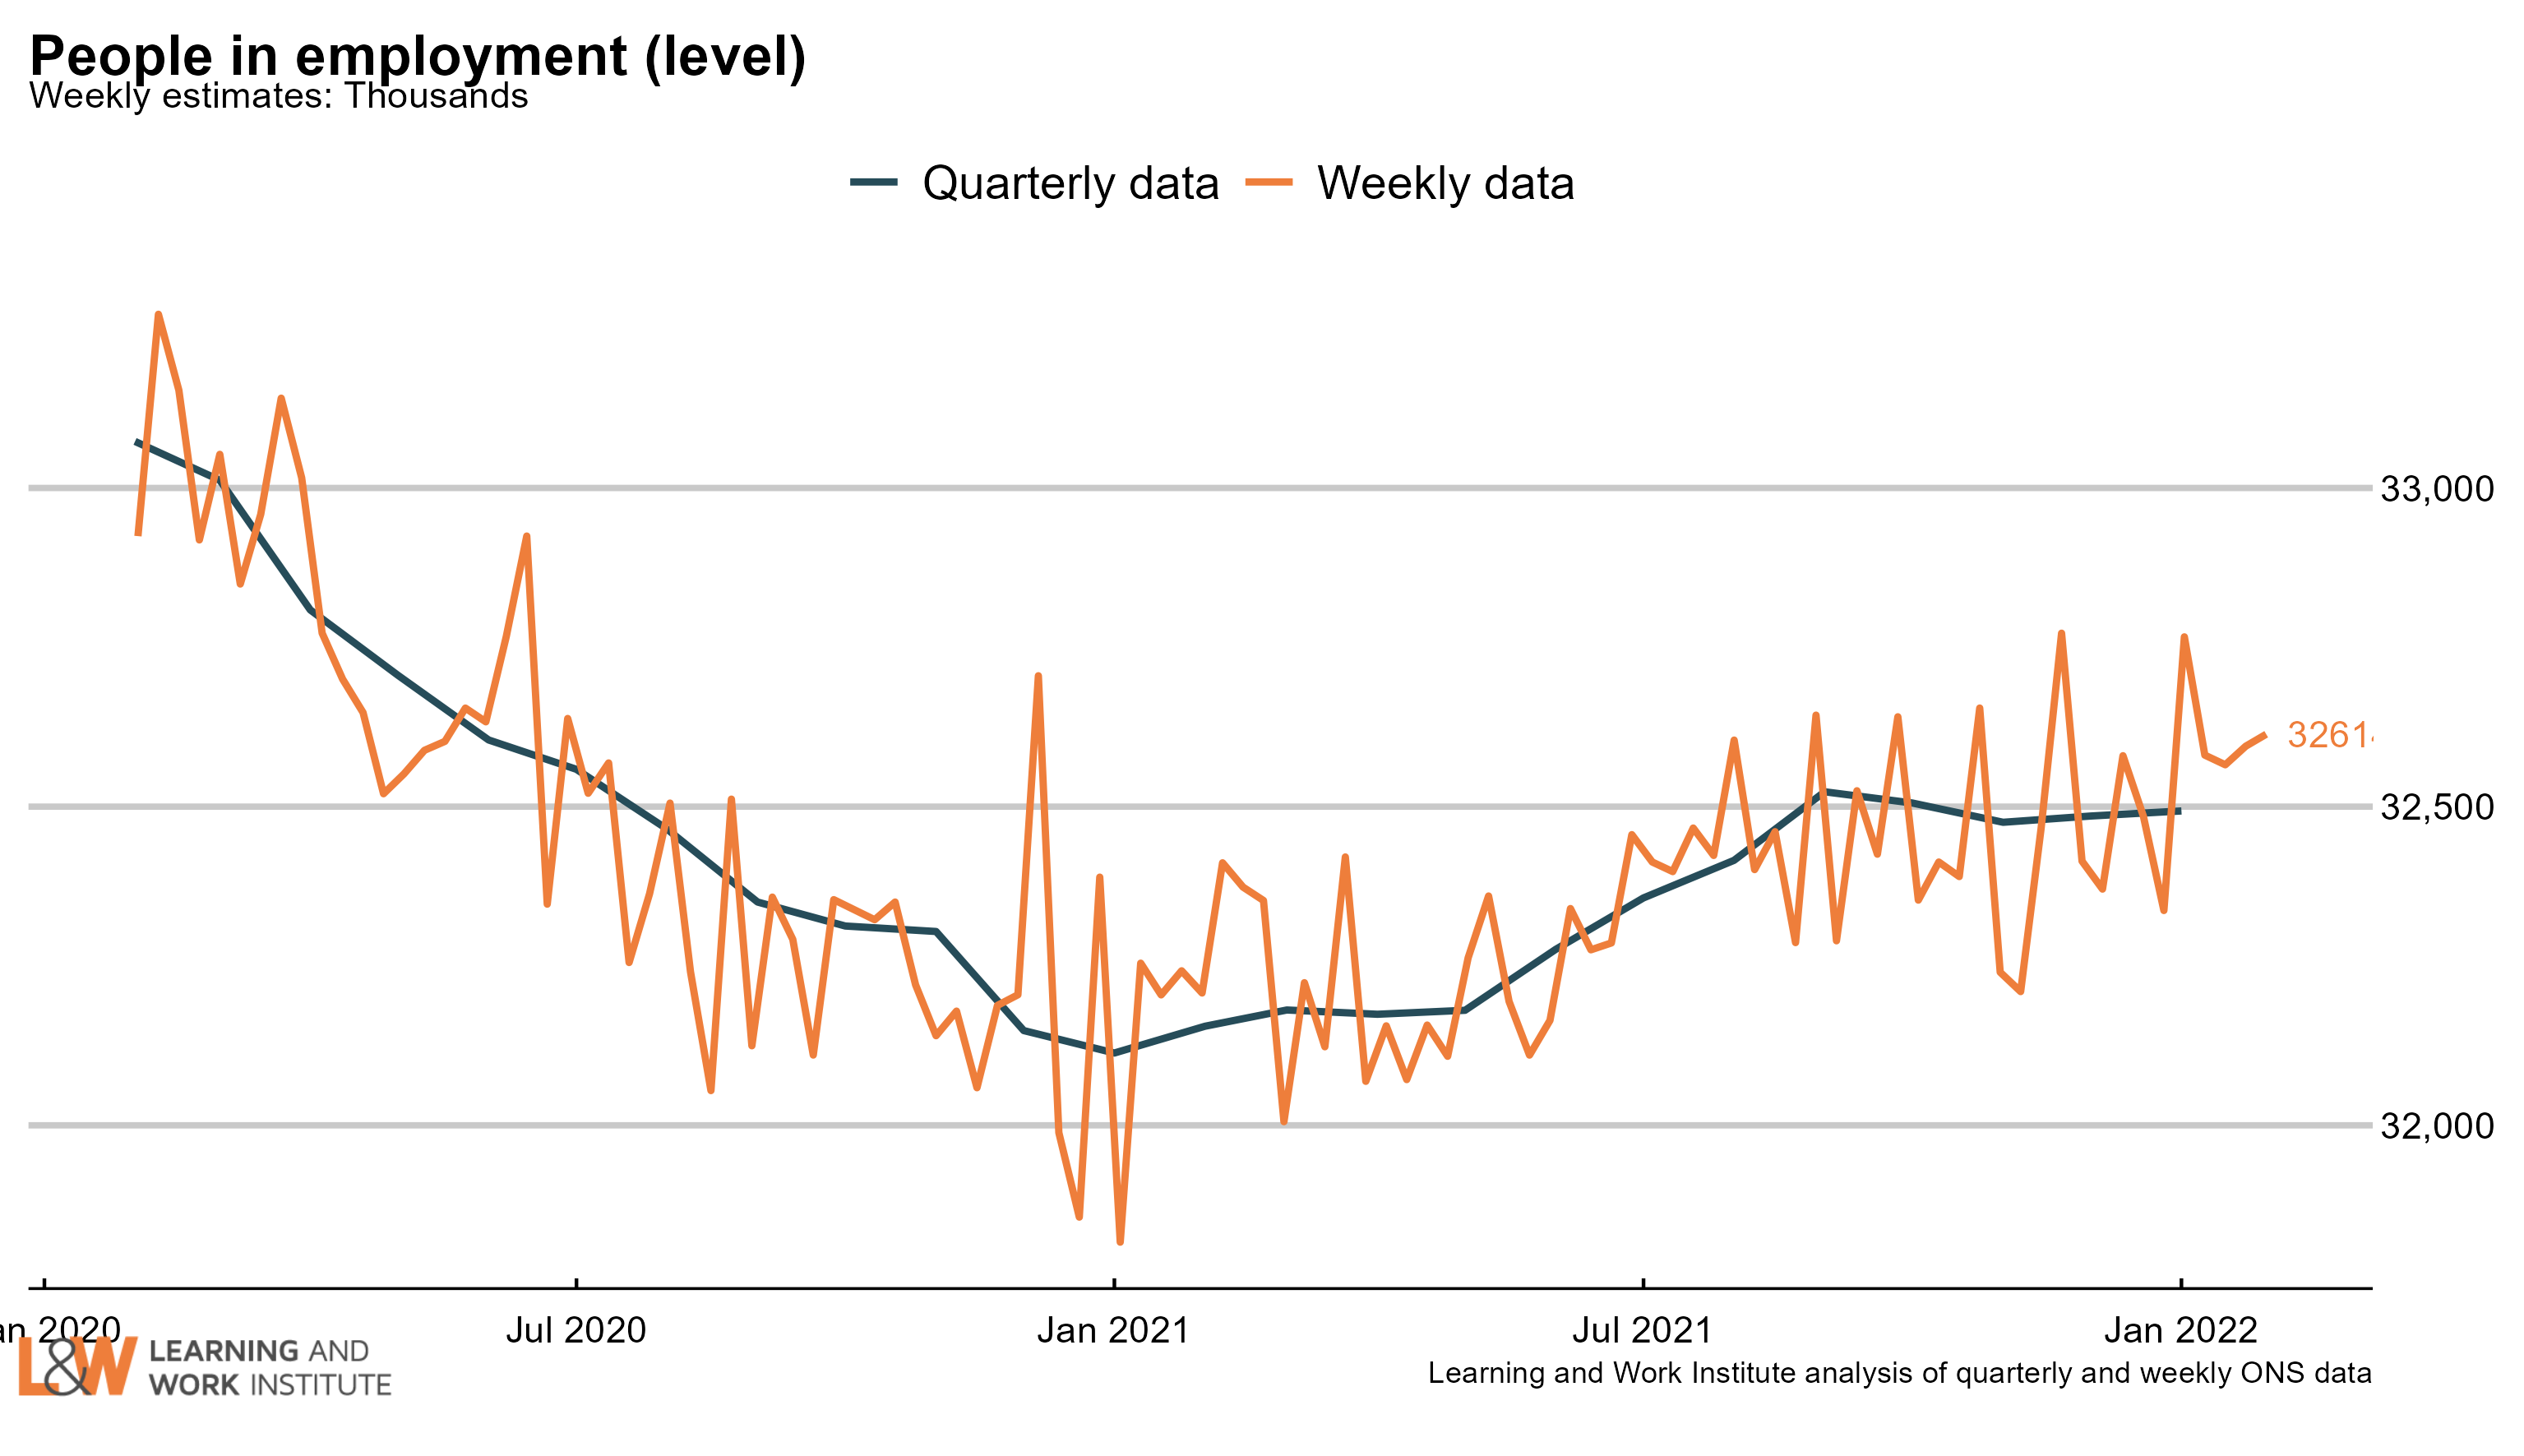 |
|
| Chart 14: Employment rate in the UK The employment rate is up by 0.1 percentage points over the quarter, to 75.6%. The chart shows both the official figures and the experimental weekly figures. The trend is likely to be upwards. 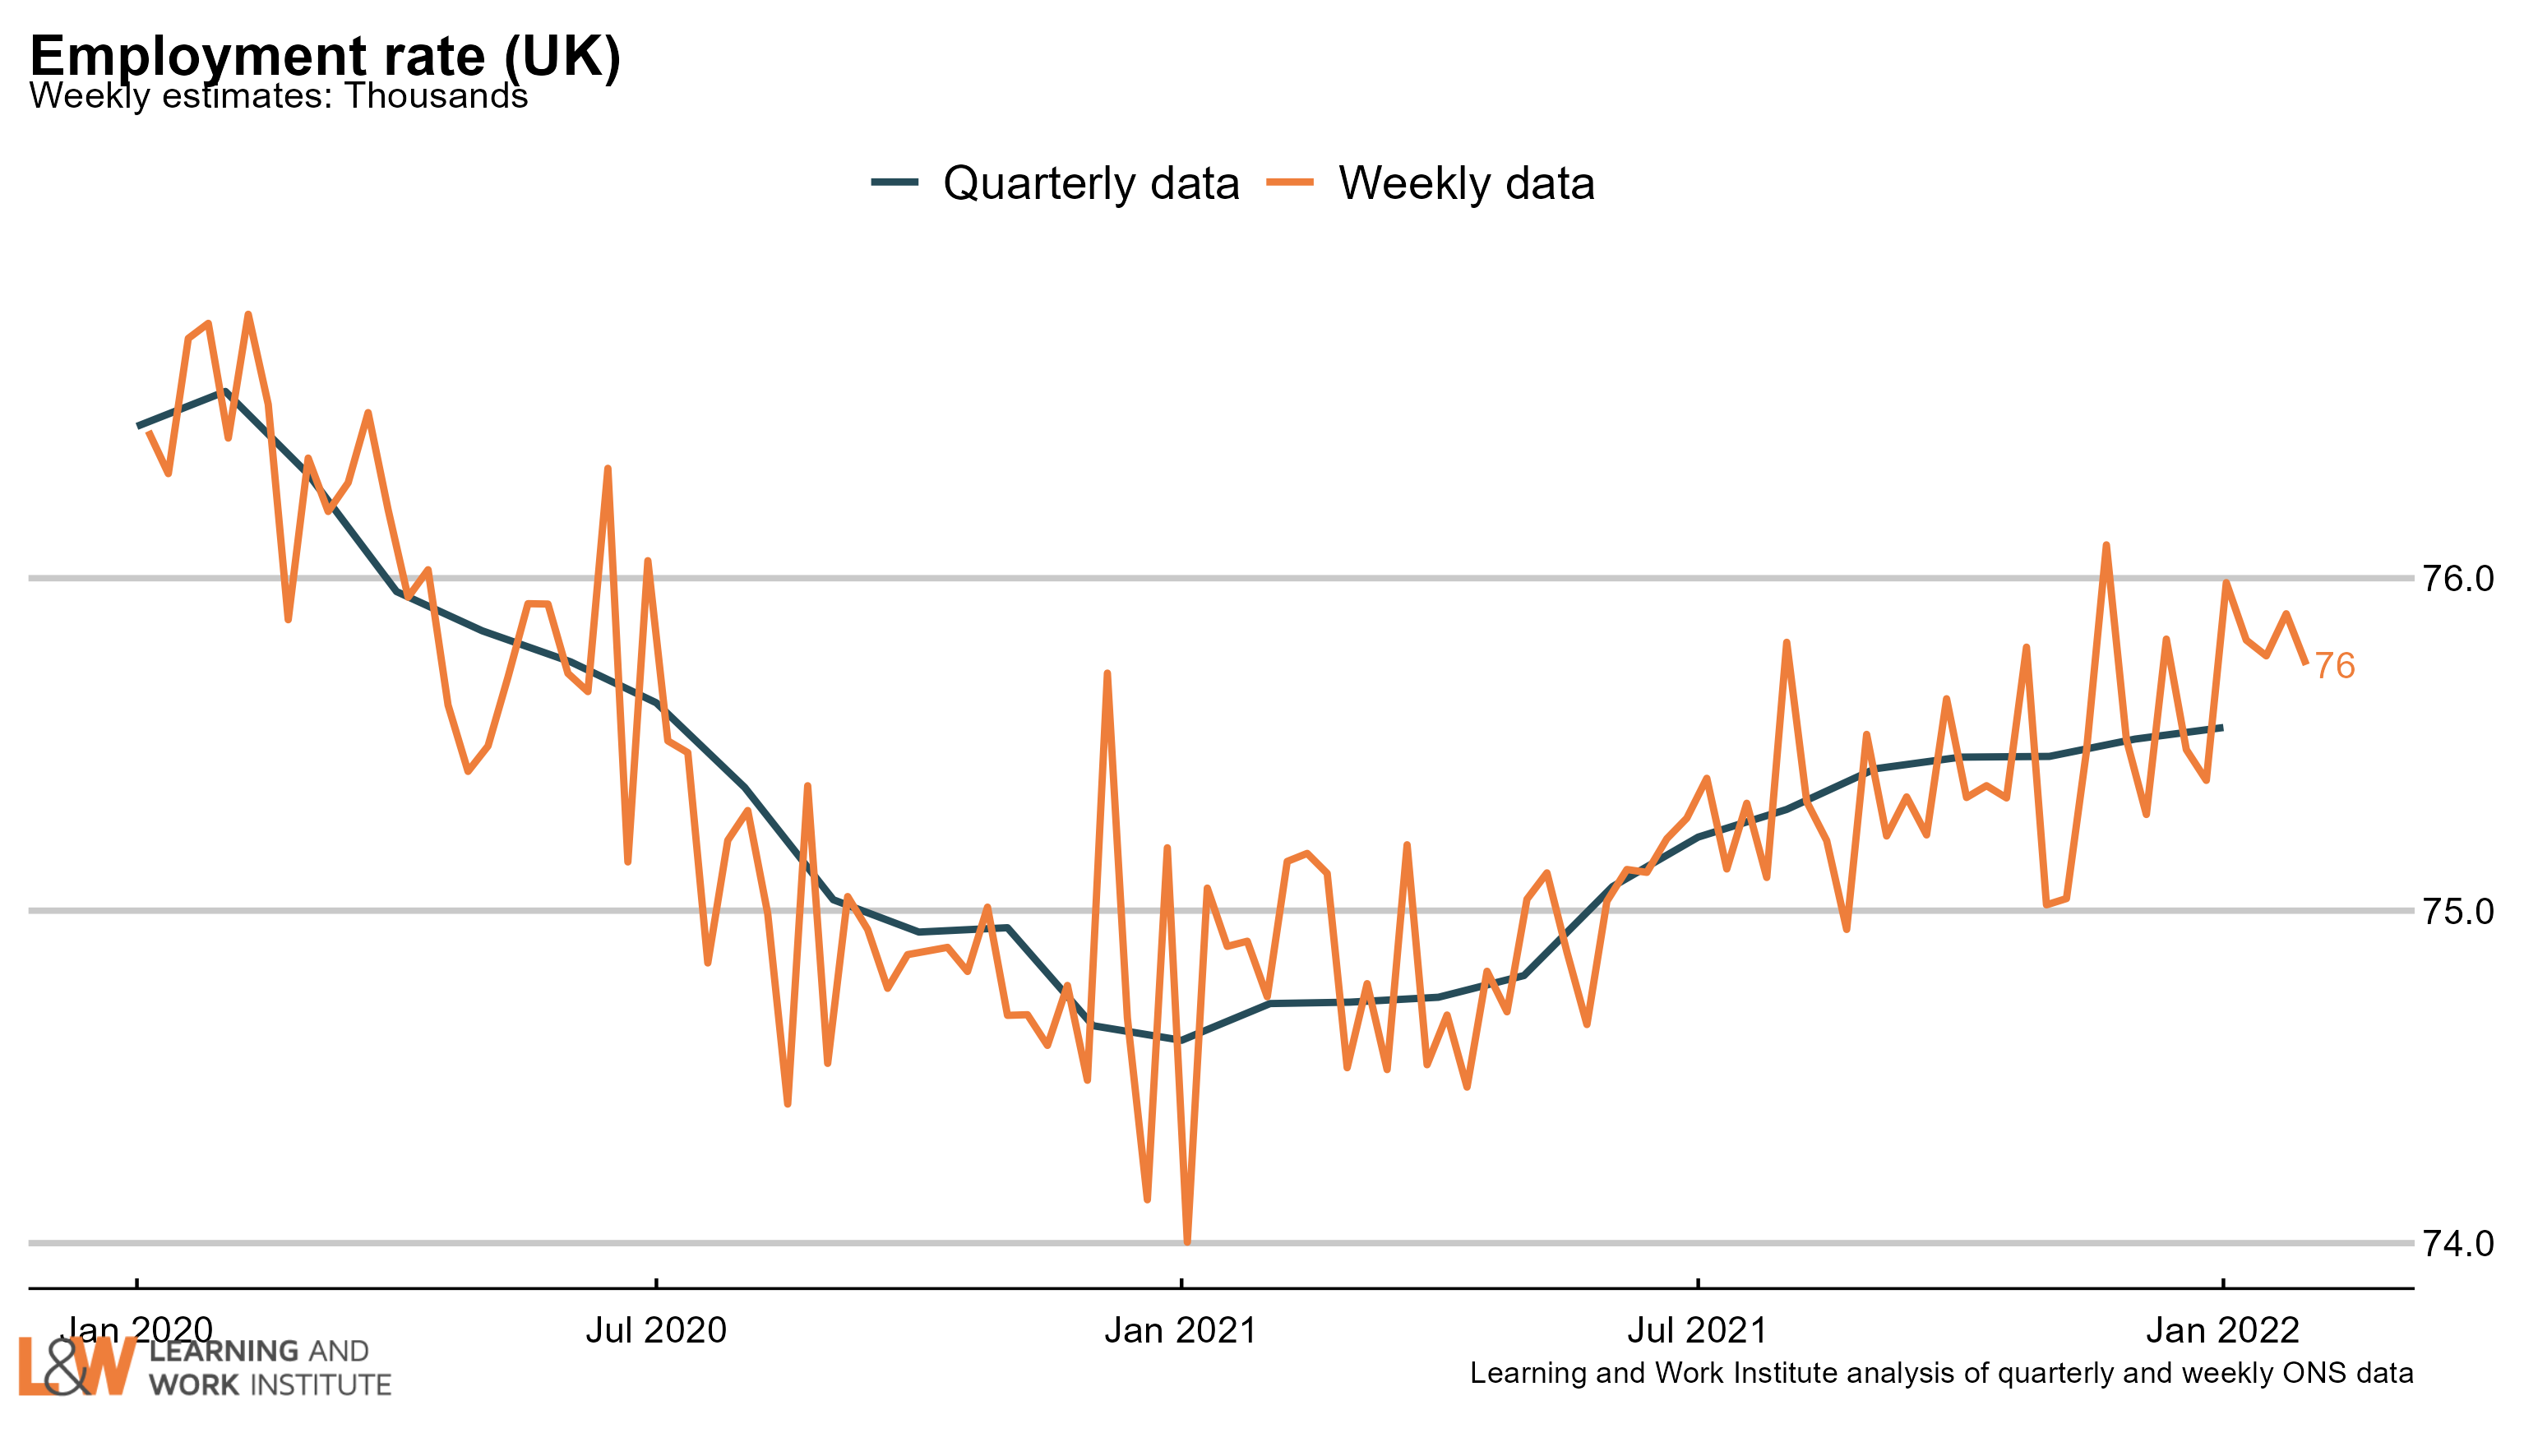 |
|
| Chart 15: Economic inactivity – the long-term sick or disabled The numbers of people who are economically inactive (that is, not working and not currently looking for work) who are long-term sick or disabled has risen sharply in the last six months to 2.3 million working age people. 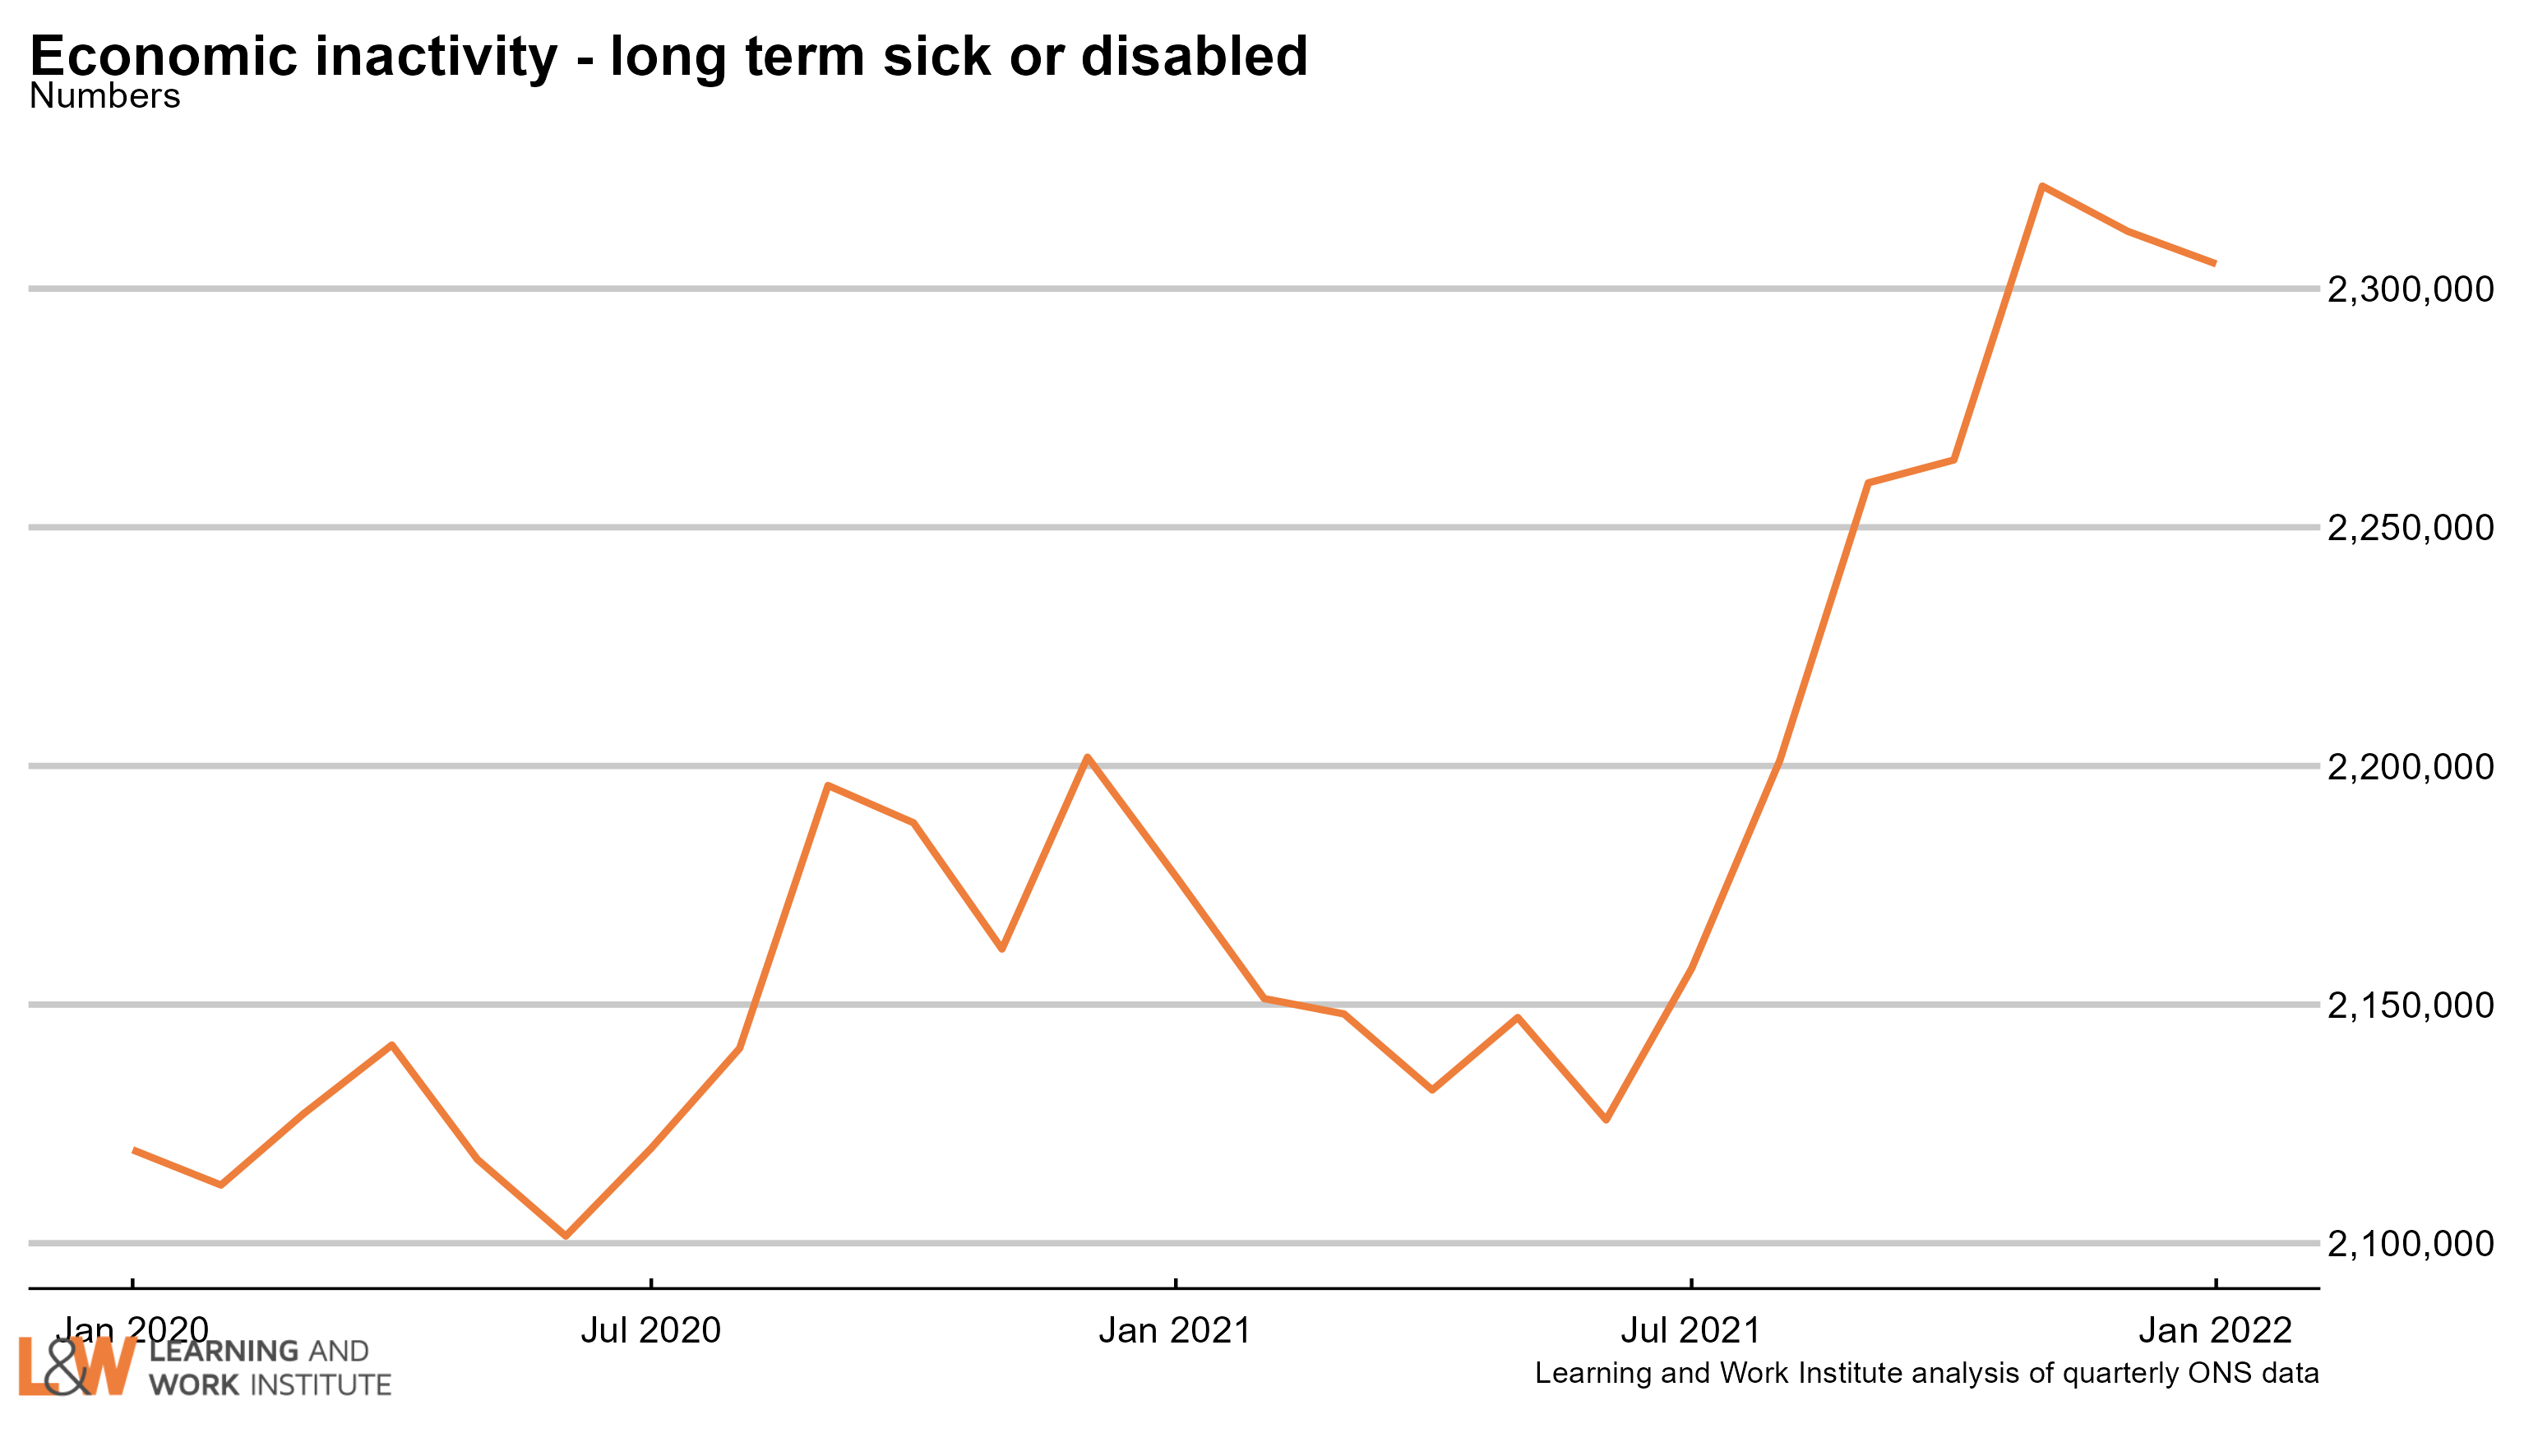 |
|
| Chart 16: Economic inactivity – people looking after family The survey figures showing those looking after family and not doing paid work or looking for paid work had been trending downwards but have been rising steadily since early 2021. 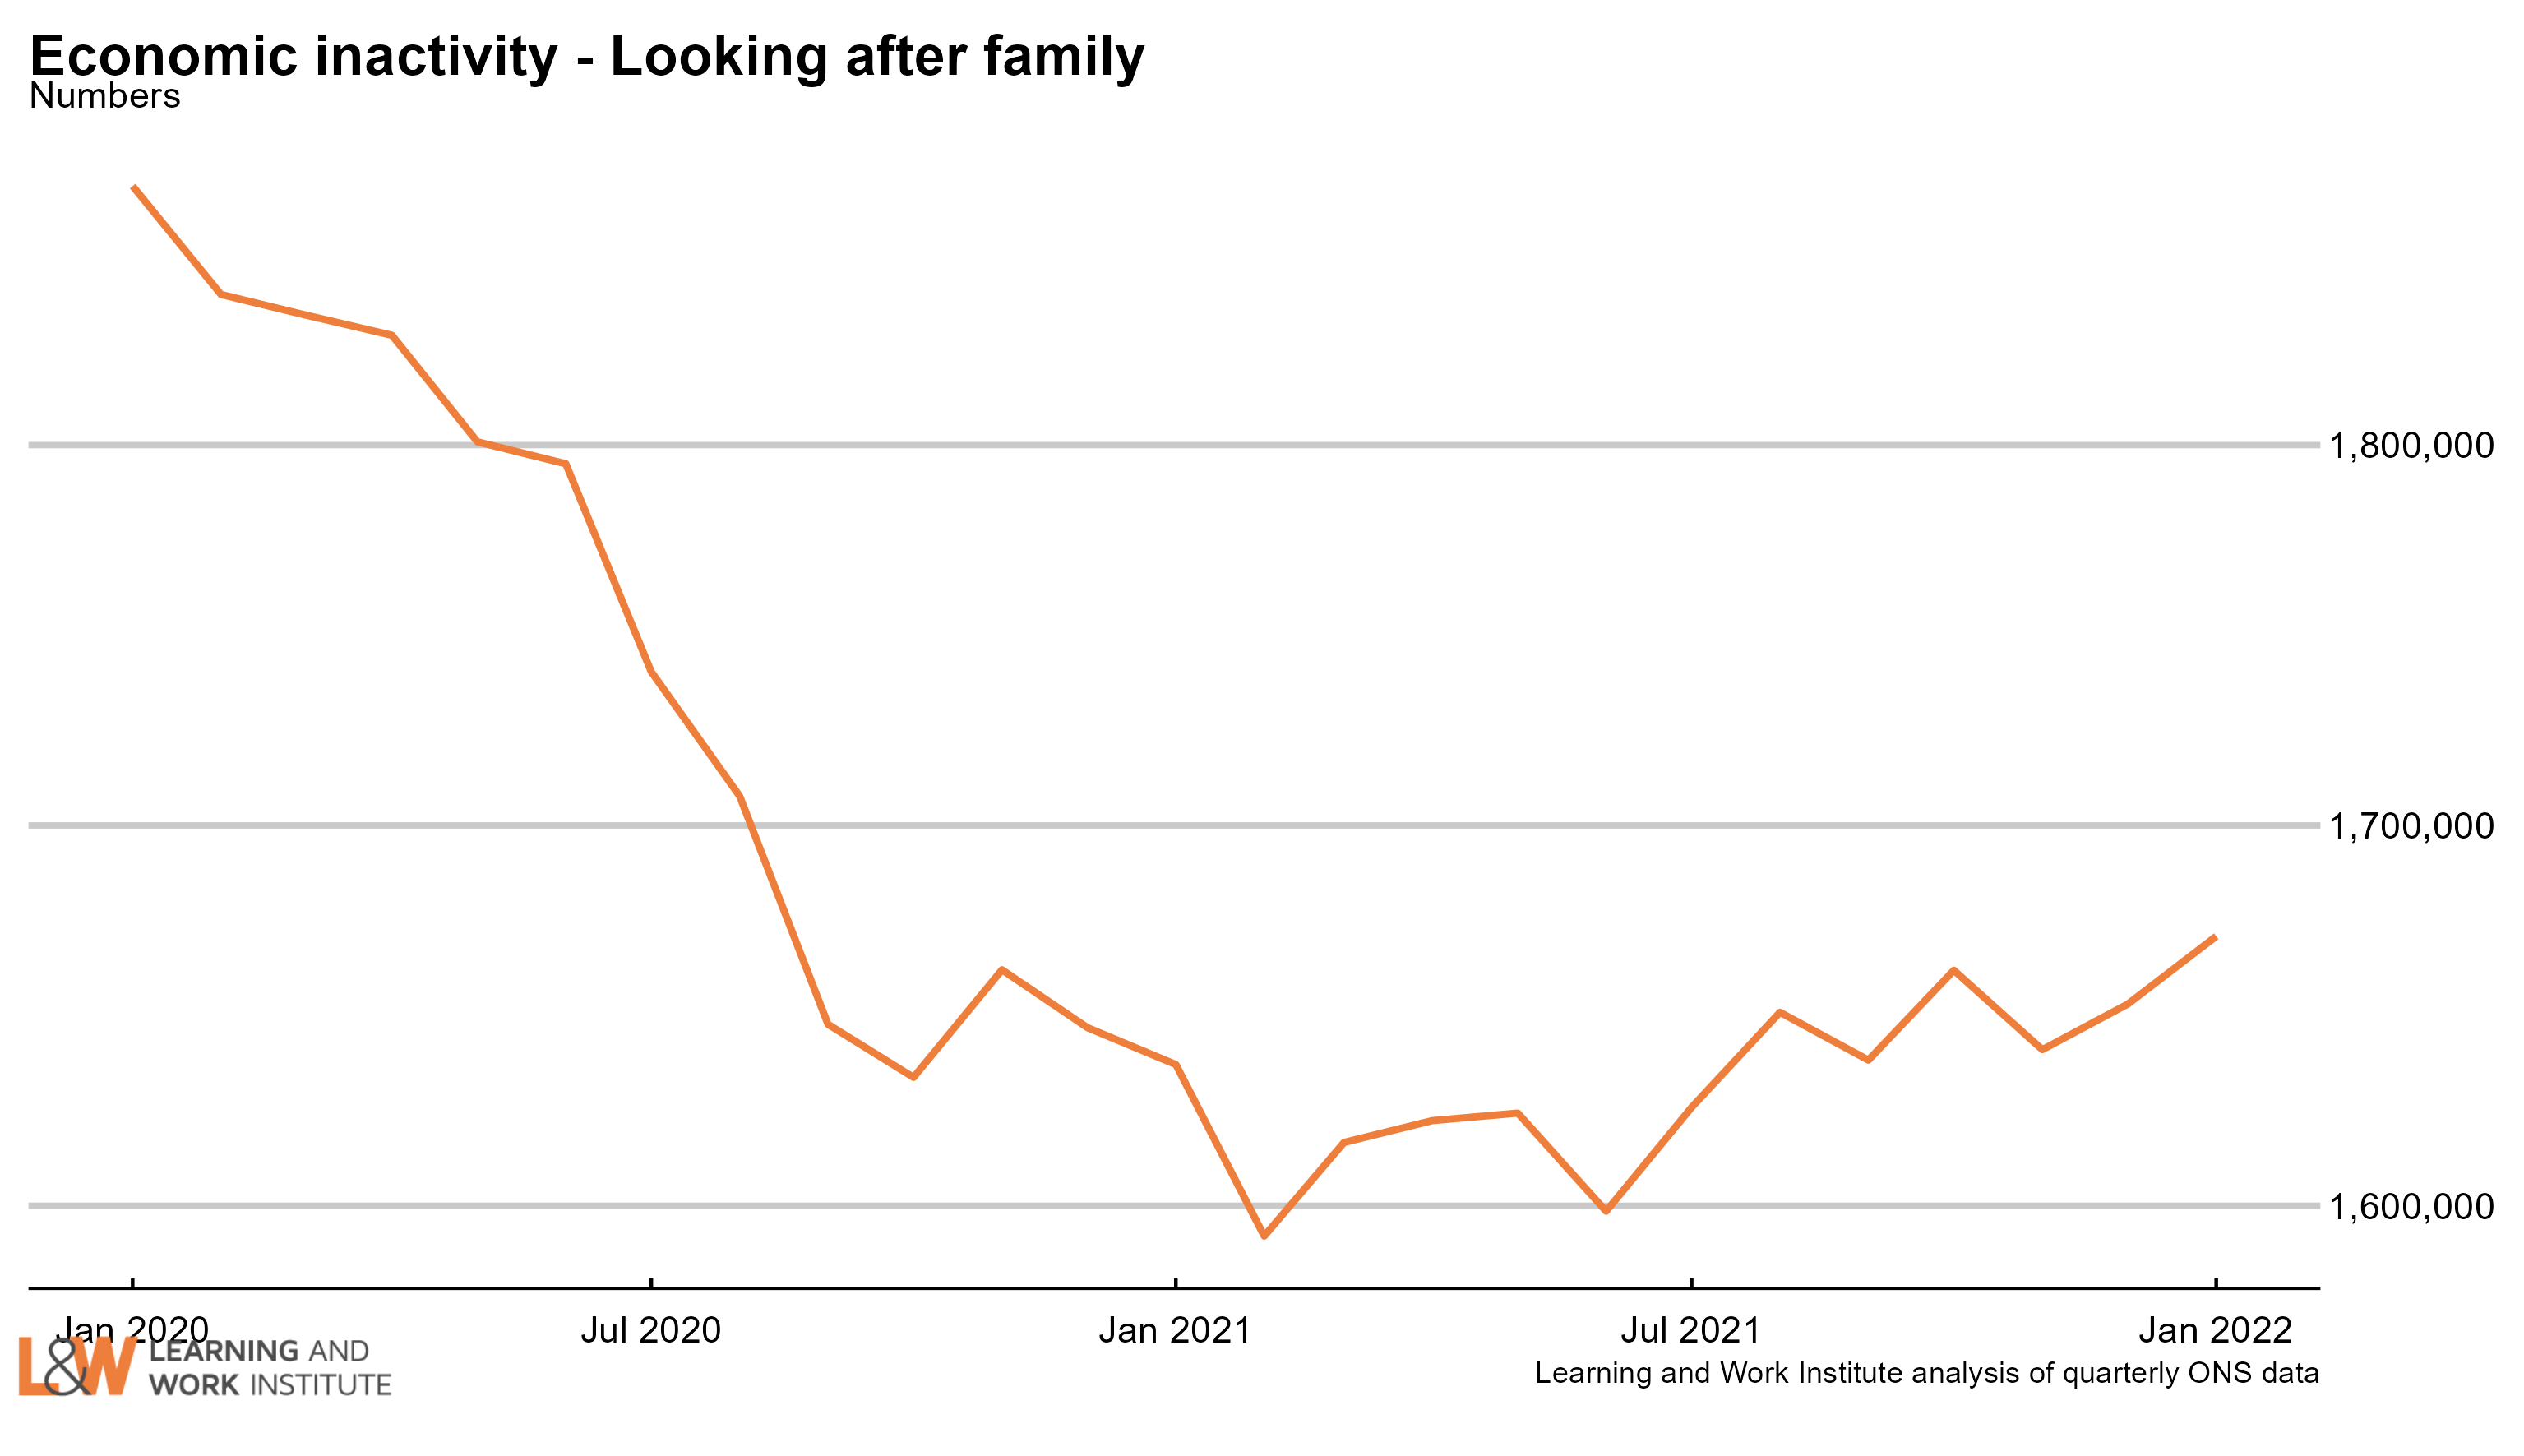 |
|
| Chart 17: Economic inactivity – other inactive In the Coronavirus period, people who were not working or looking for work due to Covid were included in this group. The number in this category increased sharply at the time, and has continued at a high level. A very high proportion of this group want to work, and this increased over the period of the pandemic. 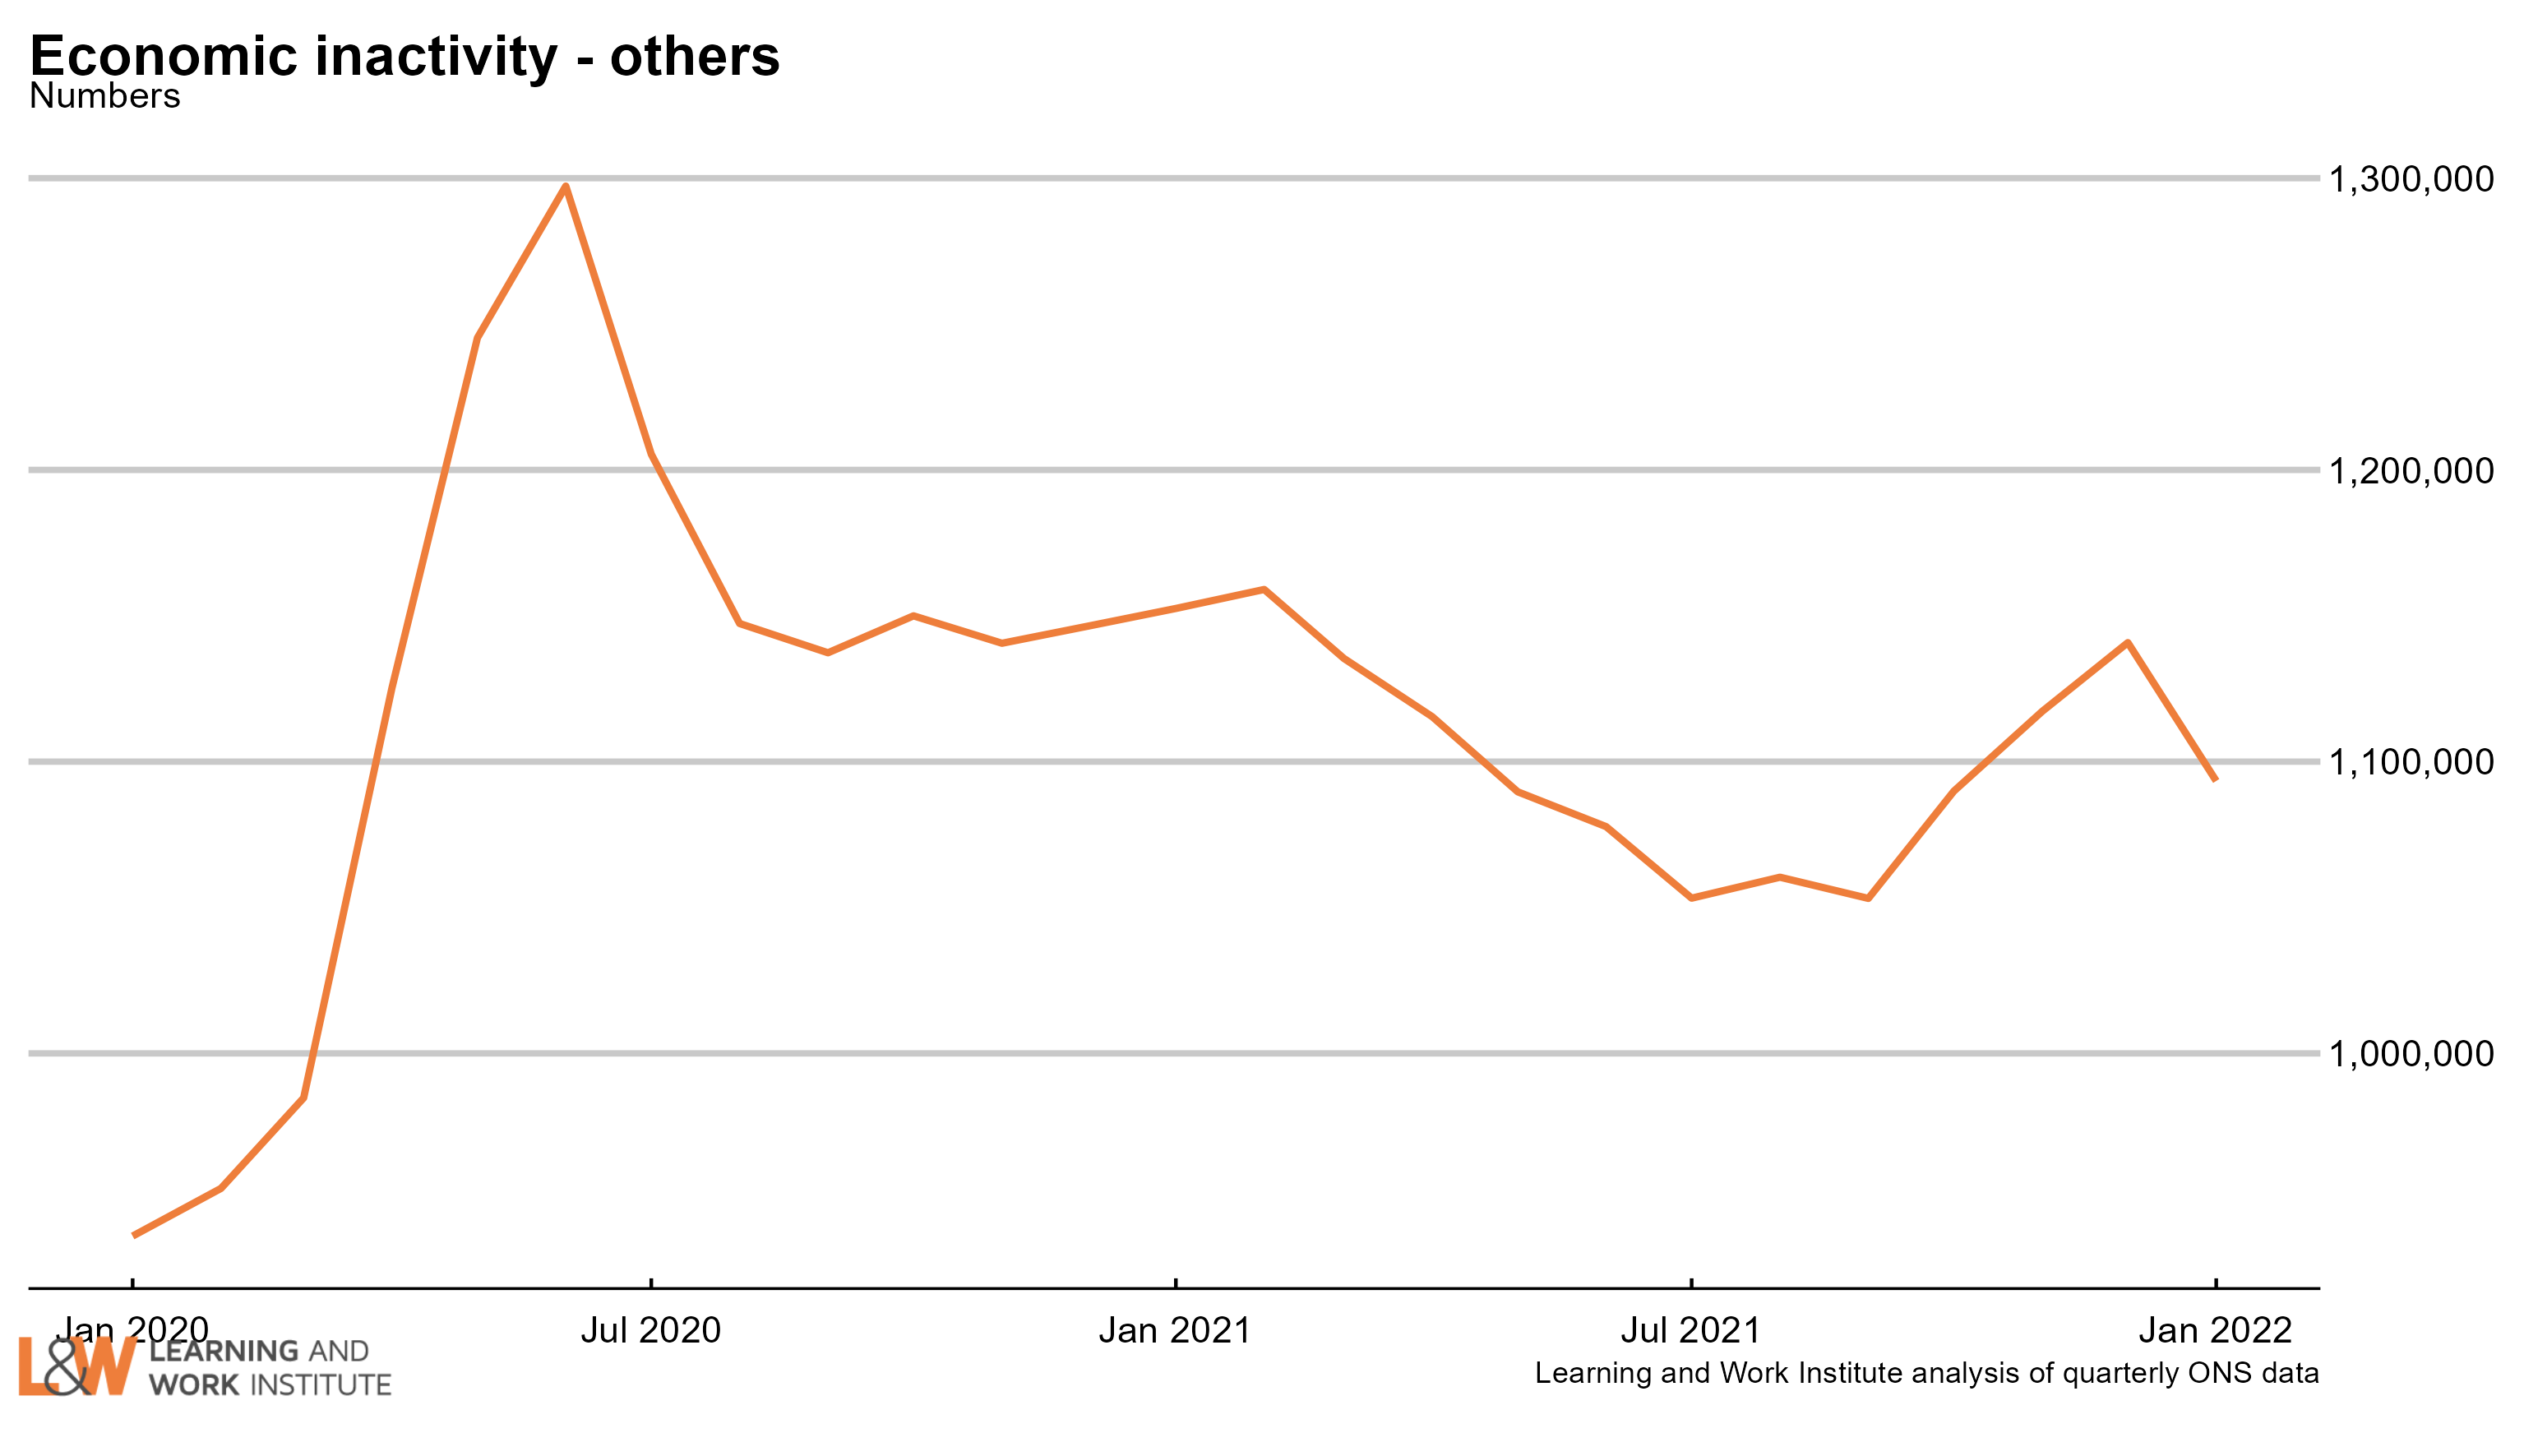 |
|
| Chart 18: Employment rate two-year change in regions – November 2021 to January 2022 Two regions showed a rise in the employment rate, compared with two years ago, the West Midlands and the Eastern region. The employment rate fell in nine regions, led by the South East and the North West. 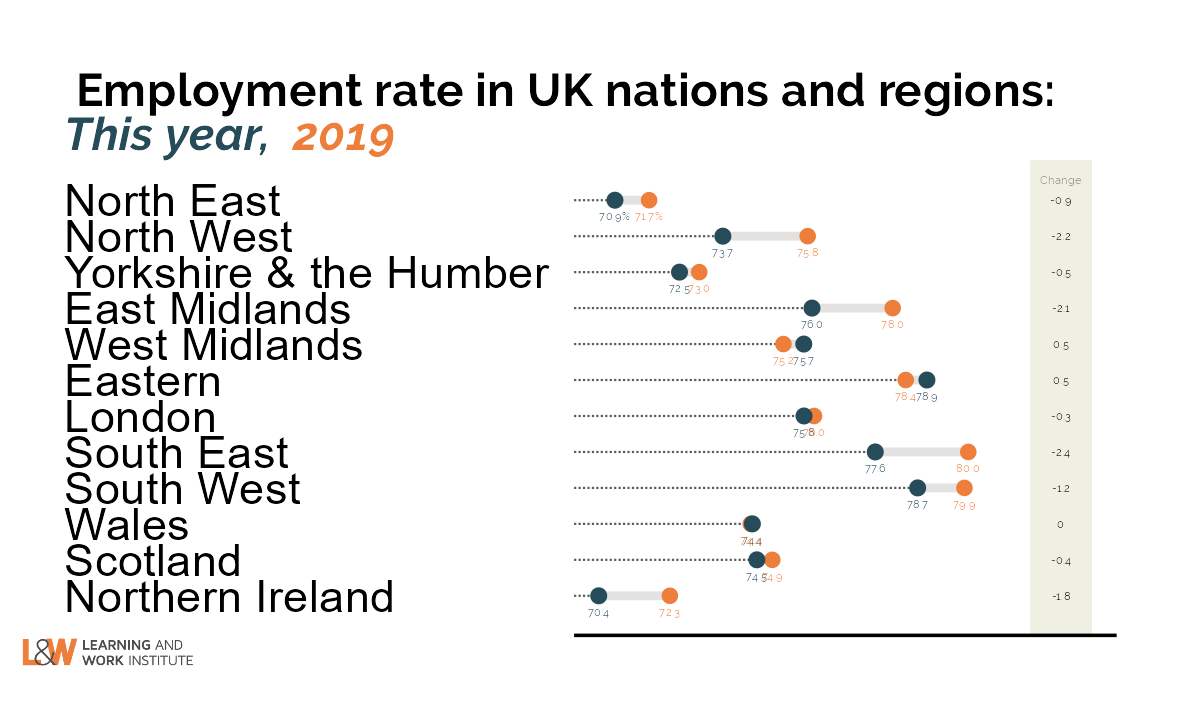 |
|
| Chart 19: Unemployment rate two-year change in regions – November 2021 to January 2022 Six regions showed a rise in the unemployment rate, compared with two years ago, led by the South East and London. The unemployment rate fell in six regions, led by the North East, Yorkshire and the Humber and the East Midlands. 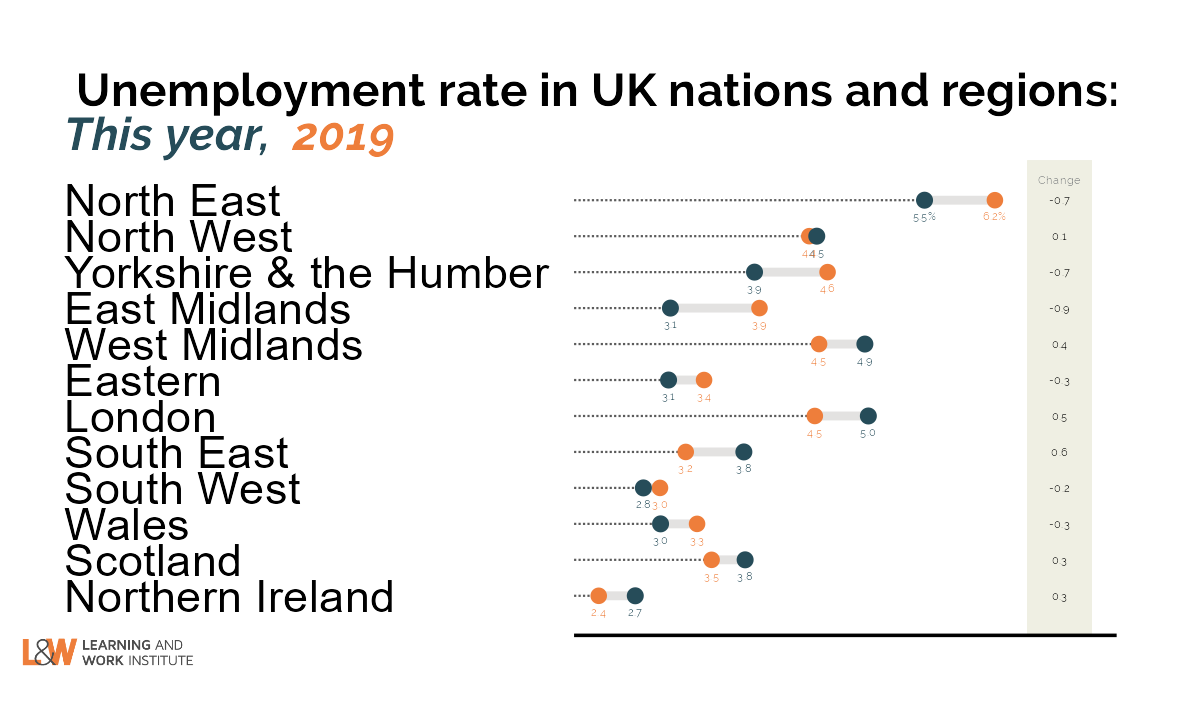 |
|
| Chart 20: Inactivity rate two-year change in regions – November 2021 to January 2022 Nine regions showed a rise in the inactivity rate, compared with two years ago, led by the East Midlands and the North West. The inactivity rate fell in three regions, led by the West Midlands and London. 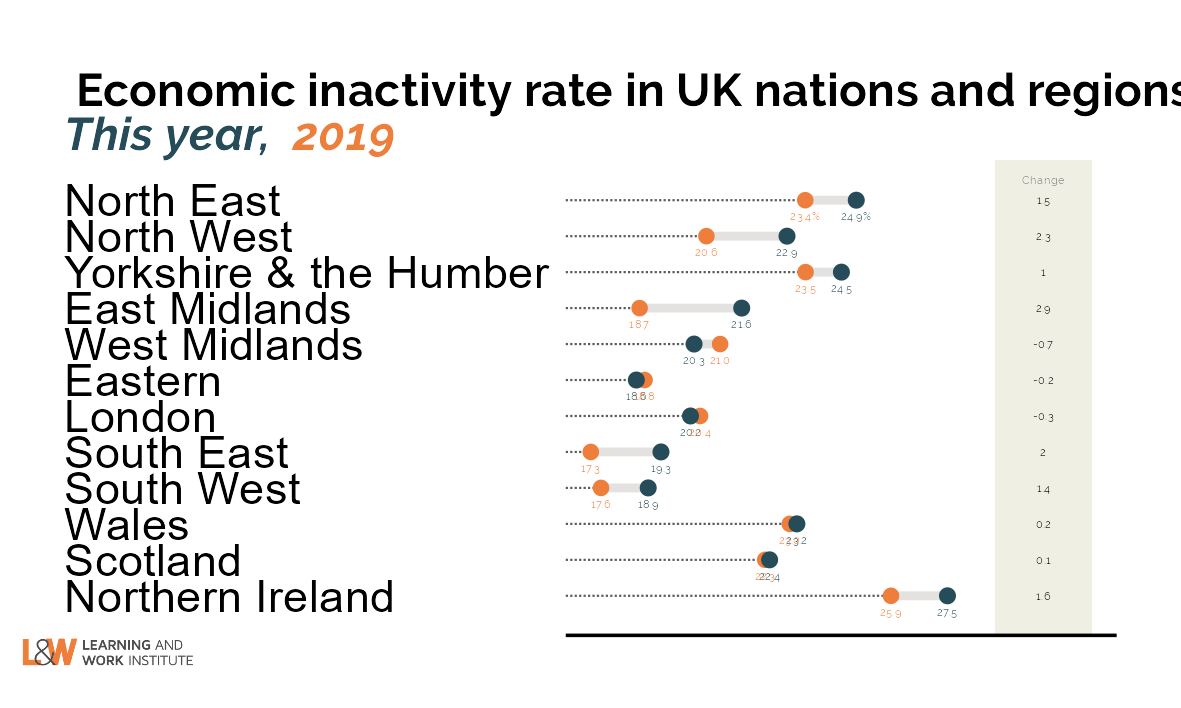 |
|
|
This newsletter is produced by Learning and Work Institute and keeps readers up to date on a wide range of learning and work issues. |
|