 |
|
| Making learning and work count Labour market LIVE from Learning and Work Institute 20 April 2021
Learning and Work Institute comment |
|
| Chart 1: UK unemployment (ILO) The latest unemployment rate fell by 0.1 percentage points to 4.9%. 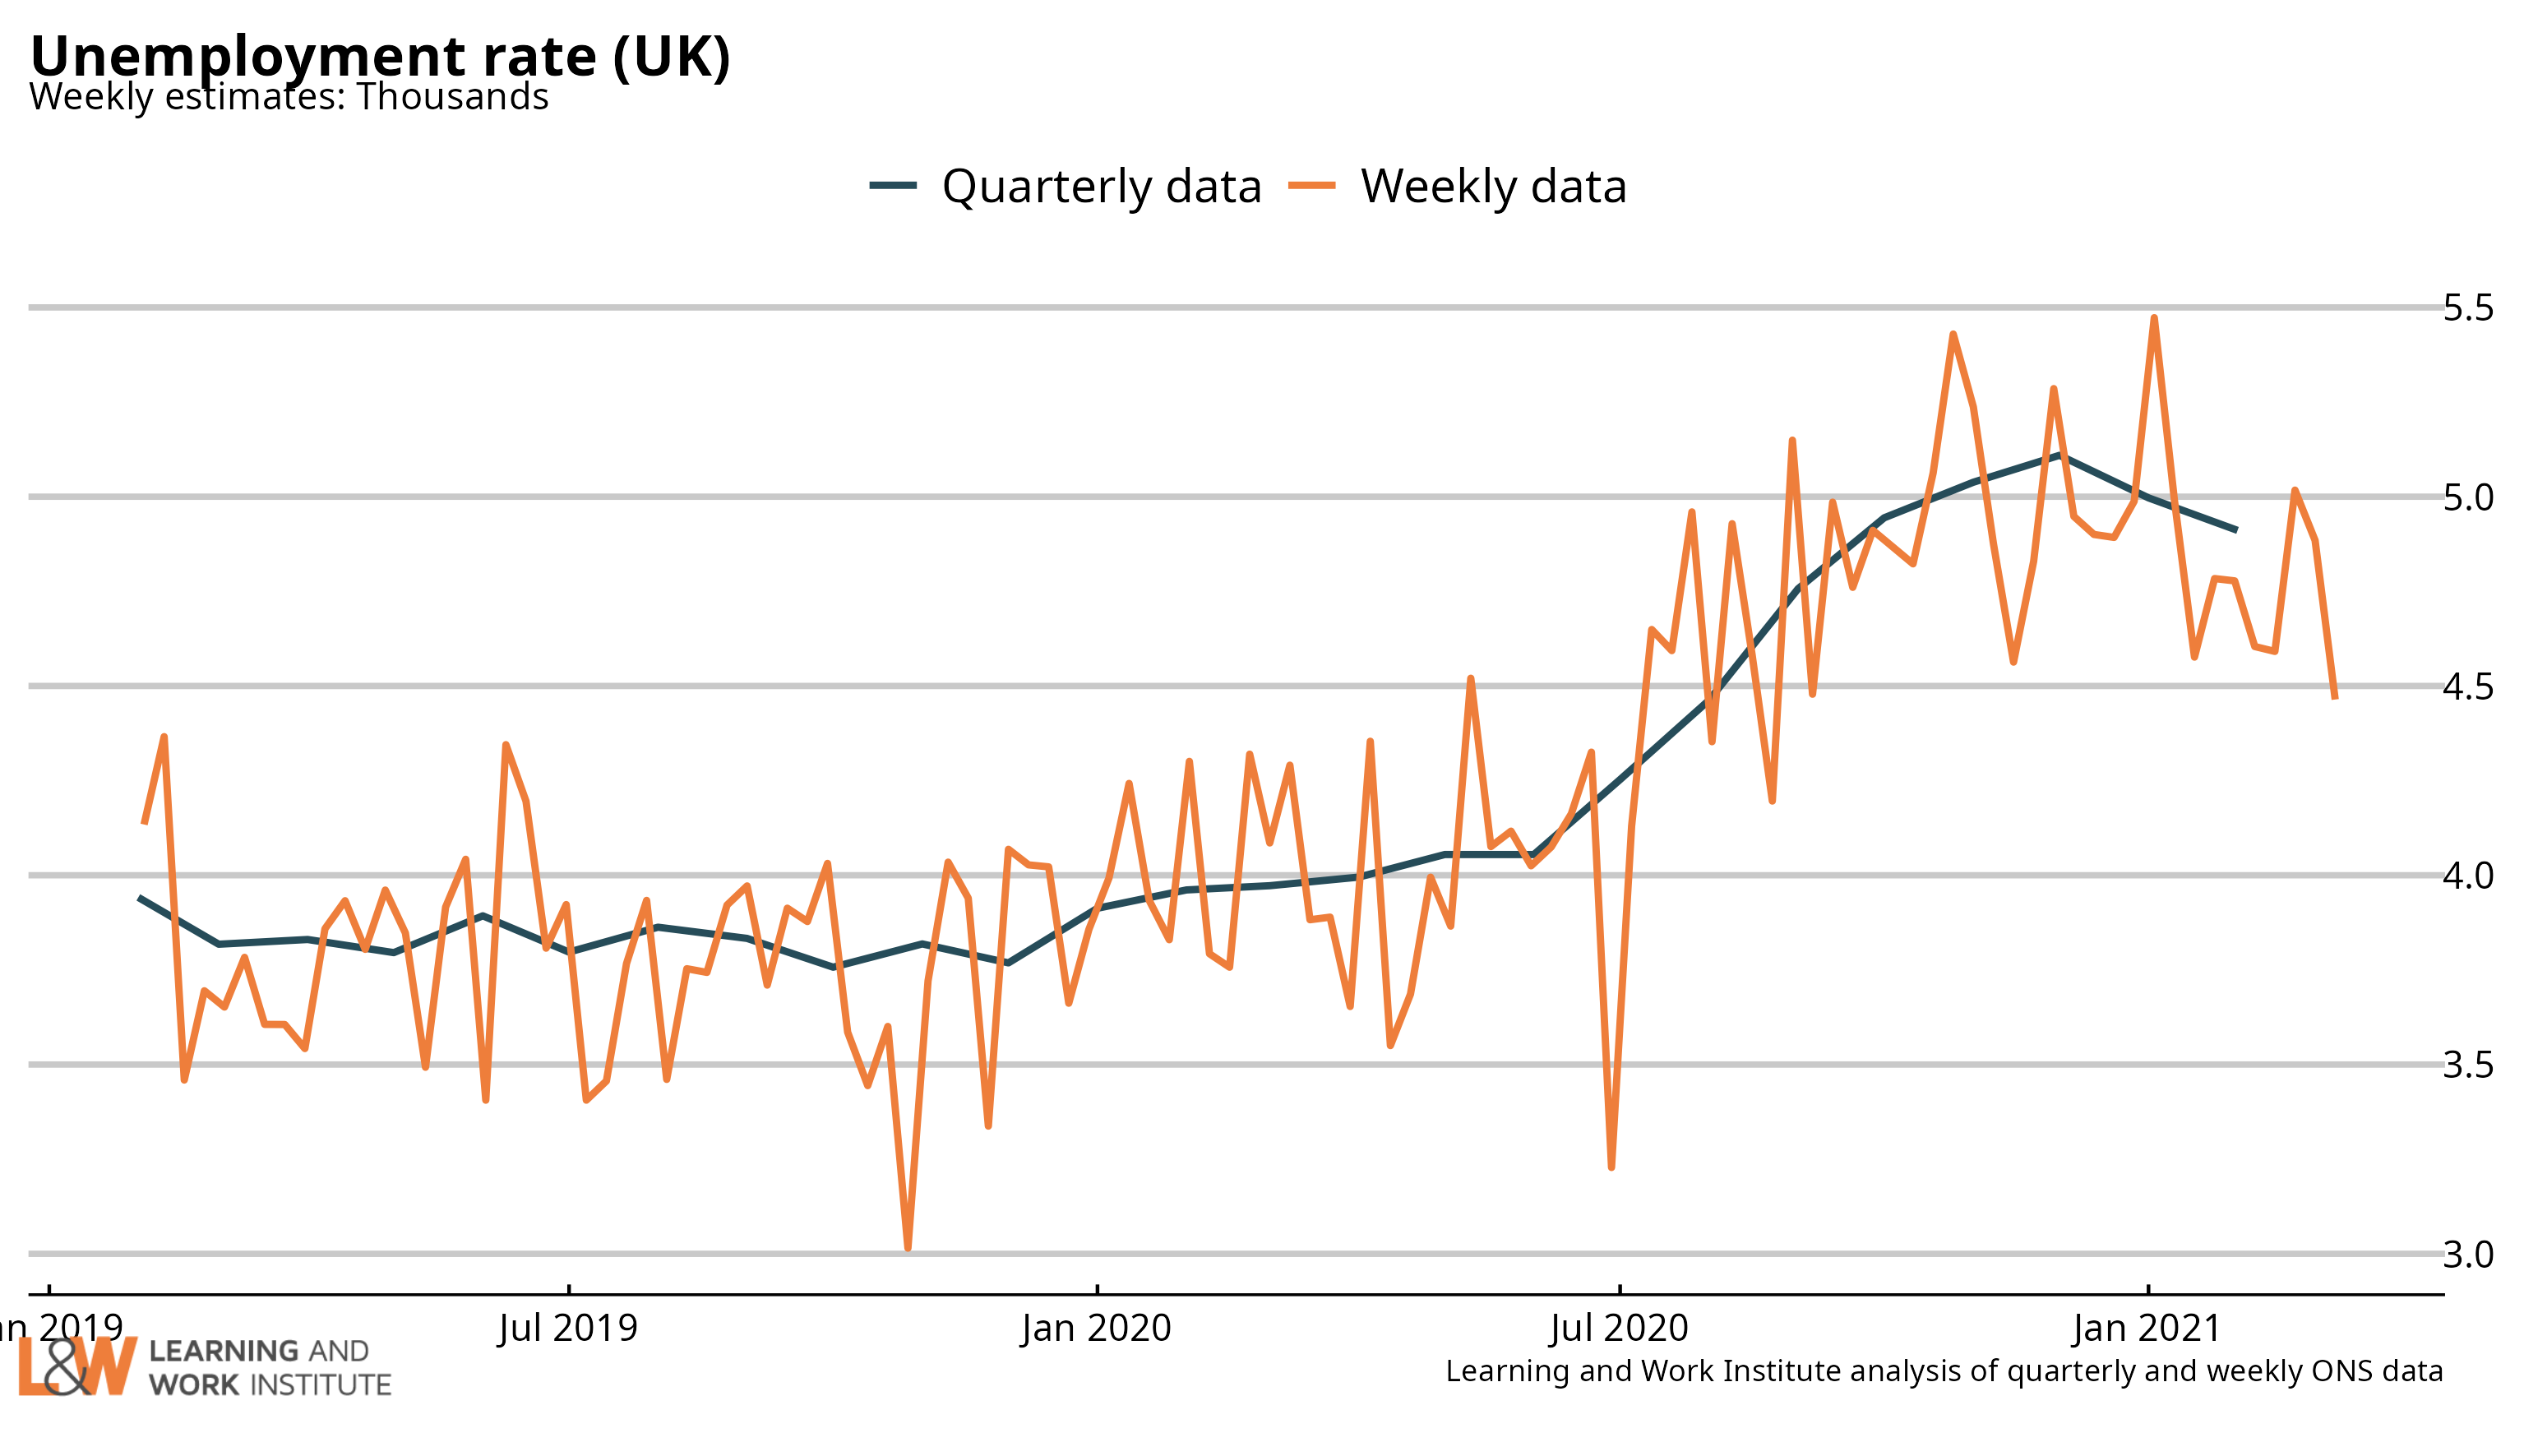 |
|
| Chart 2: The claimant count and UK unemployment compared The number of unemployed people who are claiming unemployment-related benefits is now 2,673,700, which is 998,700 higher than the number of unemployed in the official measure. 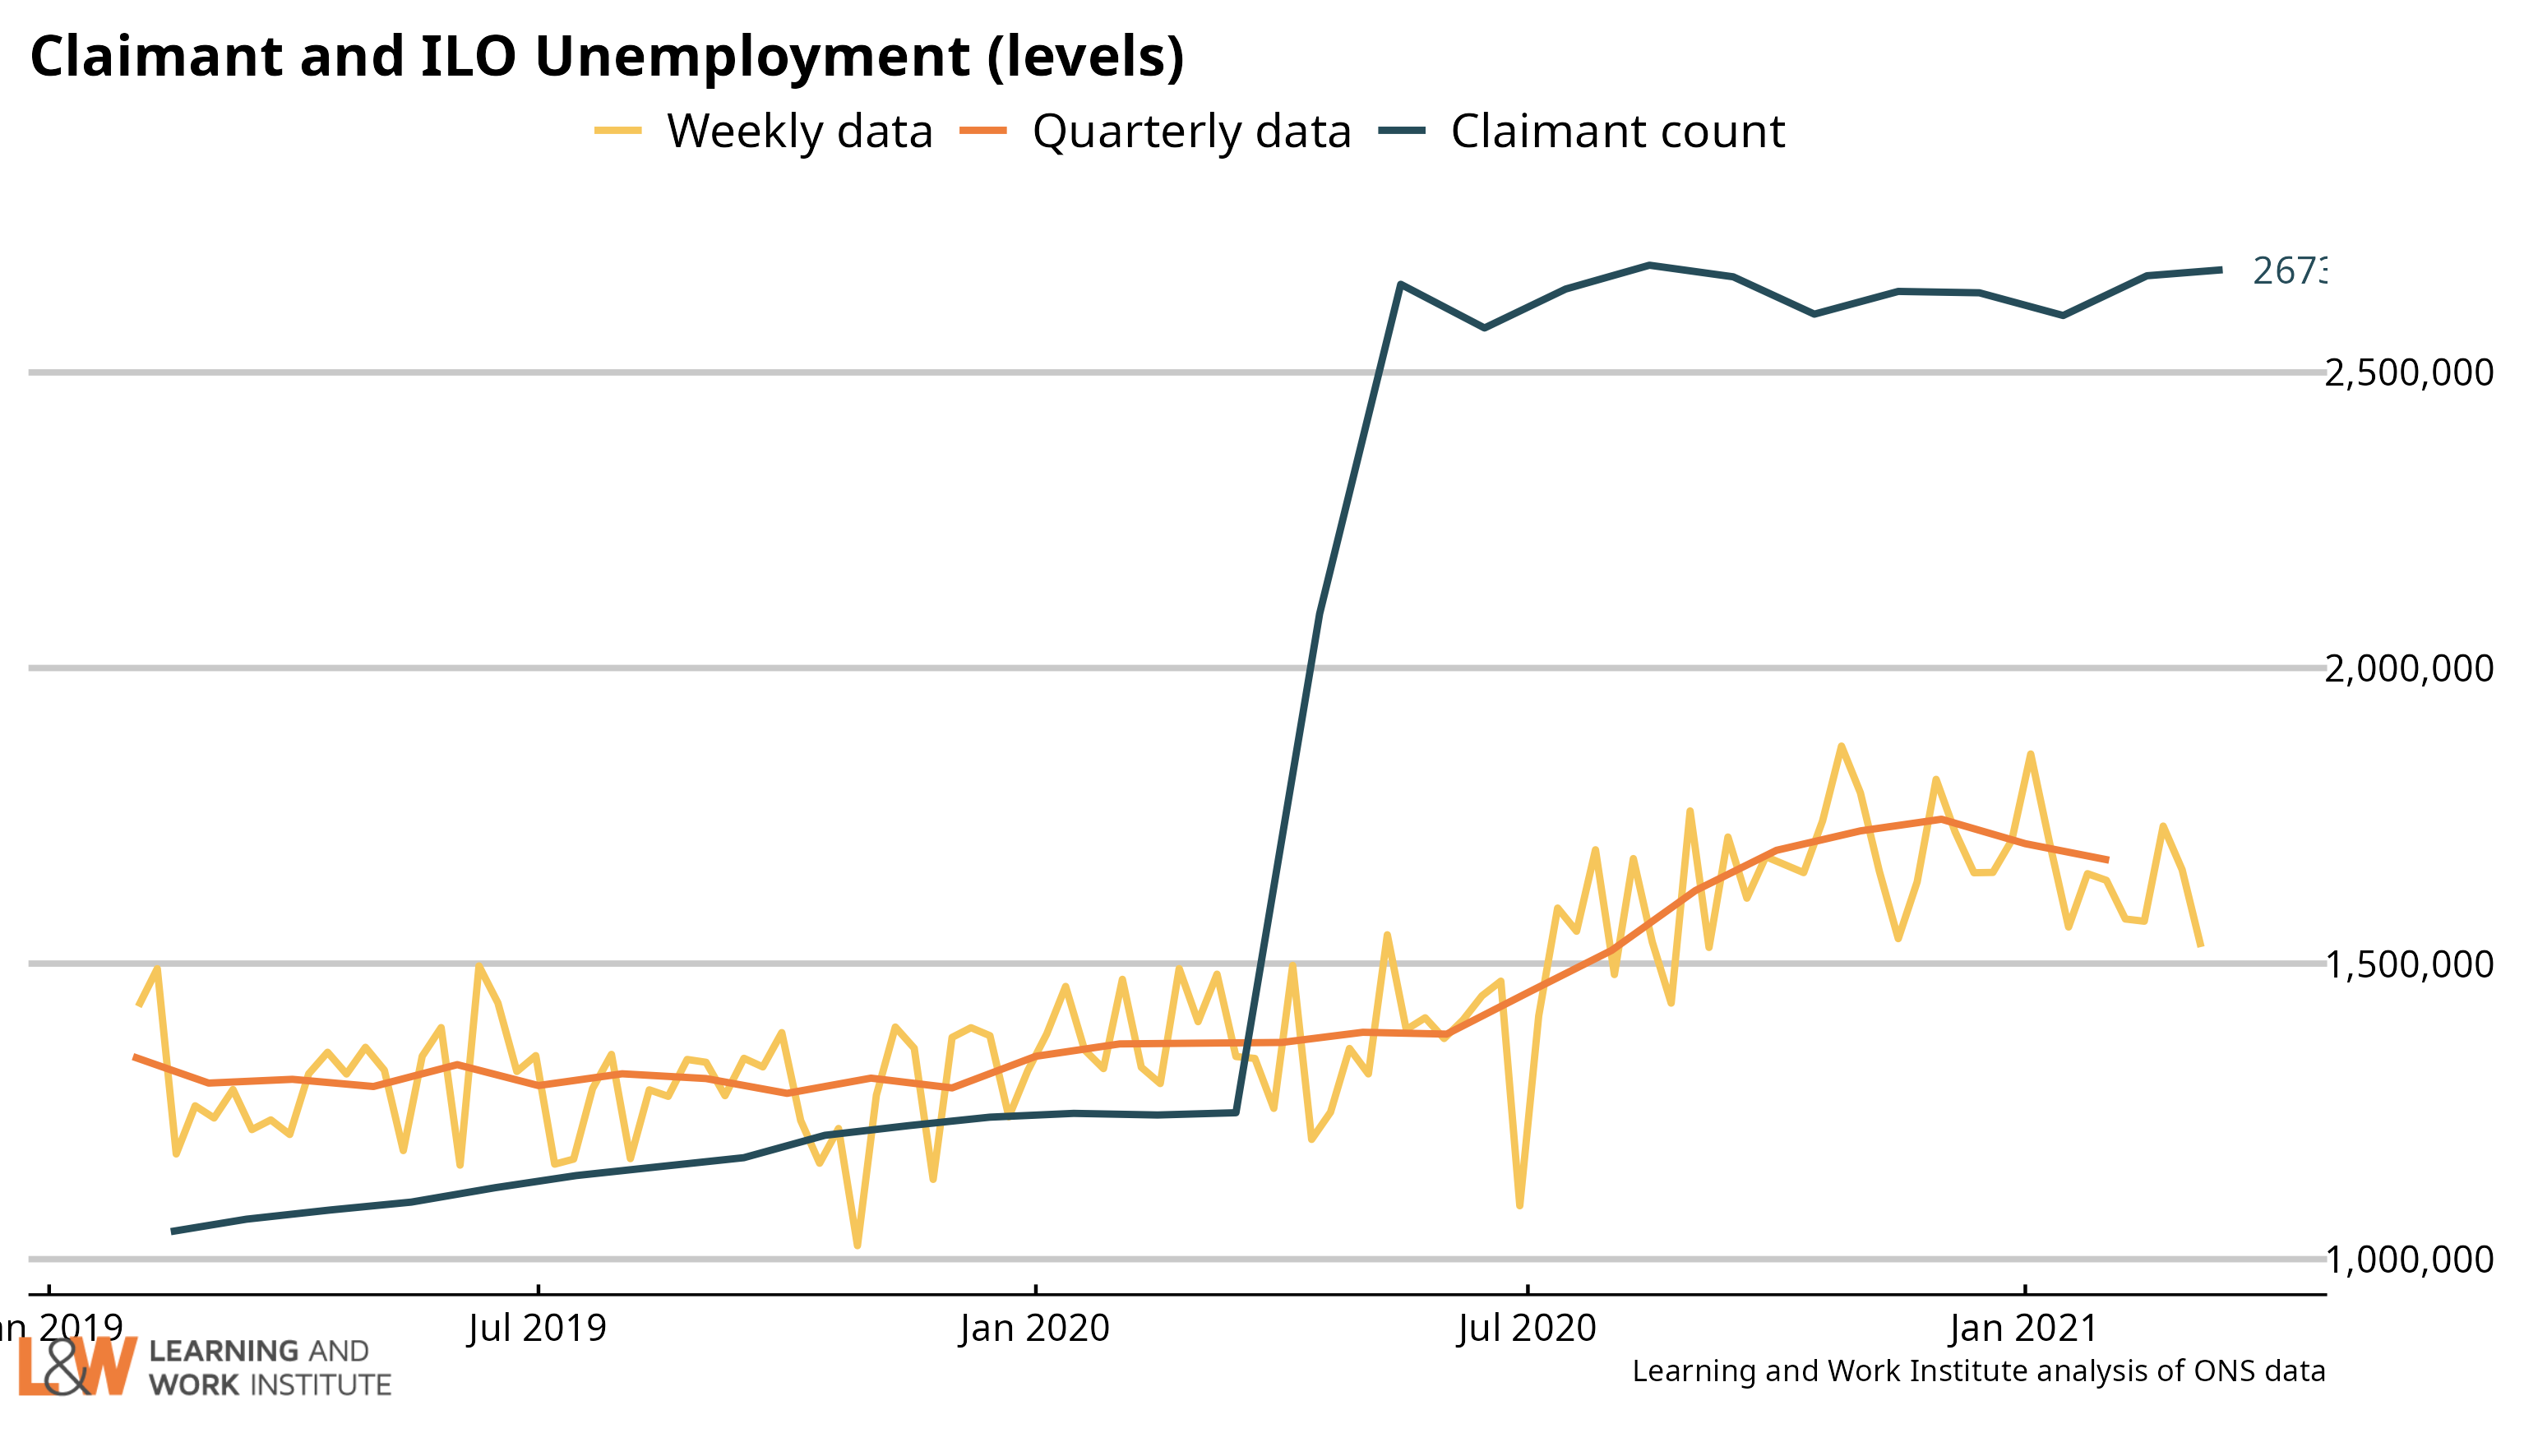 |
|
| Chart 3: Youth unemployment The number of unemployed young people fell by 7,000 since last month’s figures, to 575,000. Meanwhile, the number of young Universal Credit or Jobseeker’s Allowance claimants fell last month by 19,400, to 504,200. 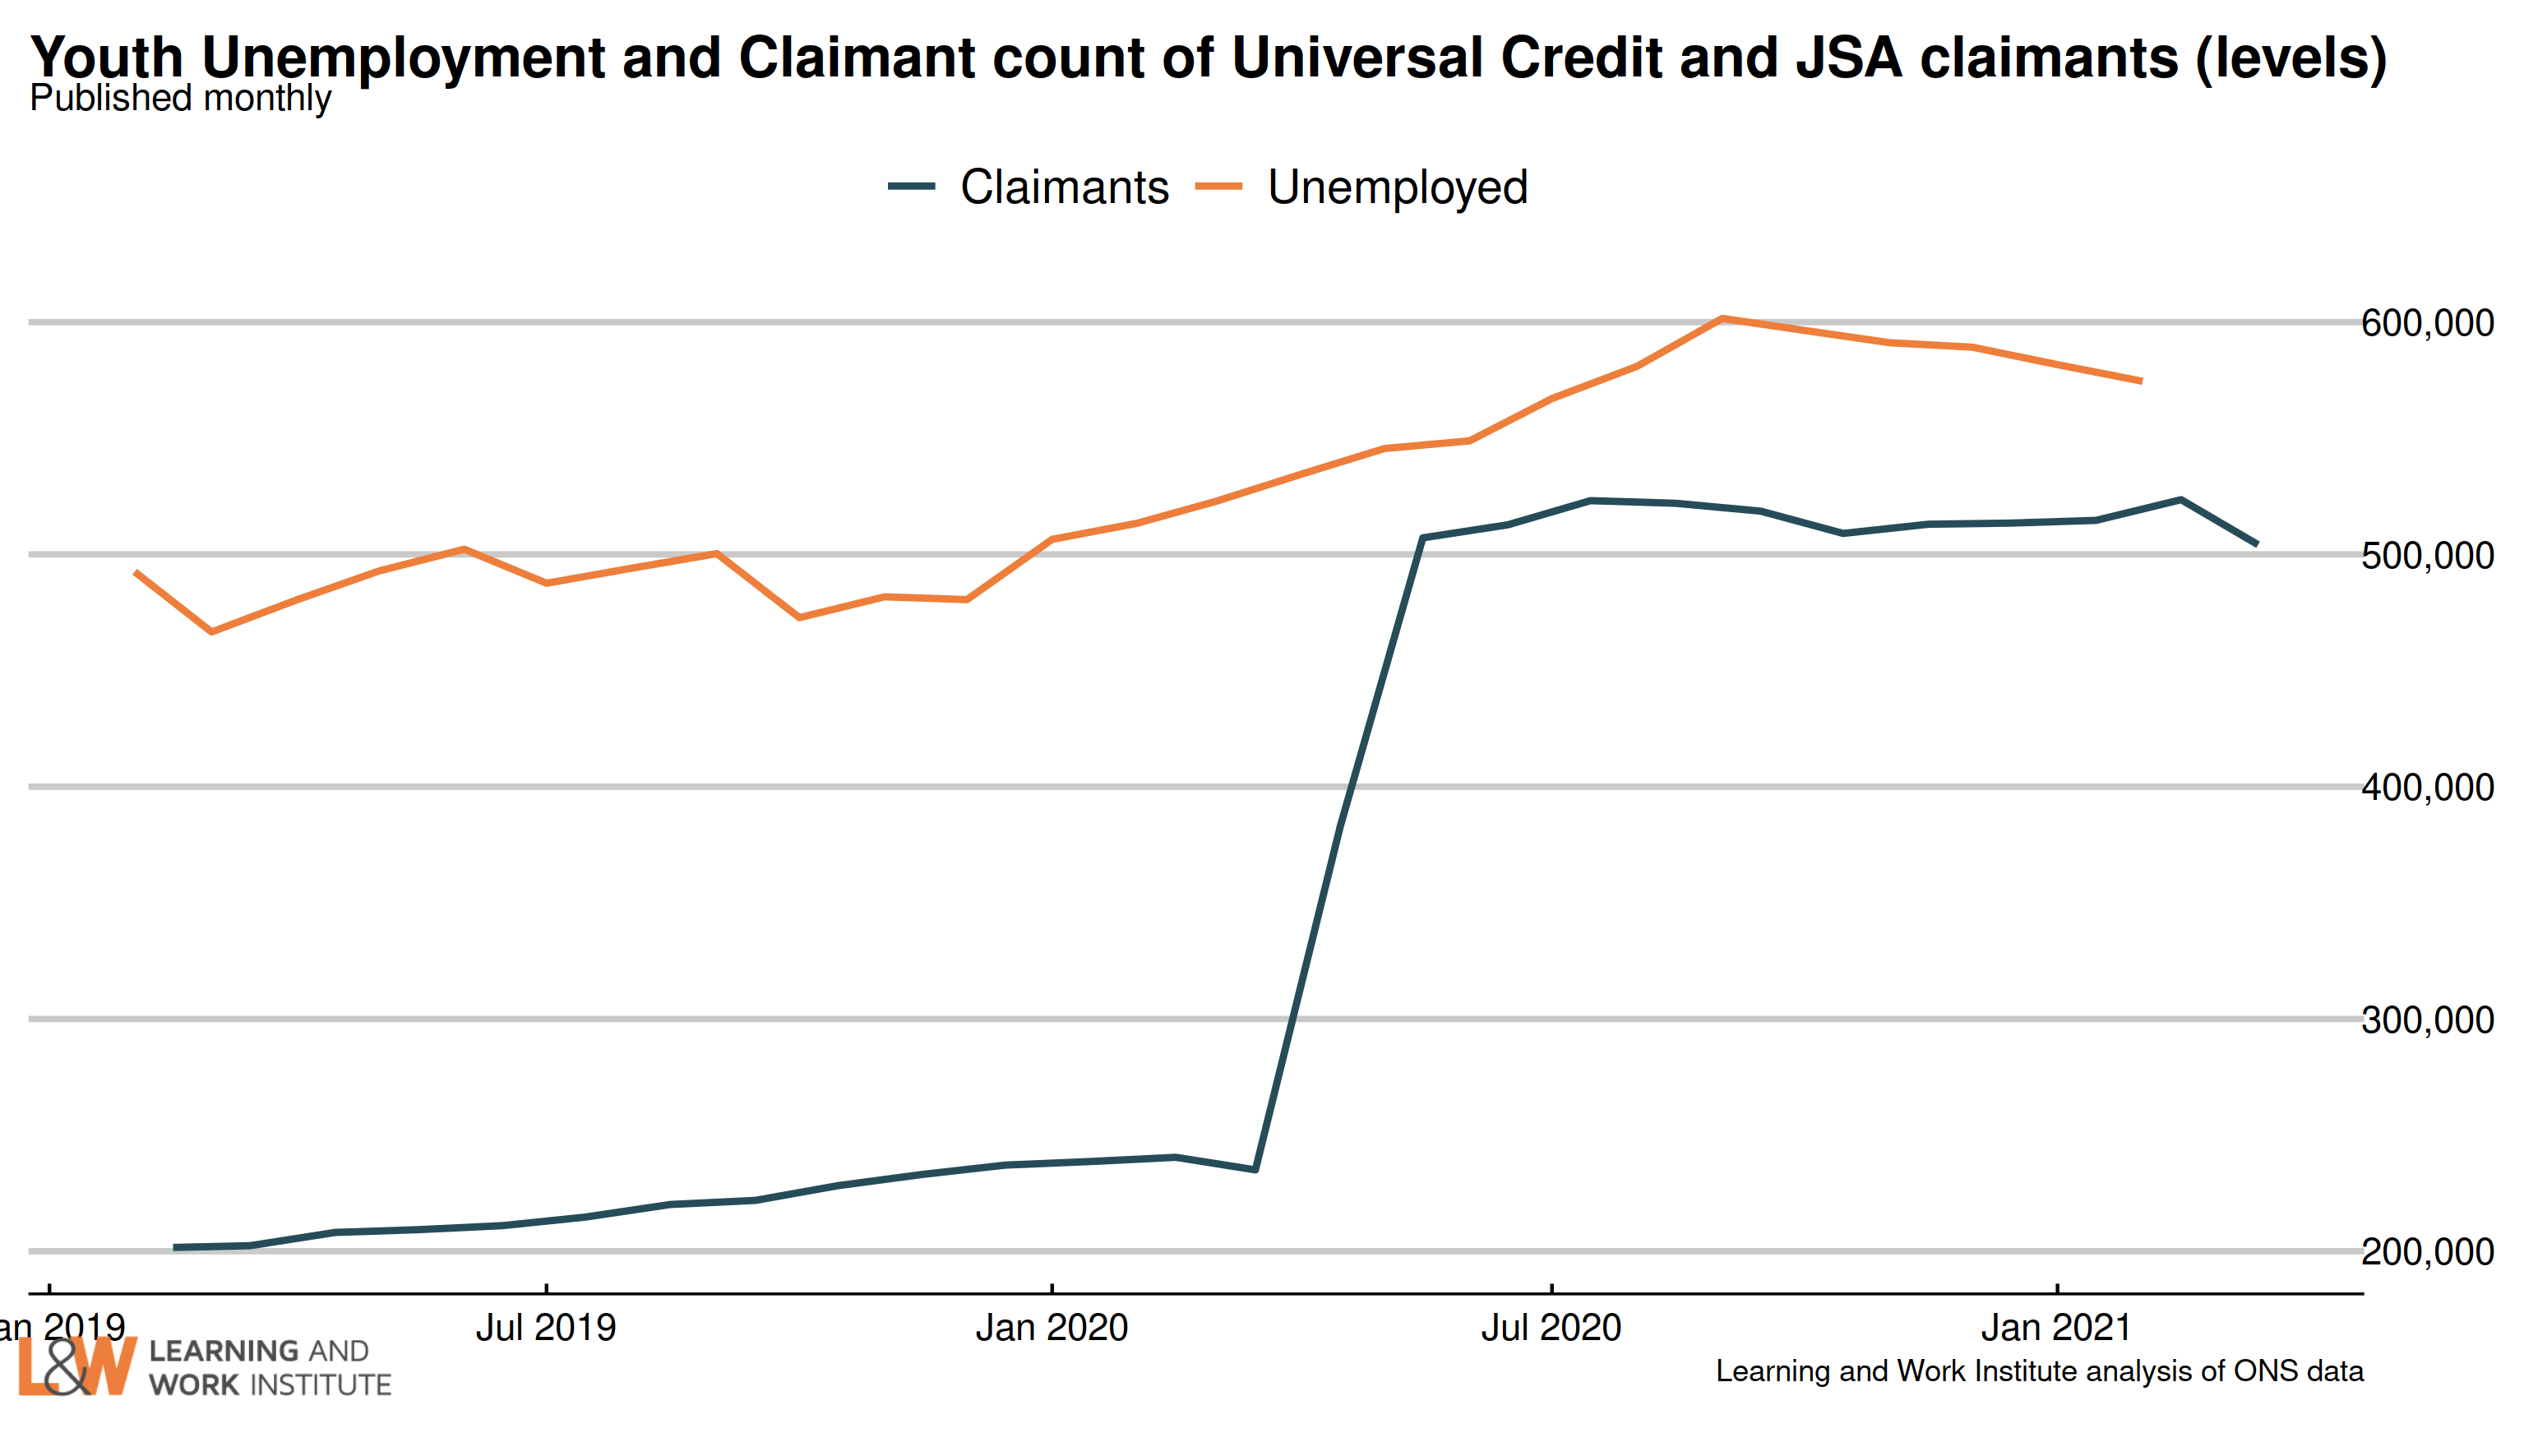 |
|
| Chart 4: Young people not in employment, full-time education or training The number of out of work young people who are not in full-time education (990,000) decreased by 11,000 in the last quarter, or 1.1%. The fall was among the unemployed, with the number of economically inactive young people not in full-time education or training rising. 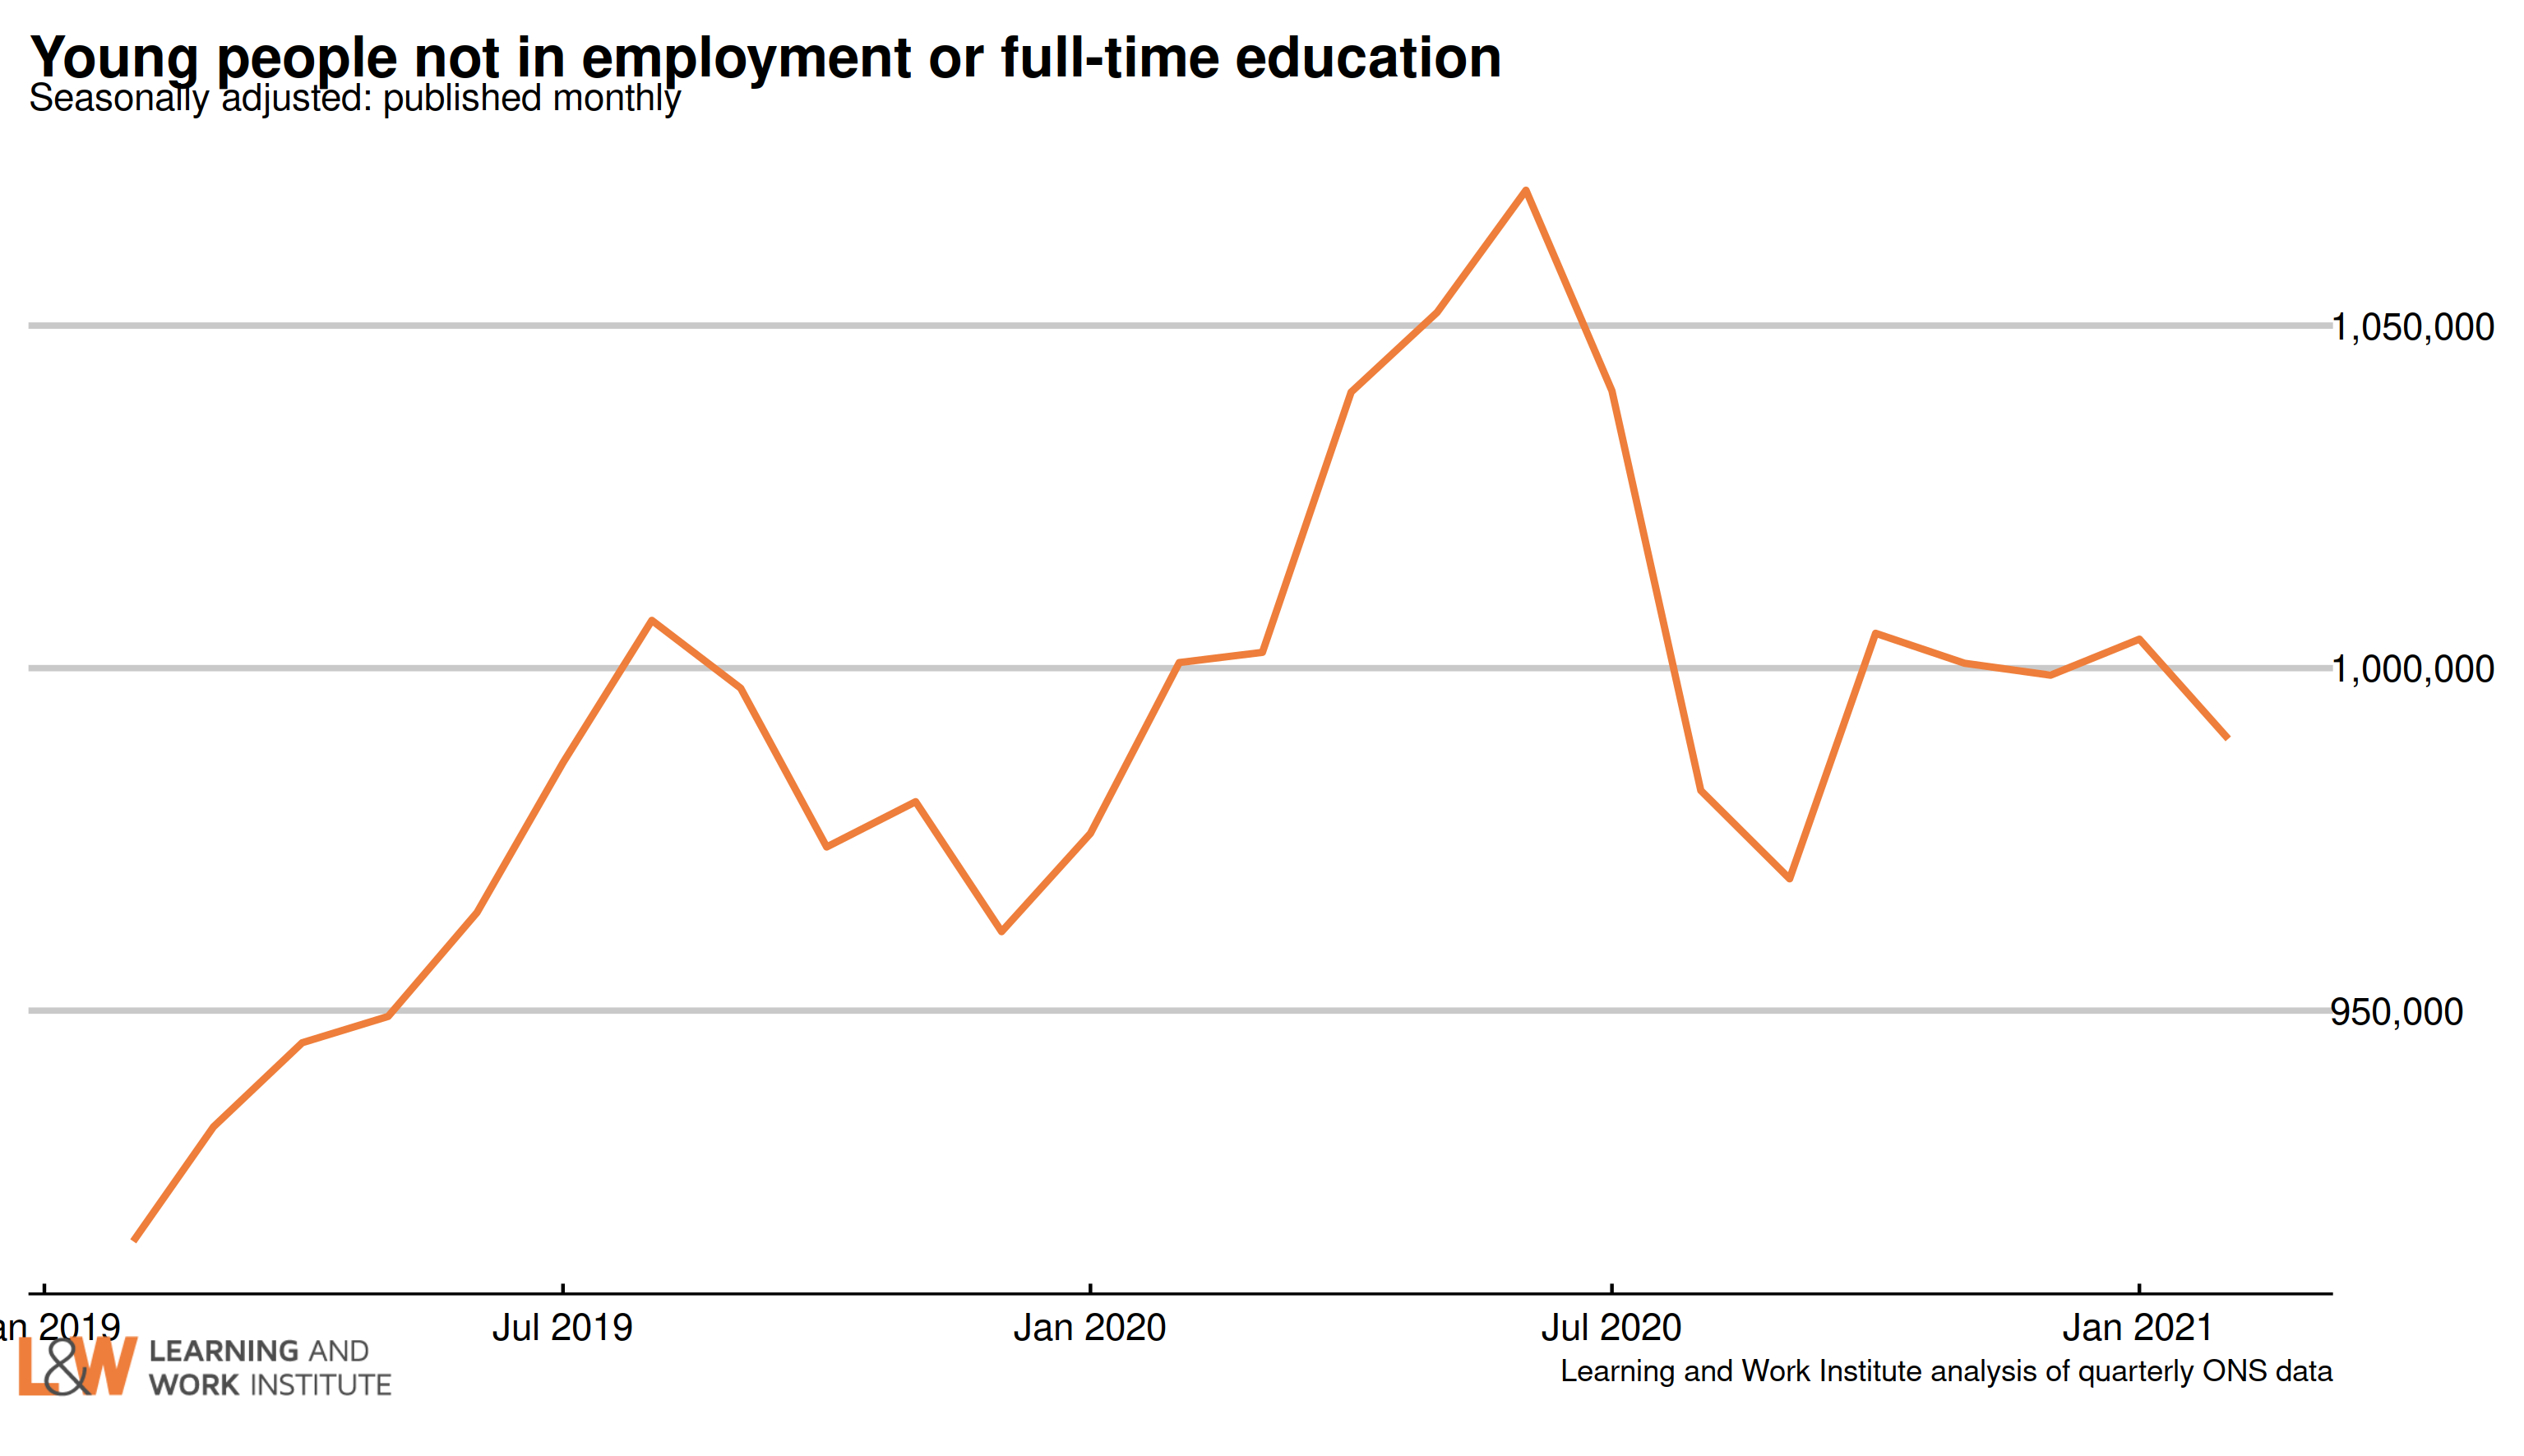 |
|
| Chart 5: Youth long-term unemployment (six months and over, 16-24) Youth long-term unemployment (which can include students) has risen by 30,000 over the last quarter and is now 220,000. 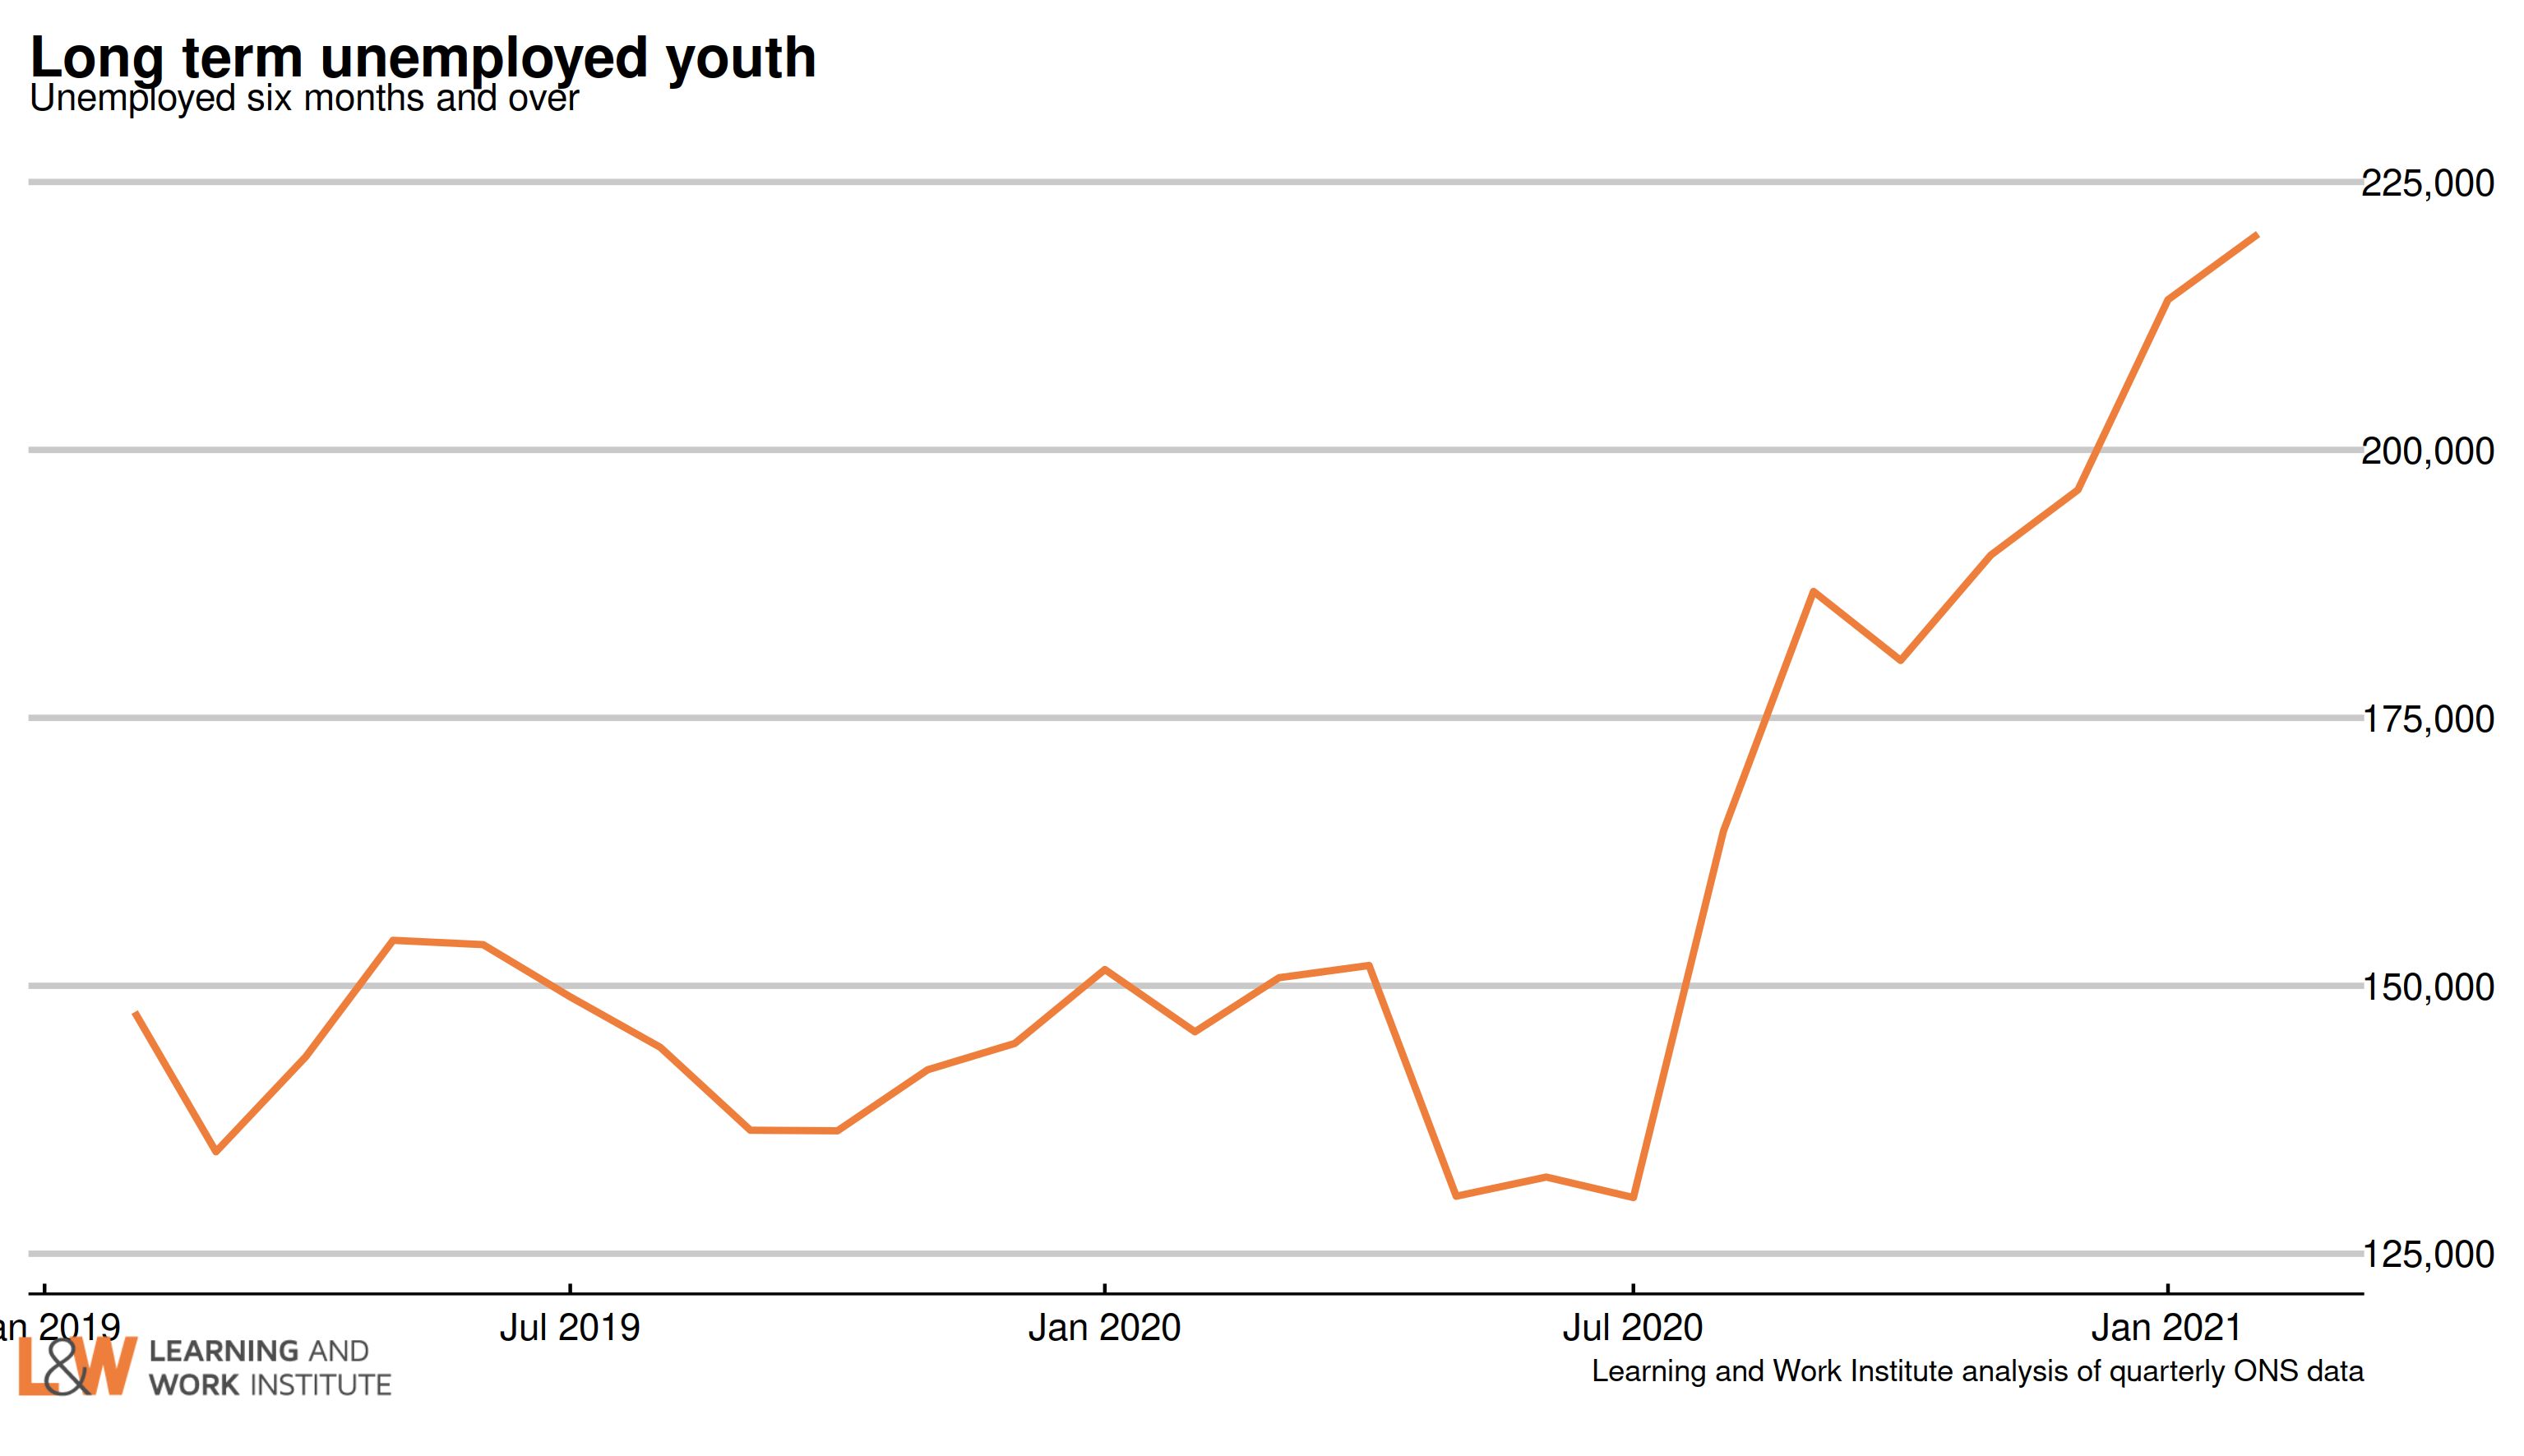 |
|
| Chart 6: Adult long-term unemployment (12 months and over, 25+) Adult long-term unemployment on the survey measure is now 261,000, up 0.1% on the previous quarter, and 9.8% on a year before. Those who lost their jobs with the first lockdown are not yet in these figures, though by now they will have passed the 12-month threshold. The fall in long-term unemployment numbers in the first lockdown period of 2020 (April to June 2020) could be due to long-term unemployed people stopping looking for work at that time. Later, they then resumed looking for work and may have counted their unemployment from when they lost their job, missing out the lockdown period, if so they would have come back into the figures. 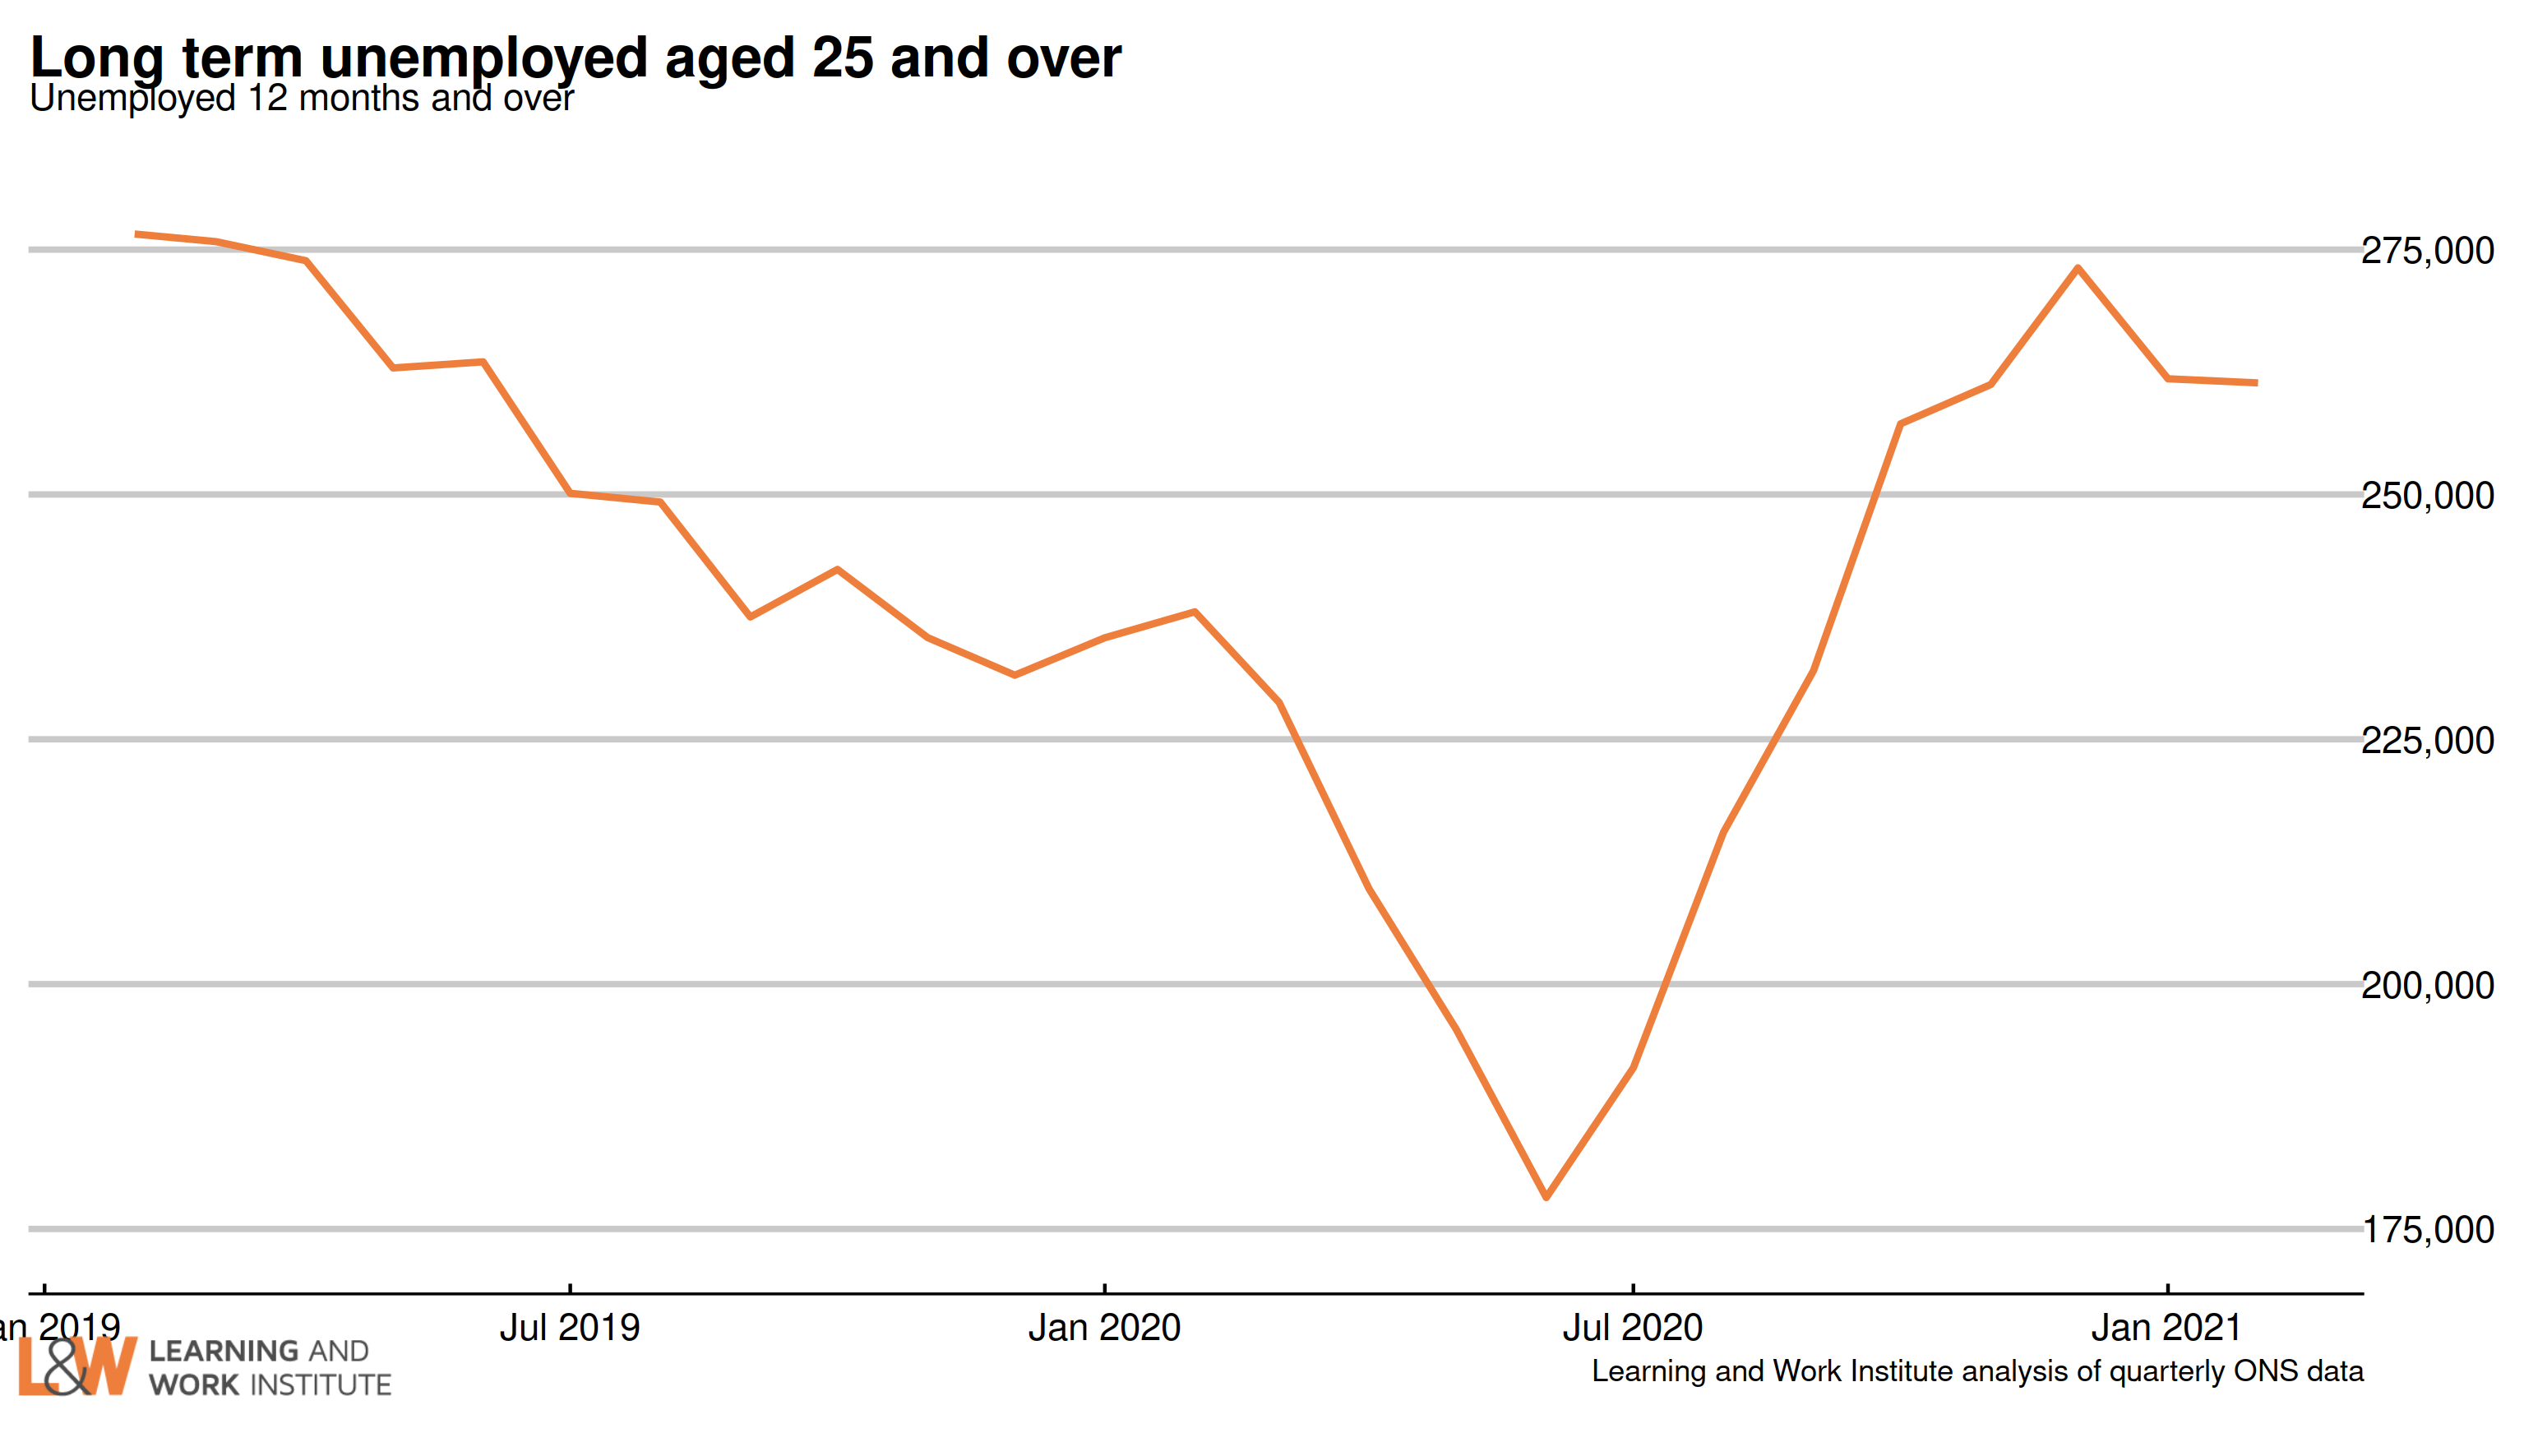 |
|
| Chart 7: Unemployment rates by age The 18 to 24 year old unemployment rate (including students) is 12.8% of the economically active – excluding over one million economically inactive students from the calculation. The rate for those aged 25 to 49 is 3.5%. For those aged 50 and over it is 3.9%. In the quarter, there was a fall of 0.4 percentage points for 18 to 24 year olds, and a rise of 0.3 percentage points for 25 to 49 year olds, and a rise of 0.1 percentage points for the over-50s. 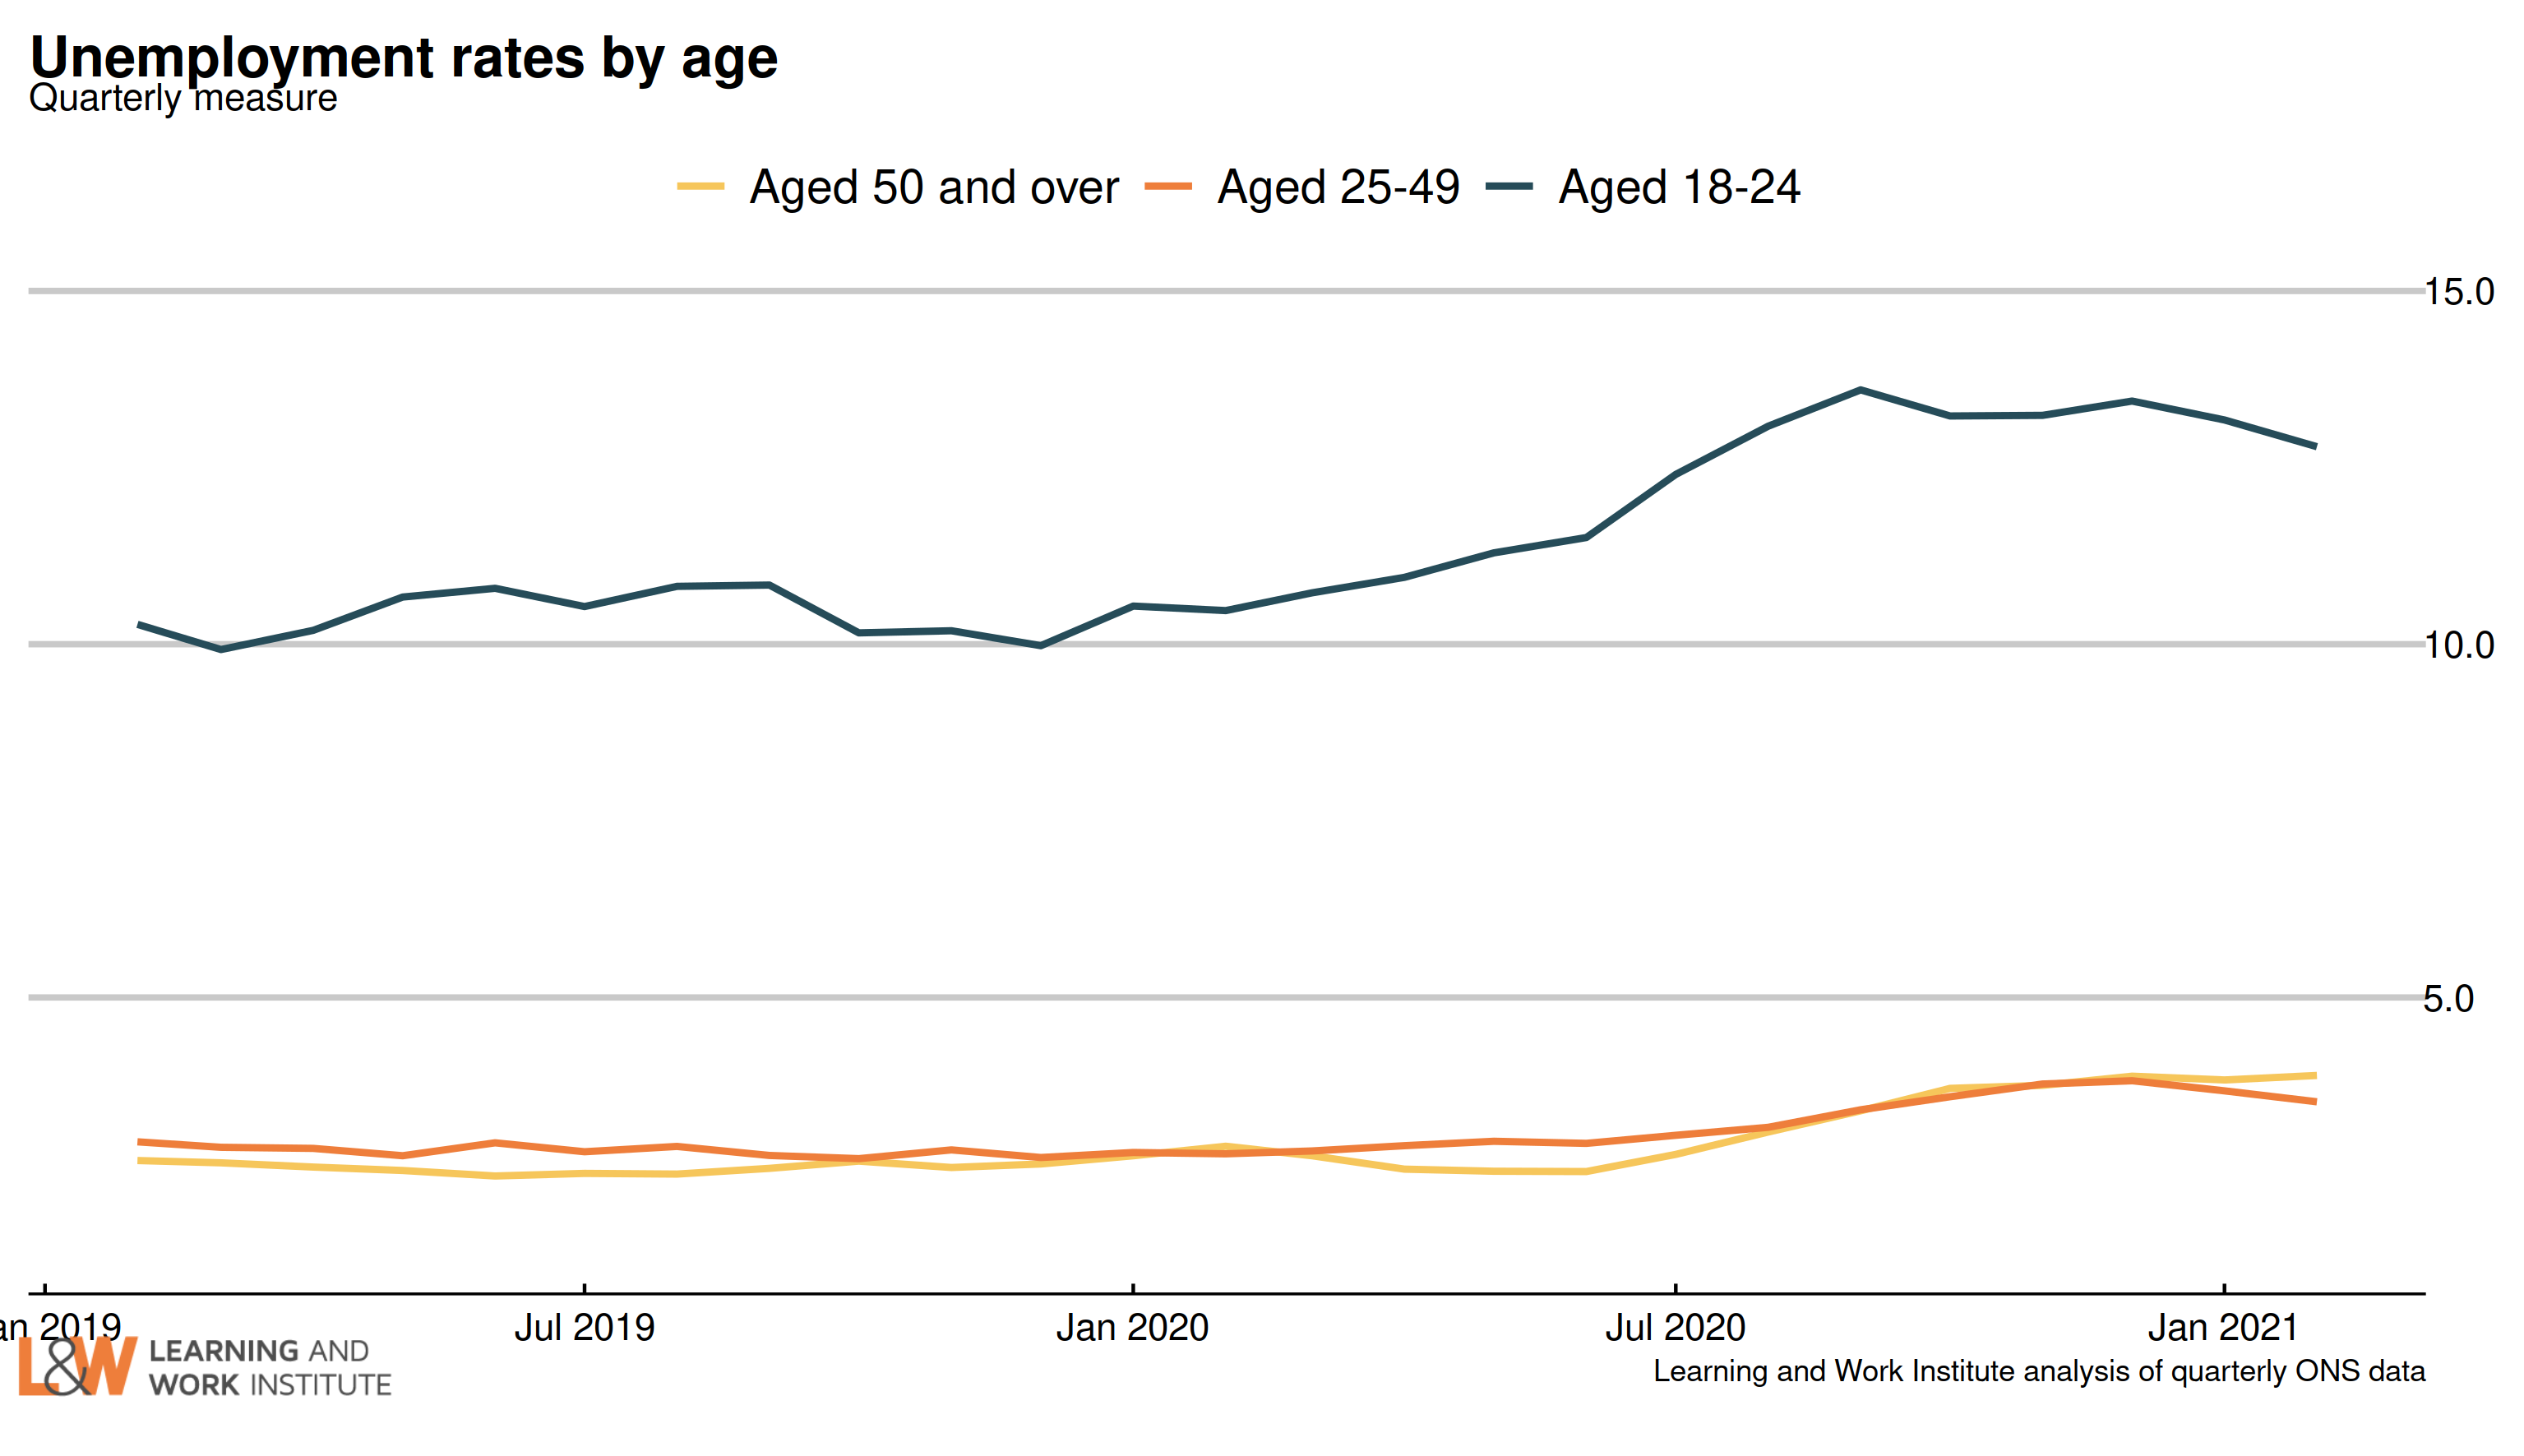 |
|
| Chart 8: Unemployment rate changes by age (counting February 2020 as 100) The 18 to 24 year old unemployment rate (including students) is 2.3 percentage points higher than in February 2020. The change for those aged 25 to 34 is 0.5. The change for those aged 35 to 49 is 0.9. The change for those aged 50 to 64 is 1.1 The change for those aged over 65 is 0.1. 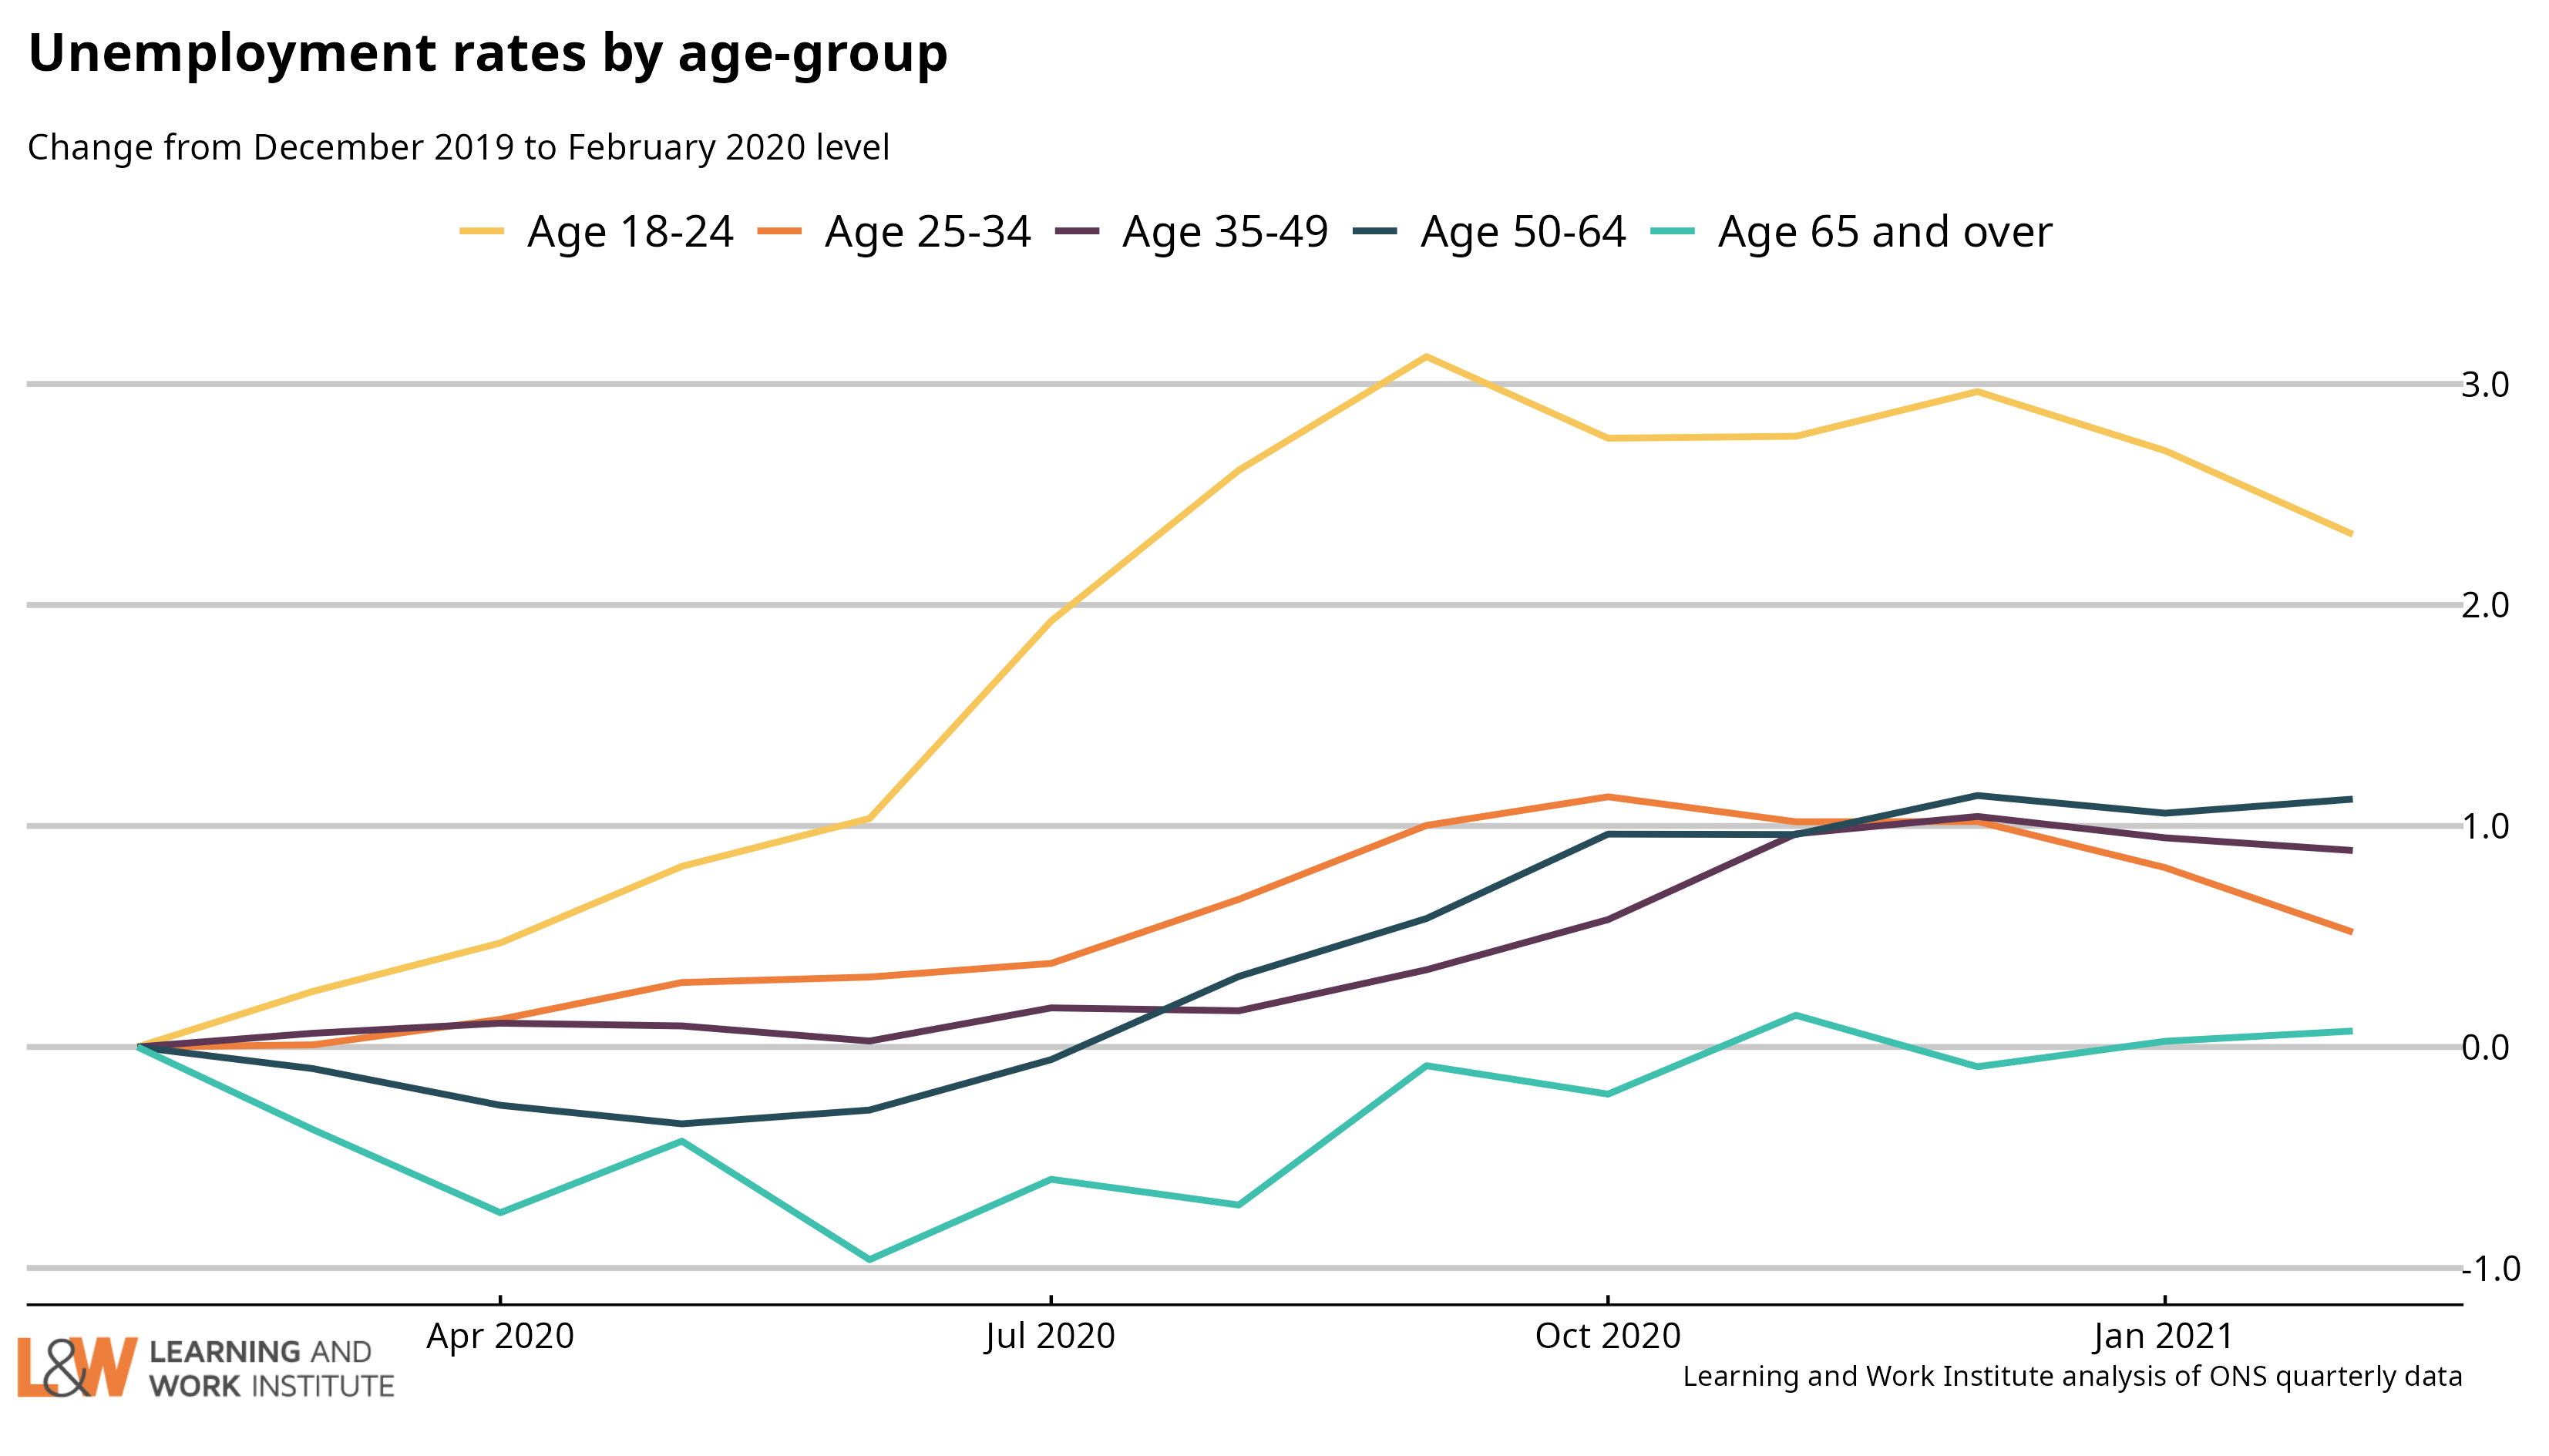 Chart 9: Vacancies – whole economy survey Headline vacancies this month rose by 8,000 to 607,000. The ONS' experimental single-month vacancy figures increased by 81,000 in the last quarter. The headline ONS vacancy figure is both seasonally adjusted and a three-month average. The chart shows both series. 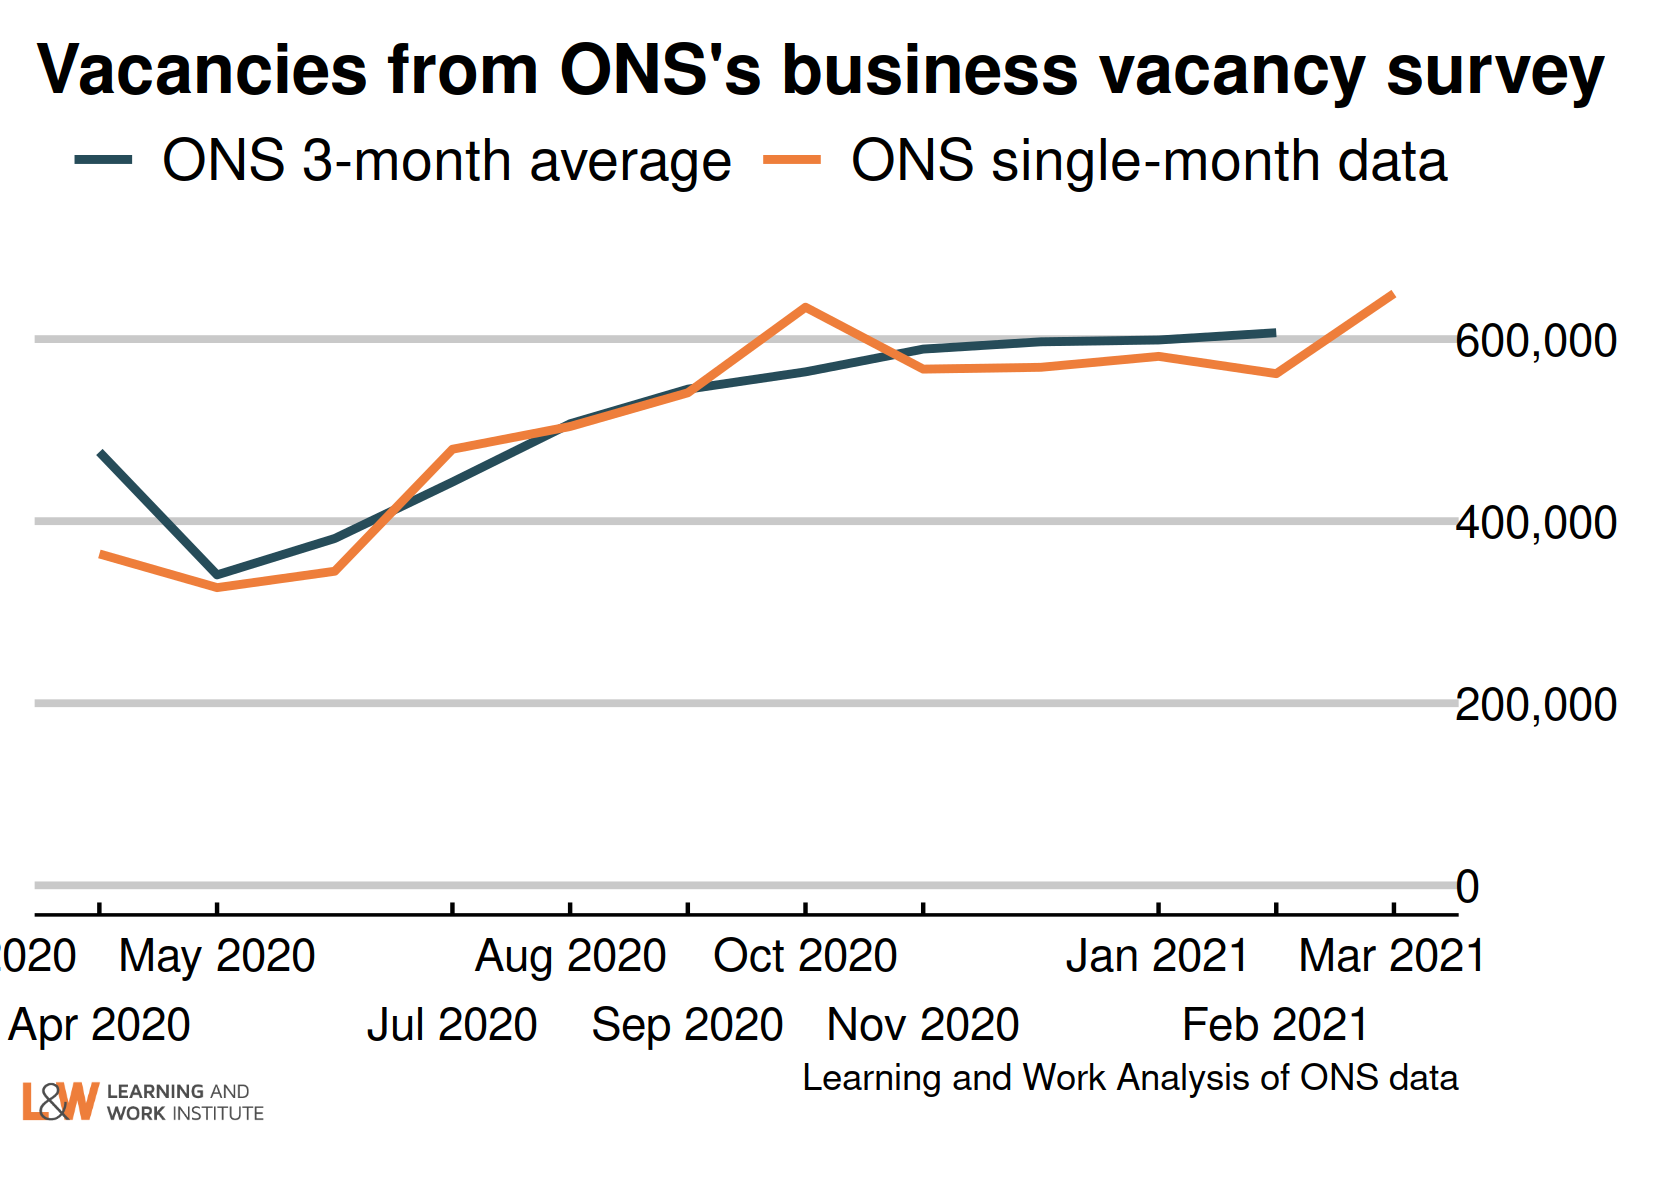 |
|
| Chart 10: Experimental single month vacancies – whole economy survey The Office for National Statistics experimental single month vacancy estimates include sectoral information. As these are not seasonally adjusted, it is better to look at annual changes. The numbers are thousands of vacancies, under each number, and on the right, the annual change in thousands of vacancies. 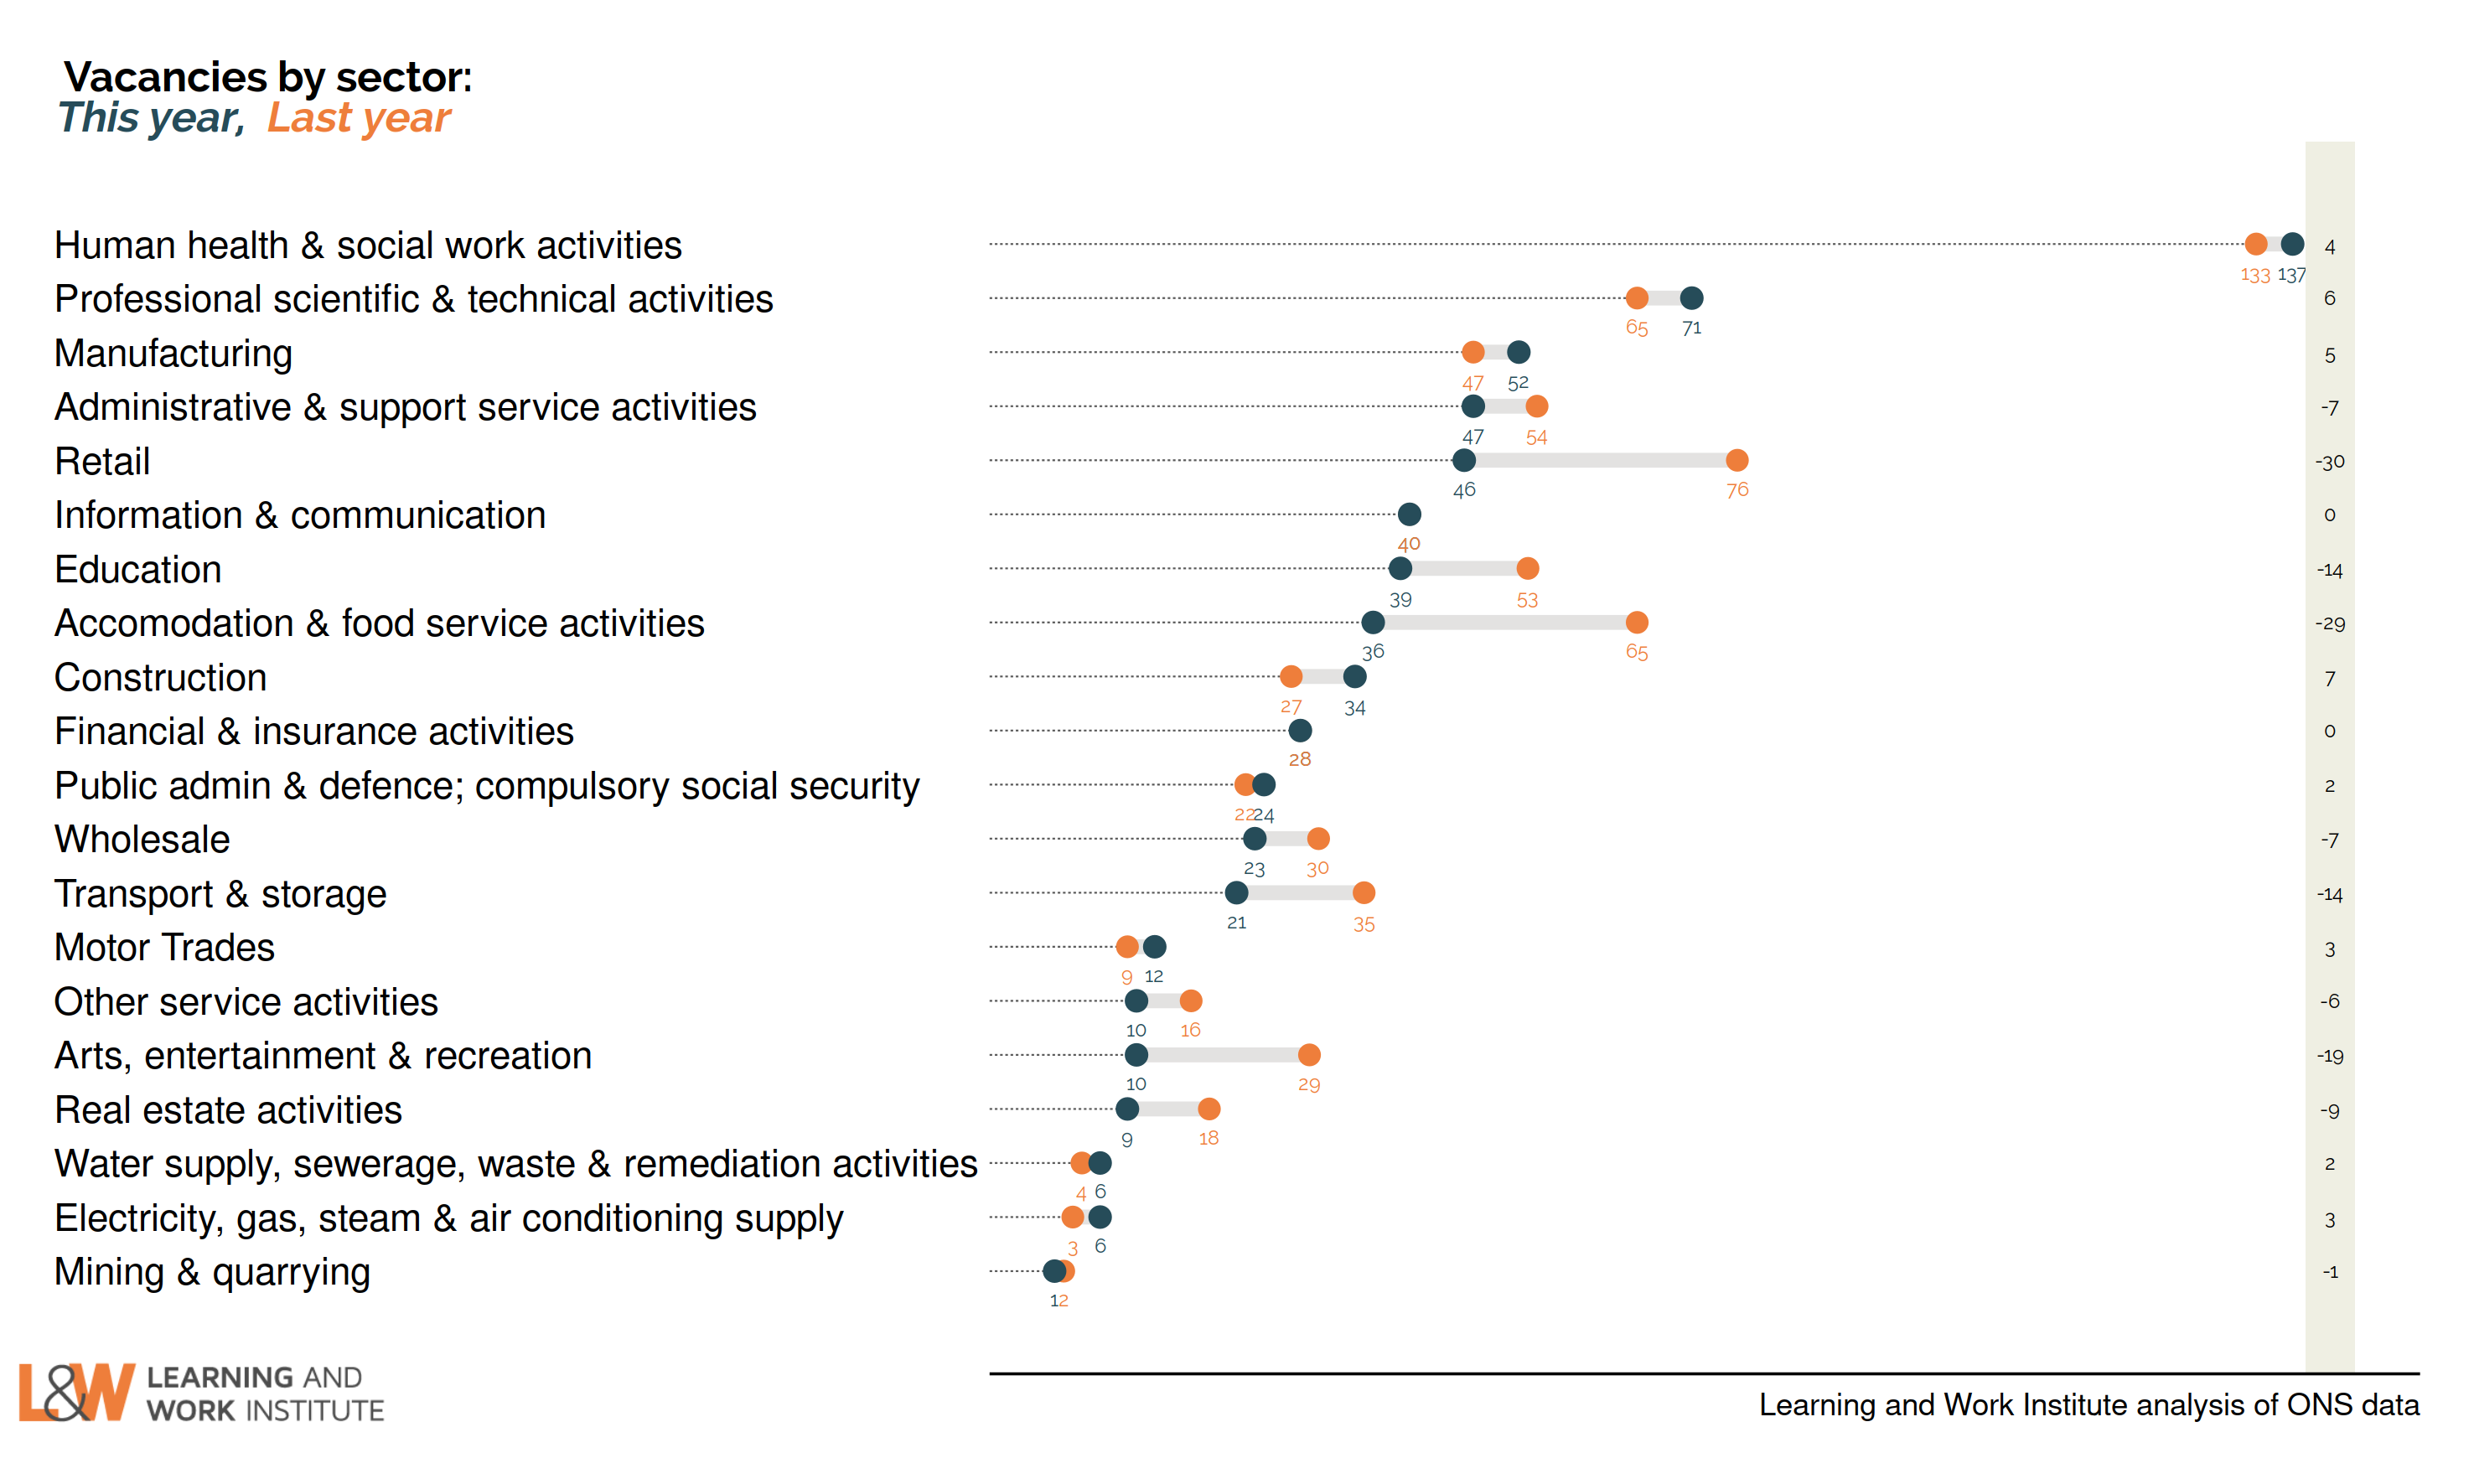 |
|
| Chart 11: Unemployed people per vacancy There are 2.8 unemployed people per vacancy. This has fallen back as the number of vacancies has risen, despite increasing numbers of unemployed. 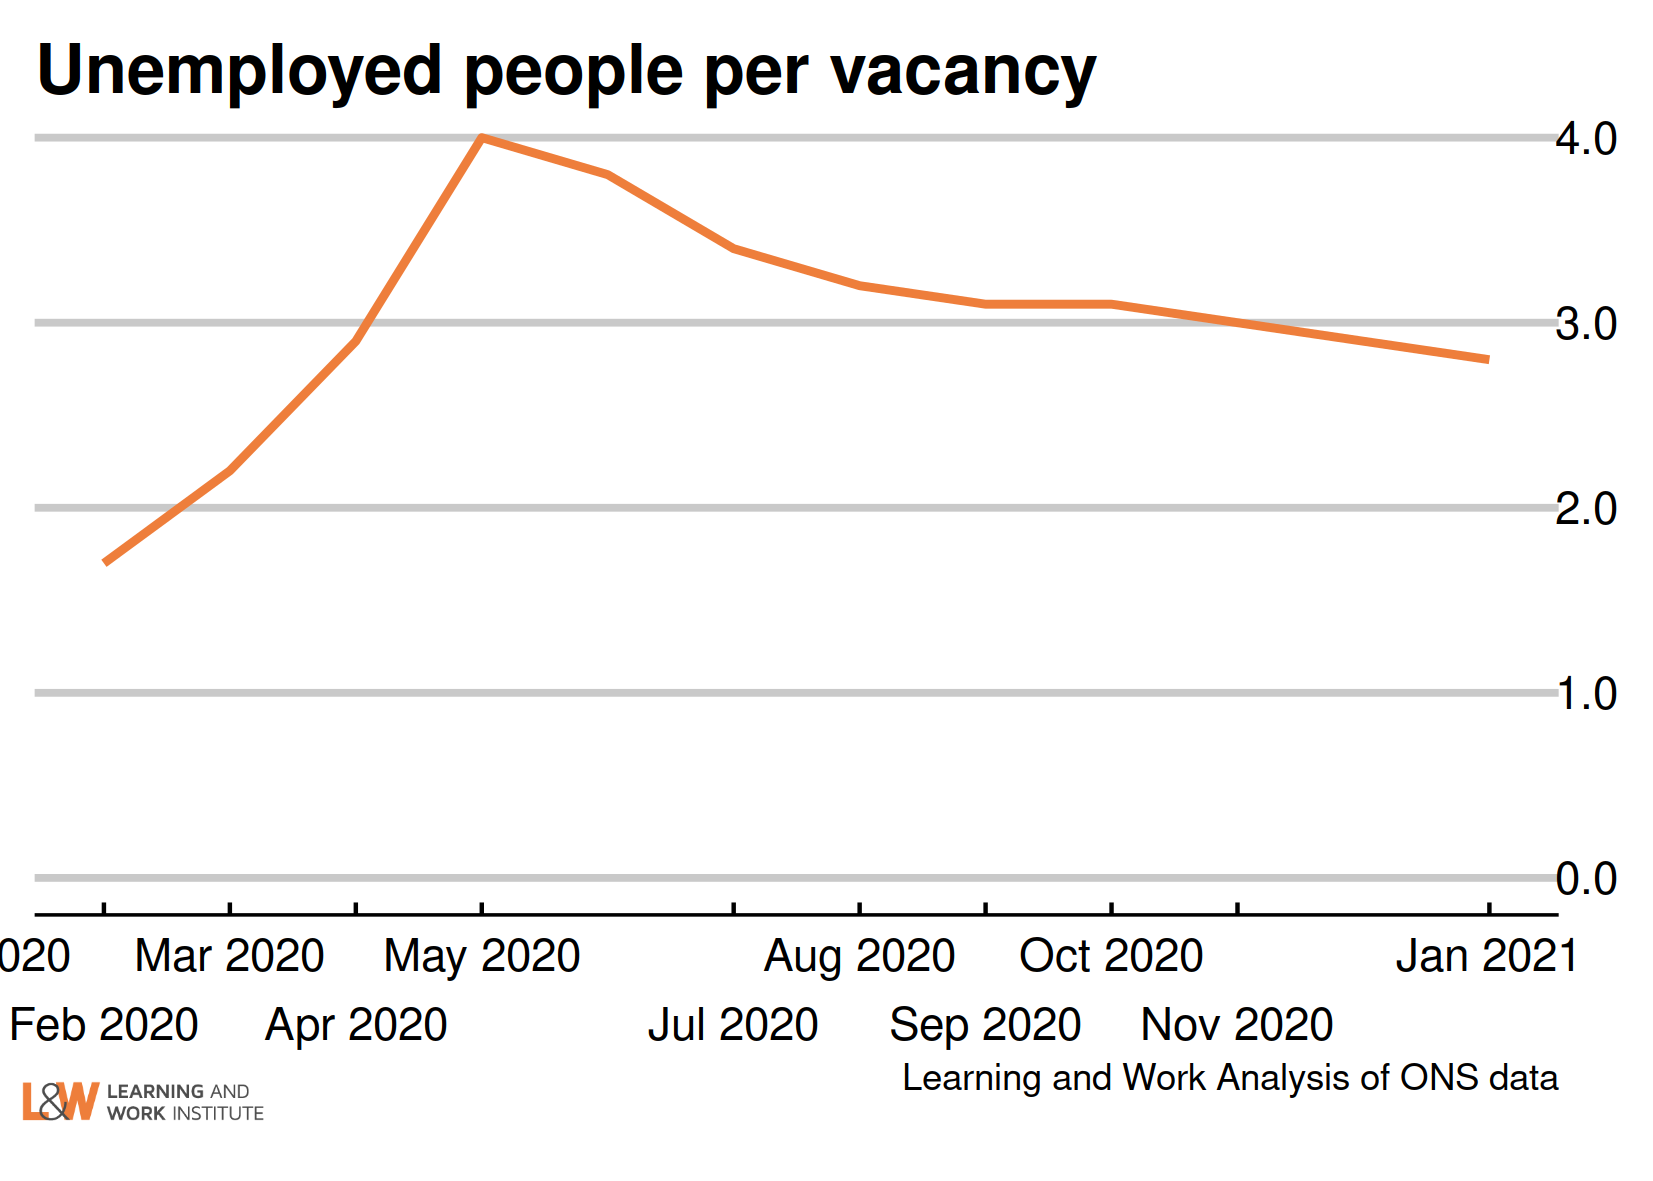 |
|
| Chart 13: Online vacancies to early March from Adzuna Job vacancies dropped to below half of the 2019 average following lockdown. ONS analysis suggests that it was this reduced hiring that led to falls in employment, rather than increased job loss. There has been a gradual increase as the lockdown has eased, and the number of online vacancies captured by Adzuna at the start of April has now reached February 2020 levels. 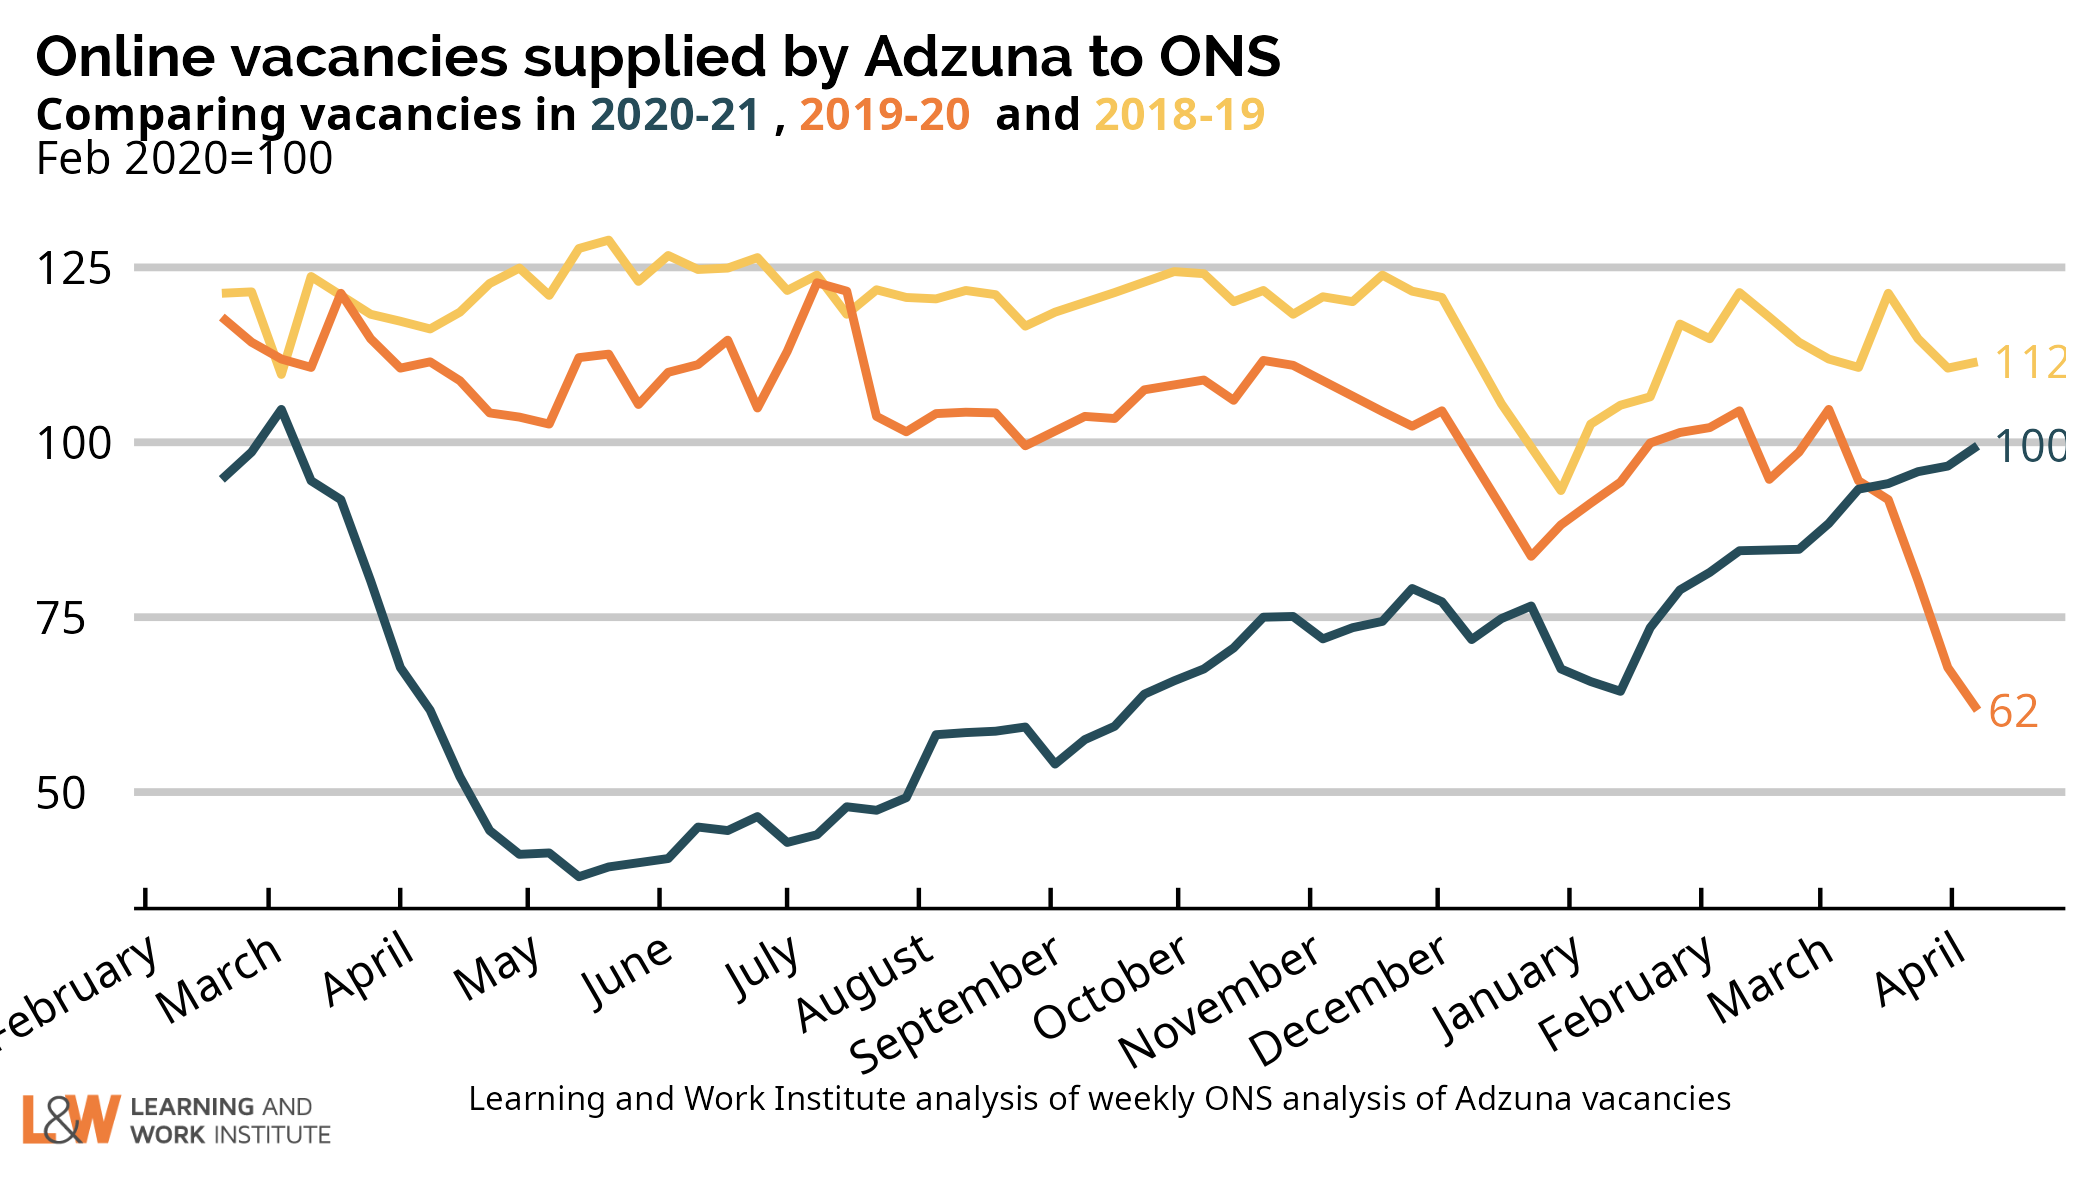 |
|
| Chart 14: UK employment Employment has risen by 56,000 on the figure published last month, to 32,430,000. The chart shows both the official figures and the experimental weekly figures. The trend is likely to be upwards, with employers planning for the March initial reopening in the last weeks of February. 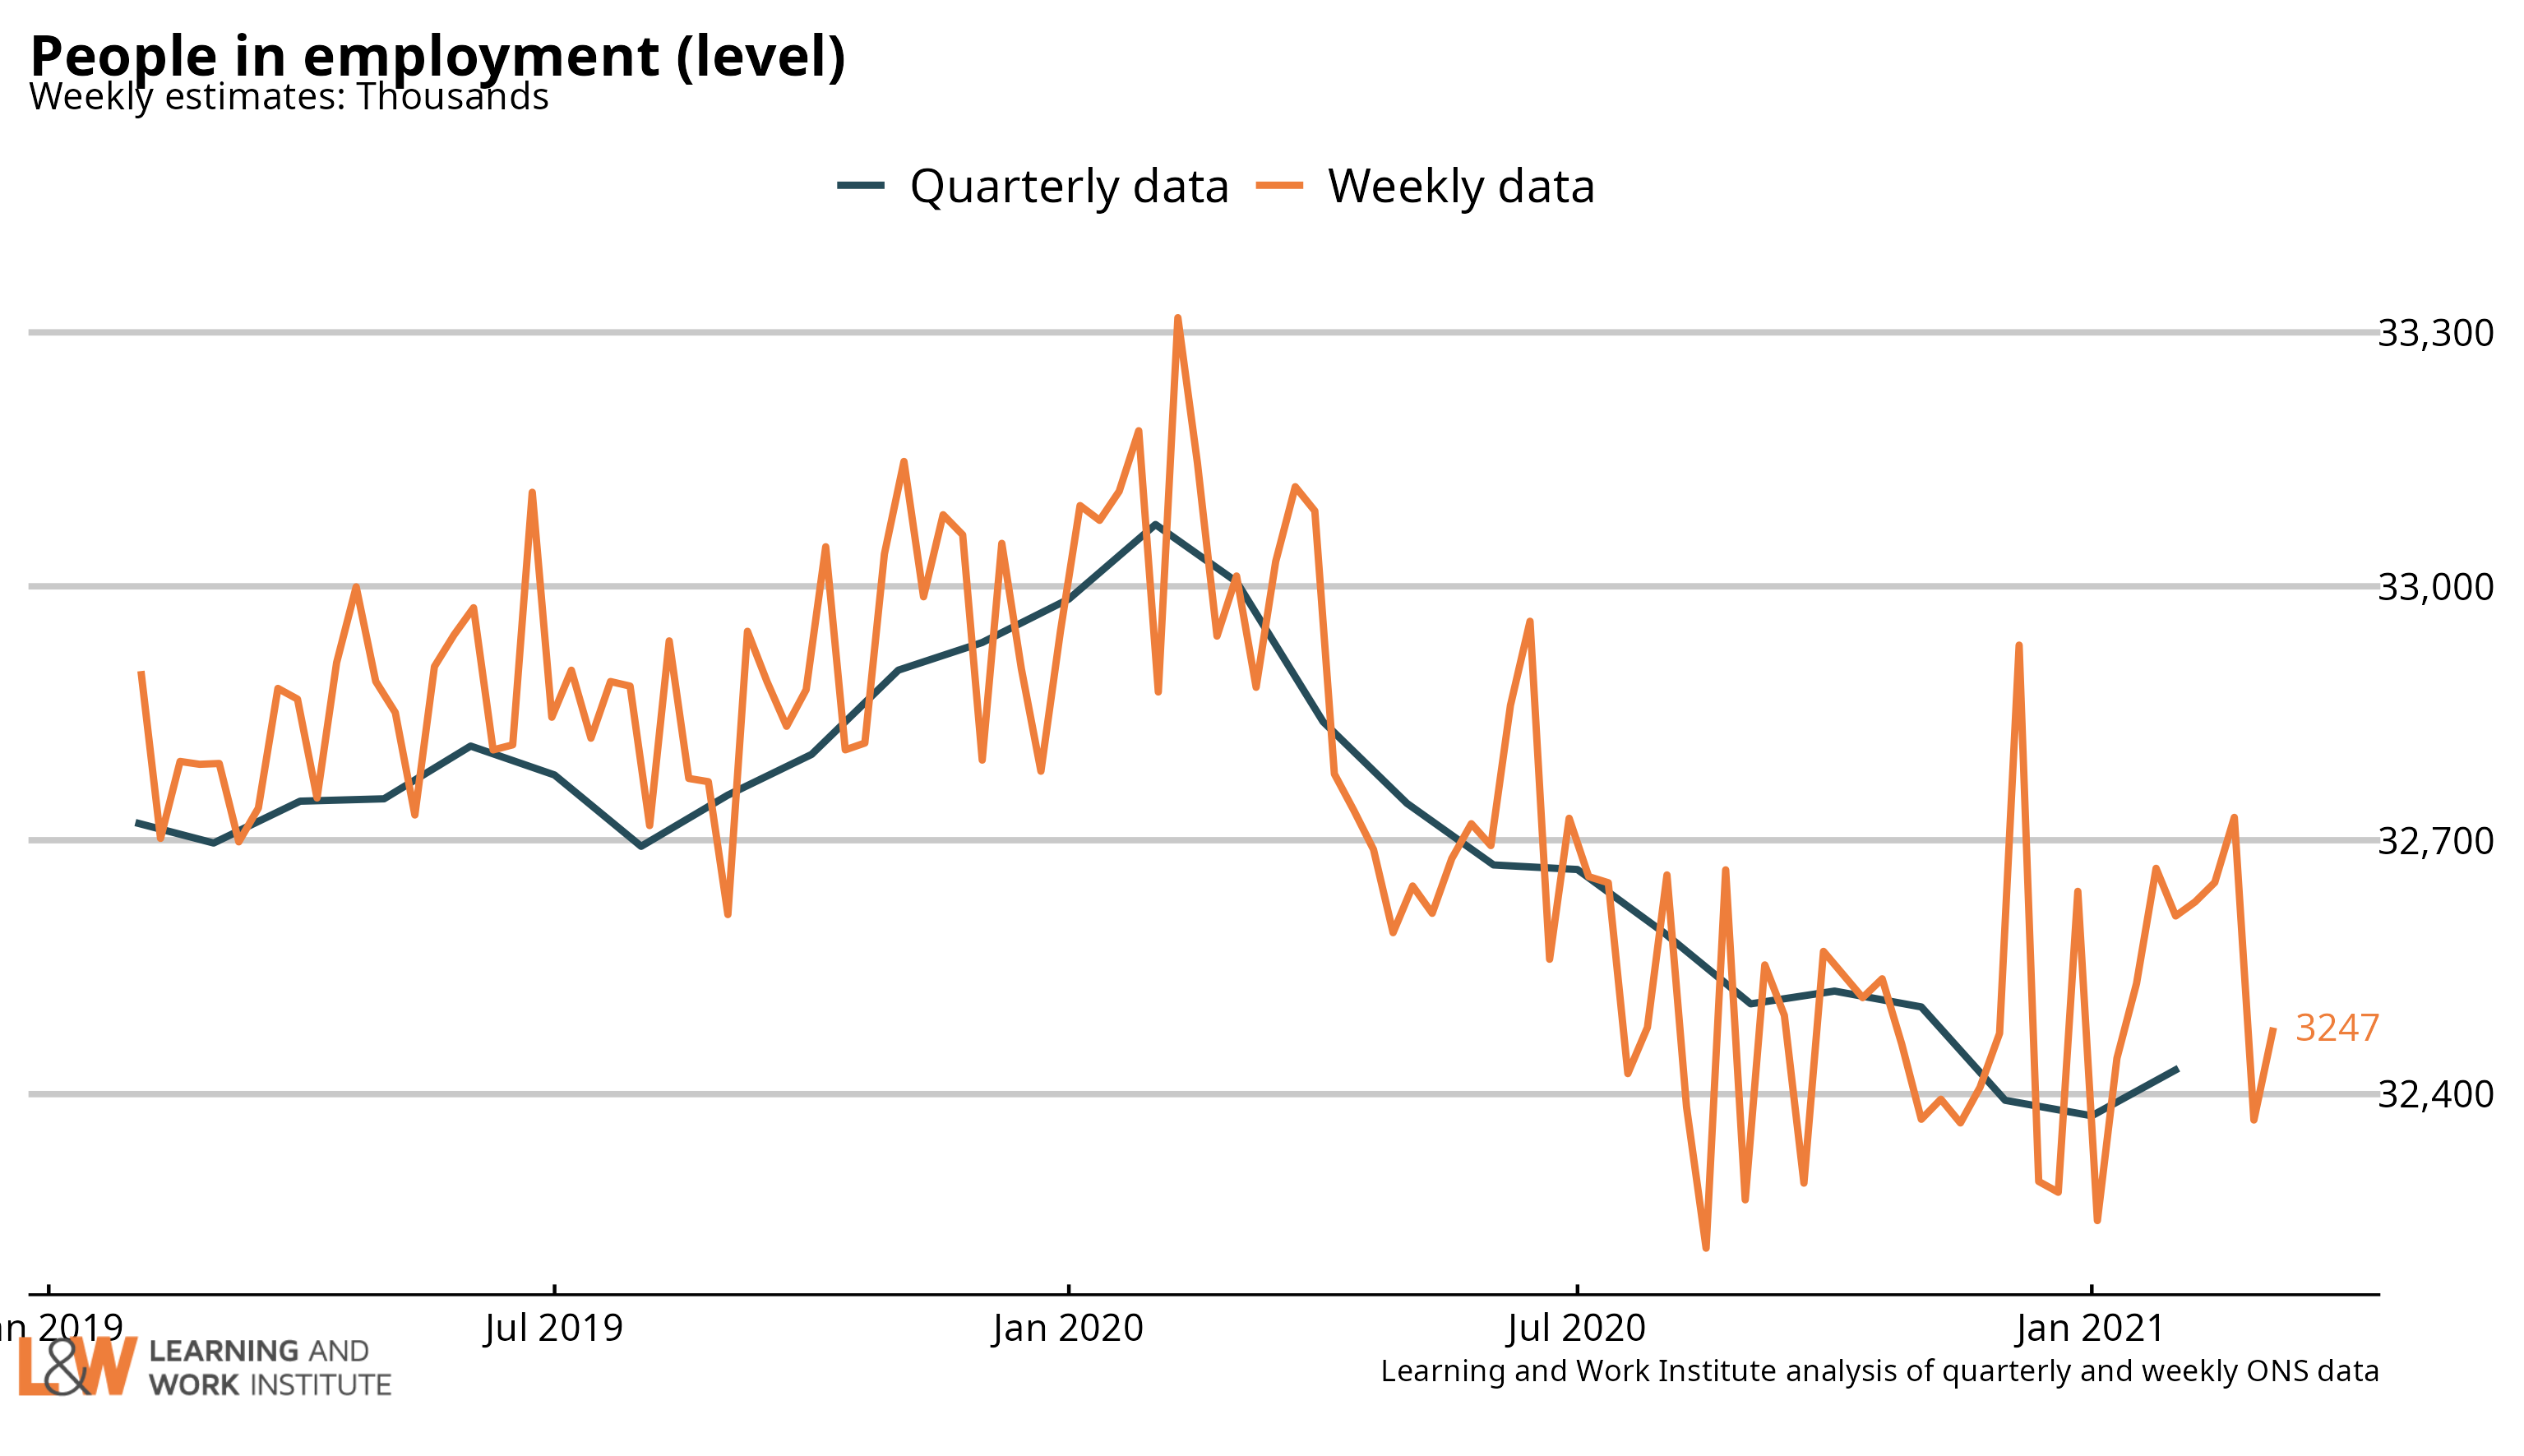 |
|
| Chart 15: Employment rate in the UK The quarterly change in the employment rate showed a fall of 0.1 percentage points, to 75.1%. The chart shows both the official figures and the experimental weekly figures. The trend is likely to be upwards due to reopenings. 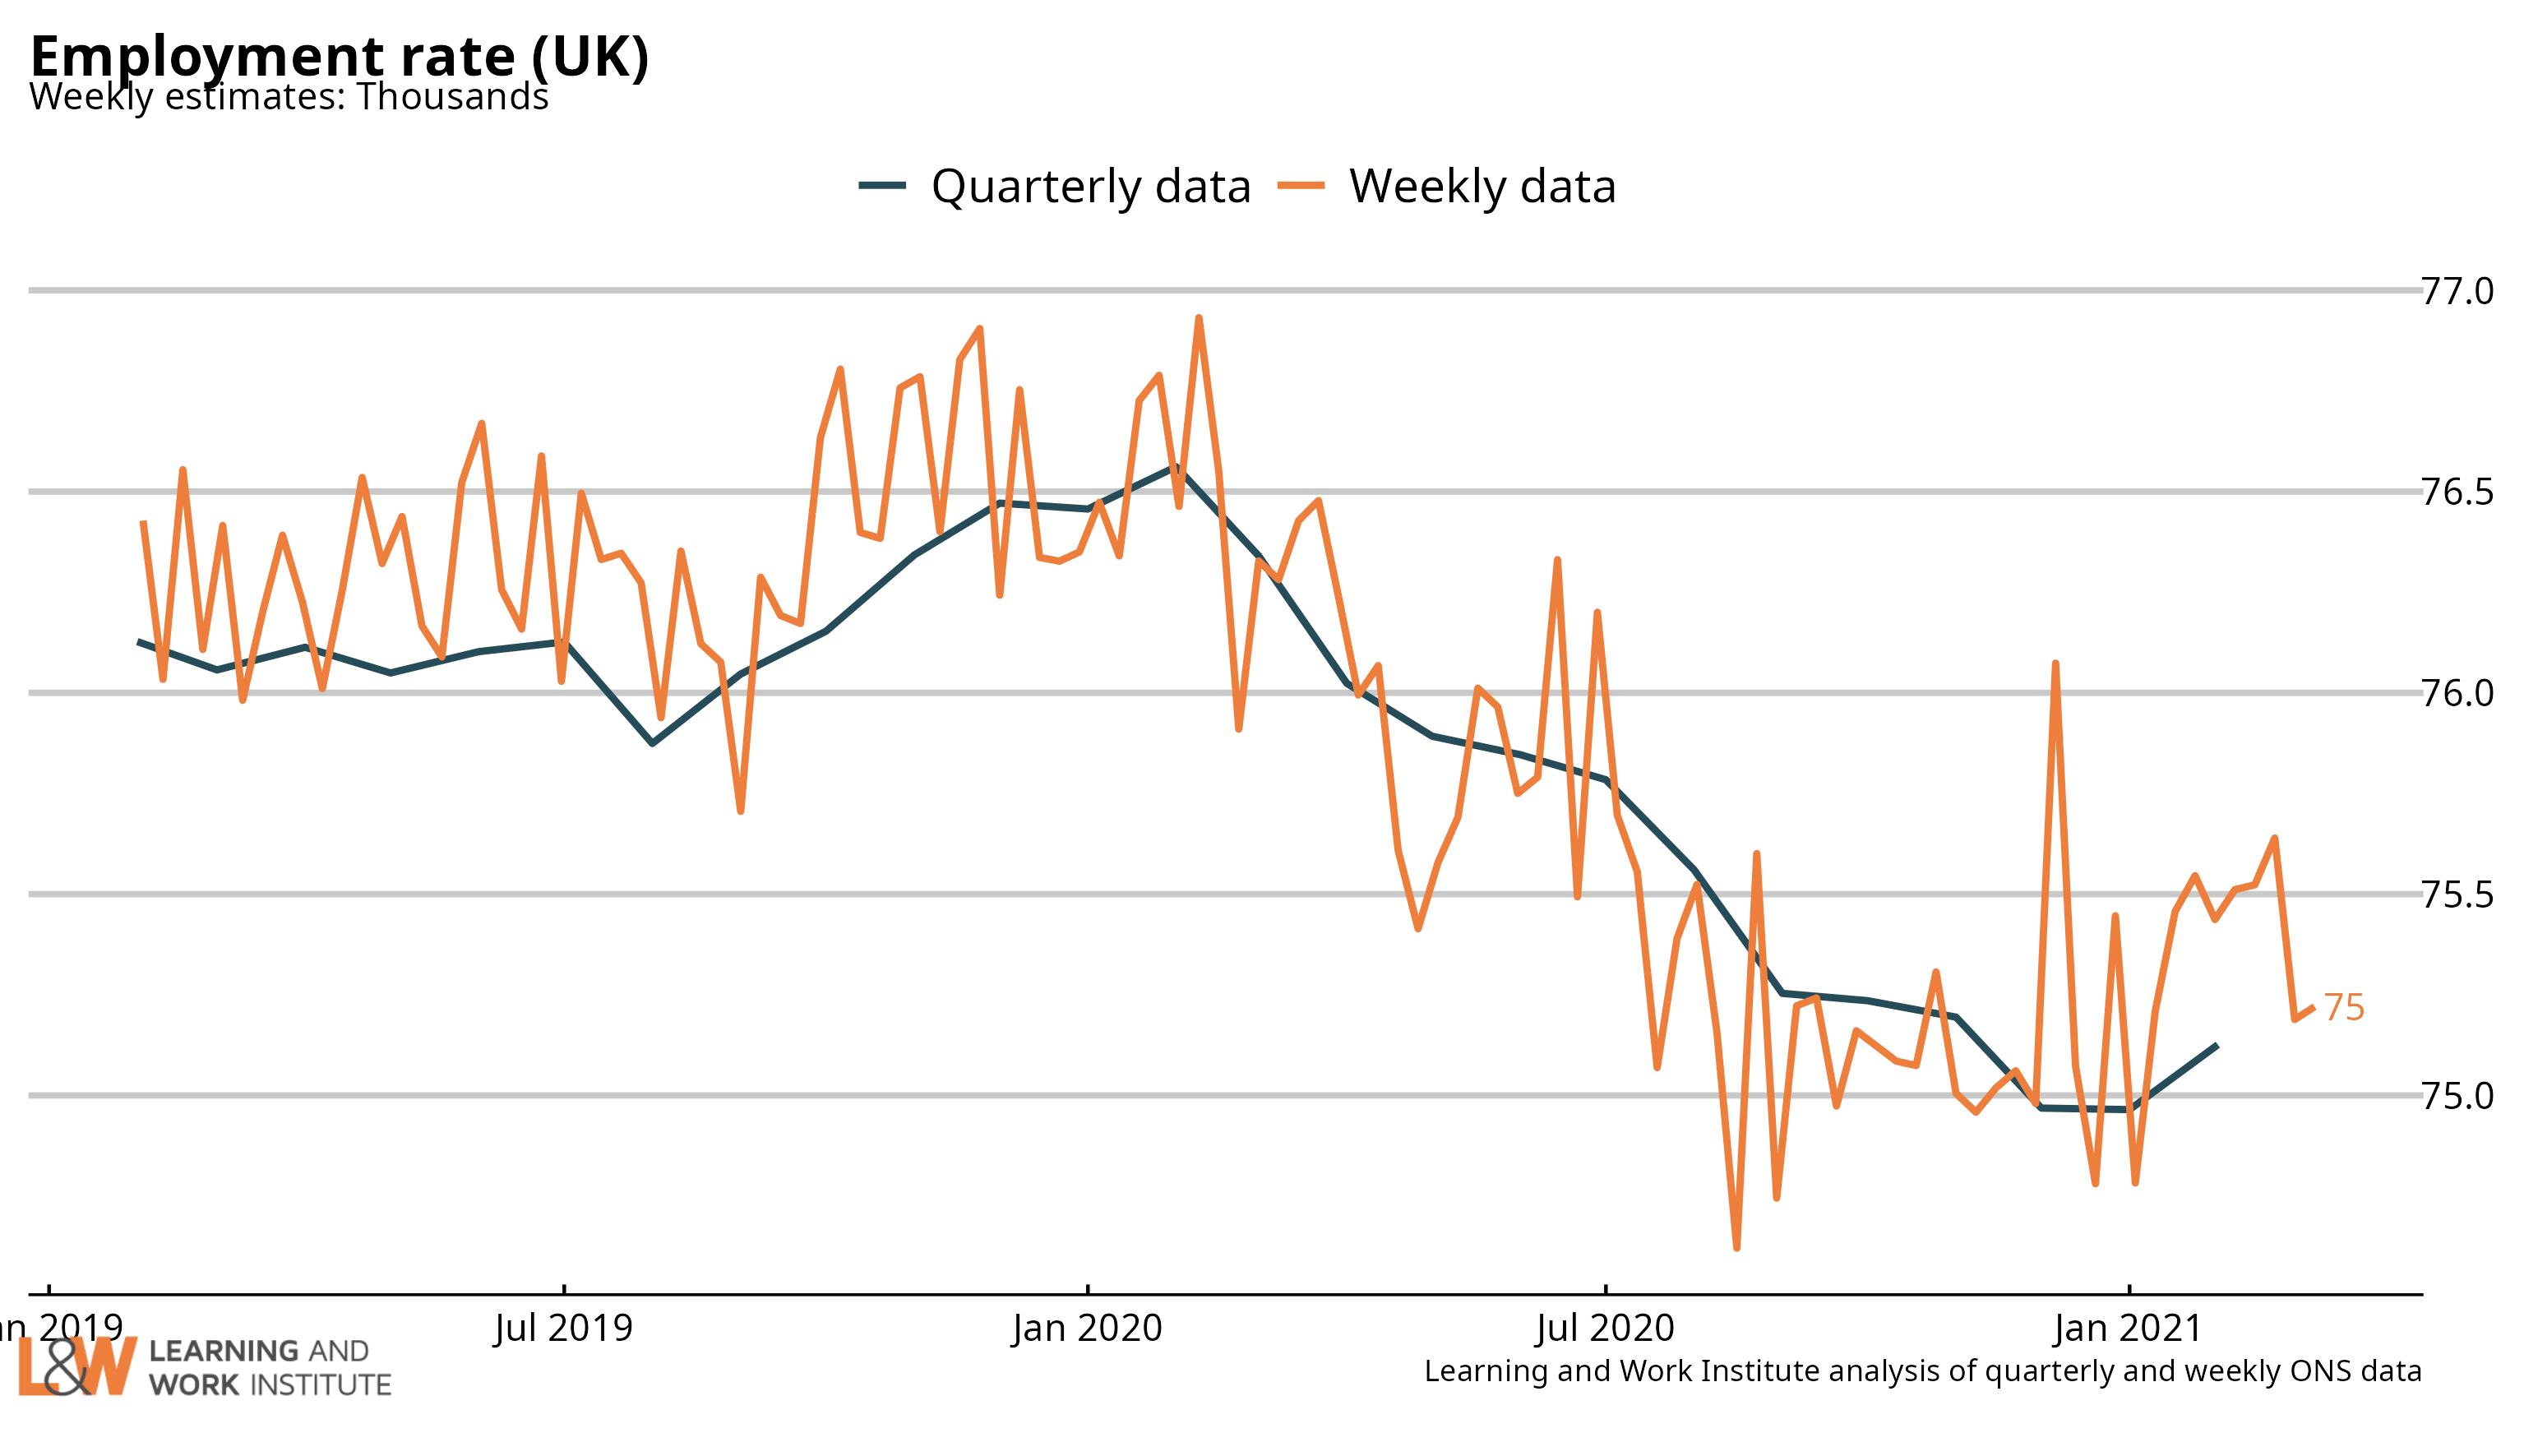 |
|
| Chart 16: Economic inactivity – the long-term sick or disabled The numbers of people who are economically inactive, that is, not working and not currently looking for work, who are long-term sick or disabled has been trending upwards. This month, there is a sharp fall. 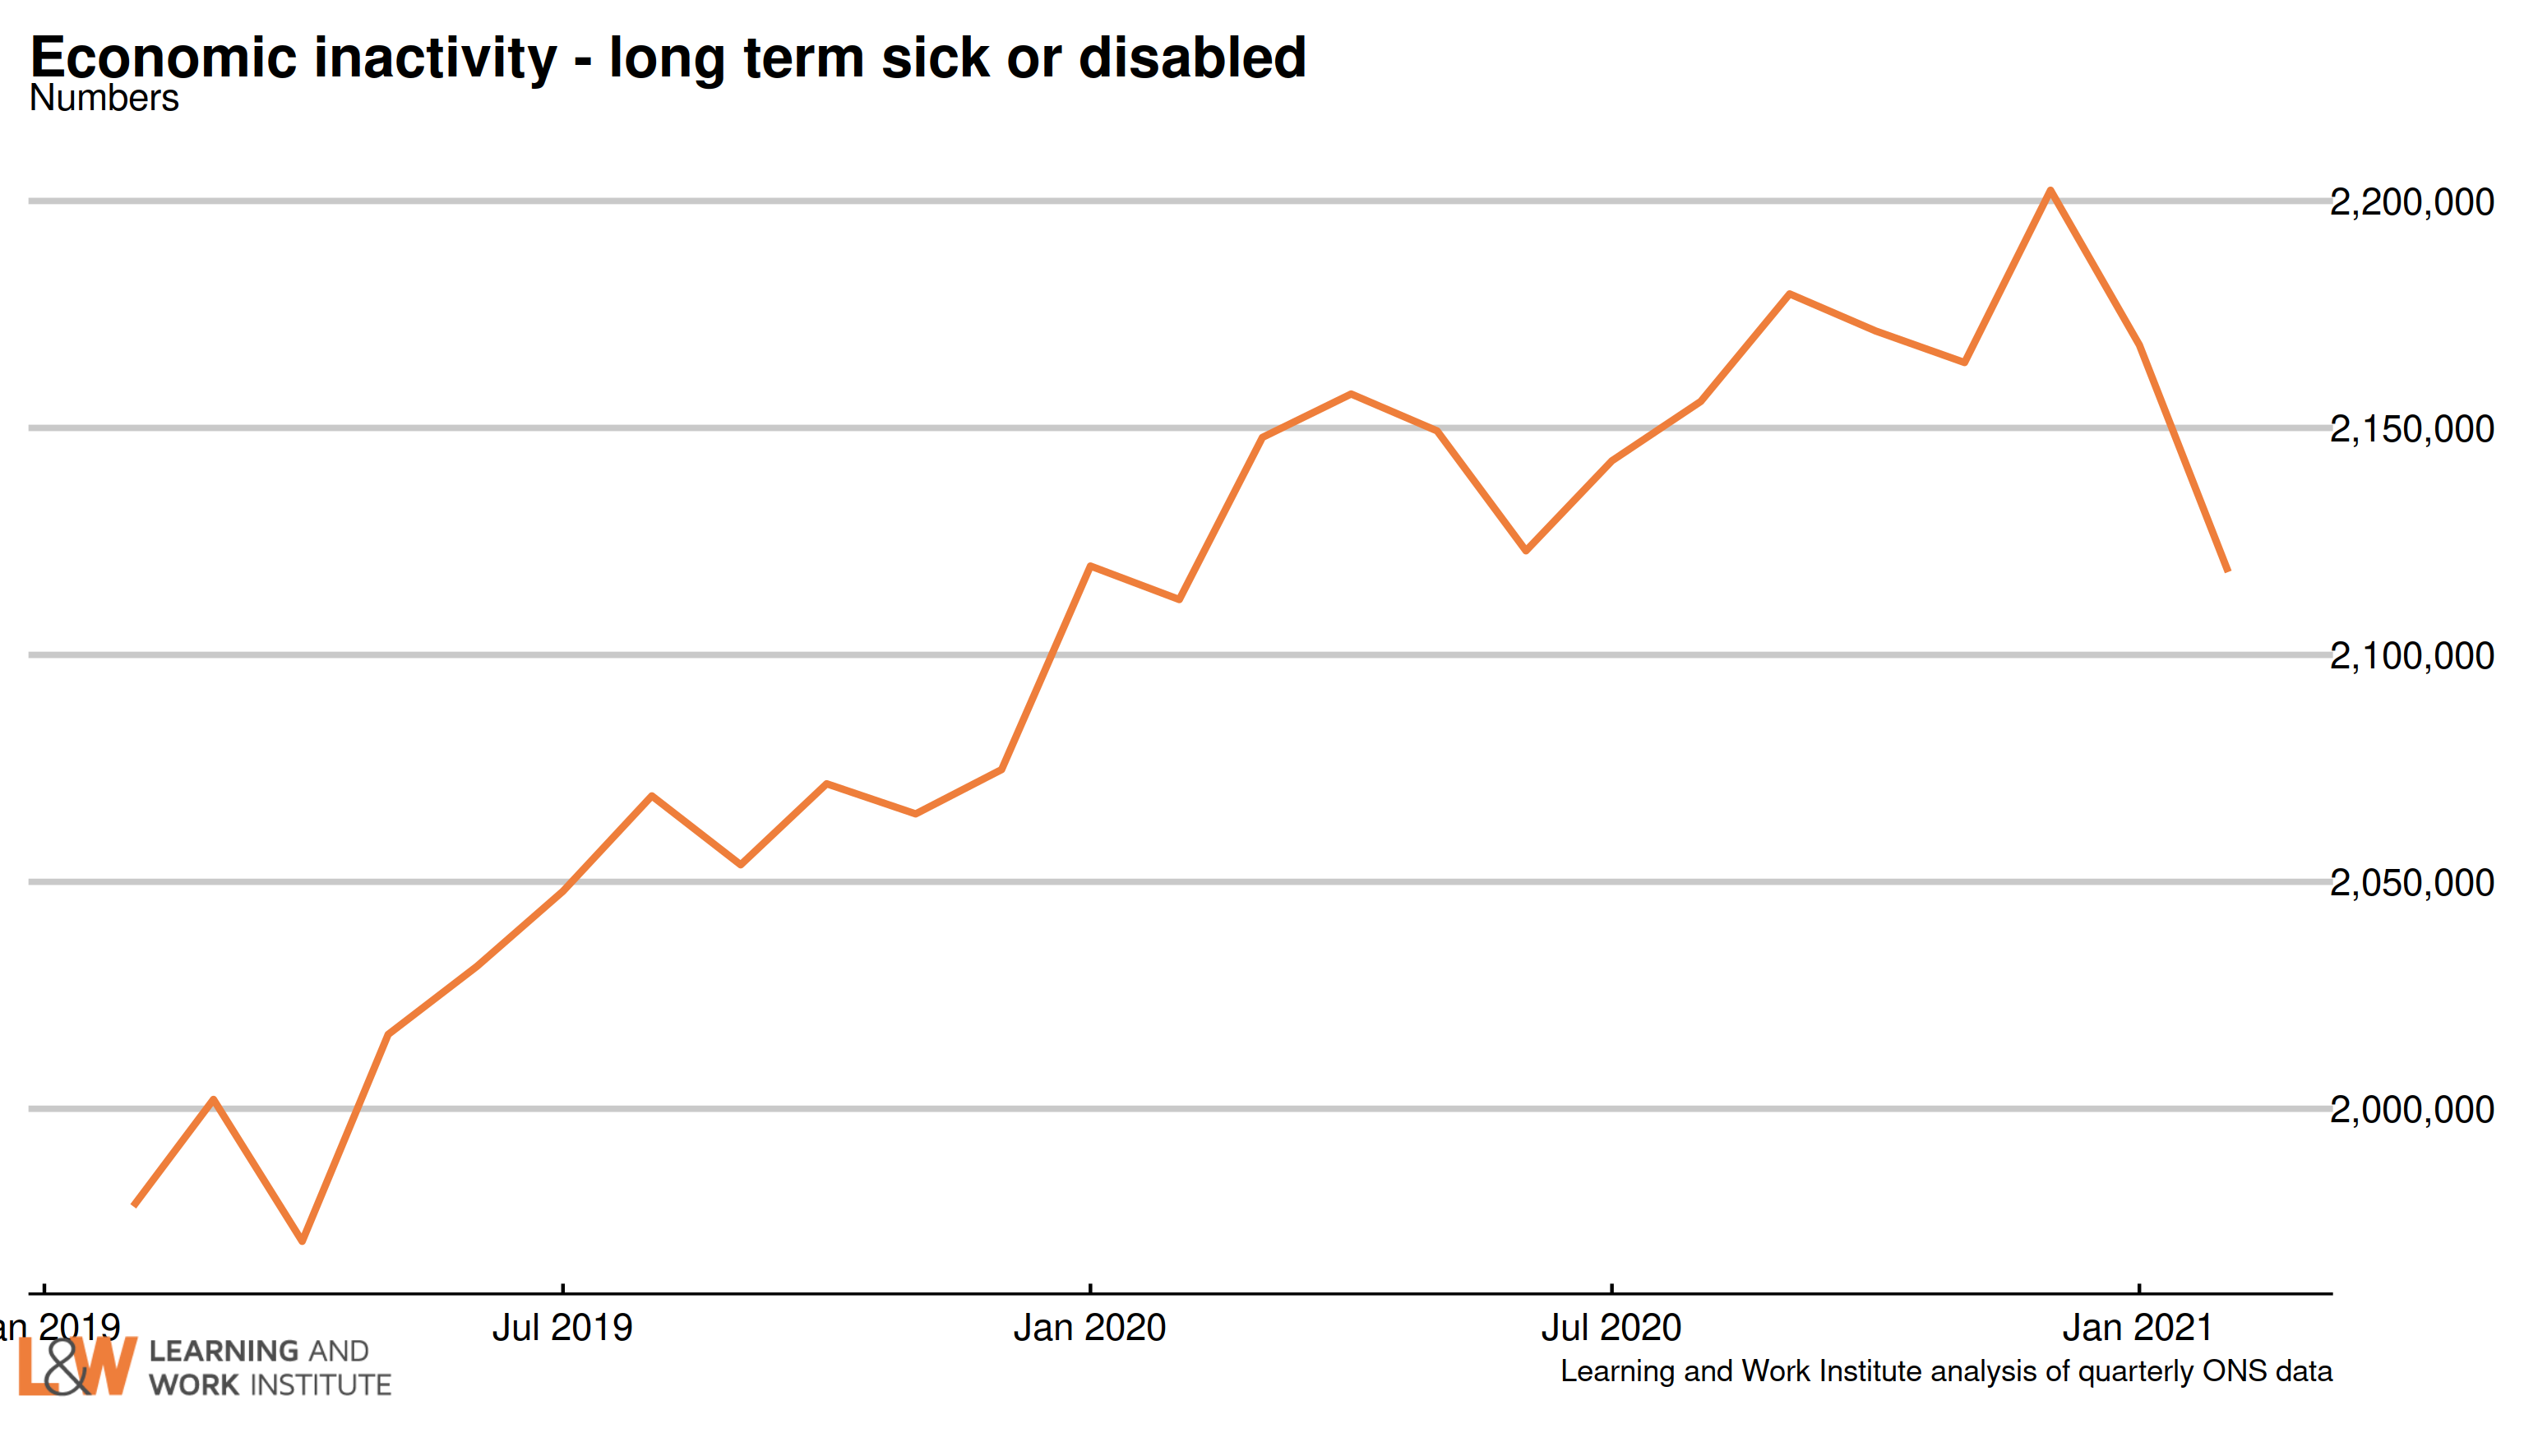 |
|
| Chart 17: Economic inactivity – people looking after family The survey figures (showing those looking after family and not doing paid work or looking for paid work) have been trending downwards. 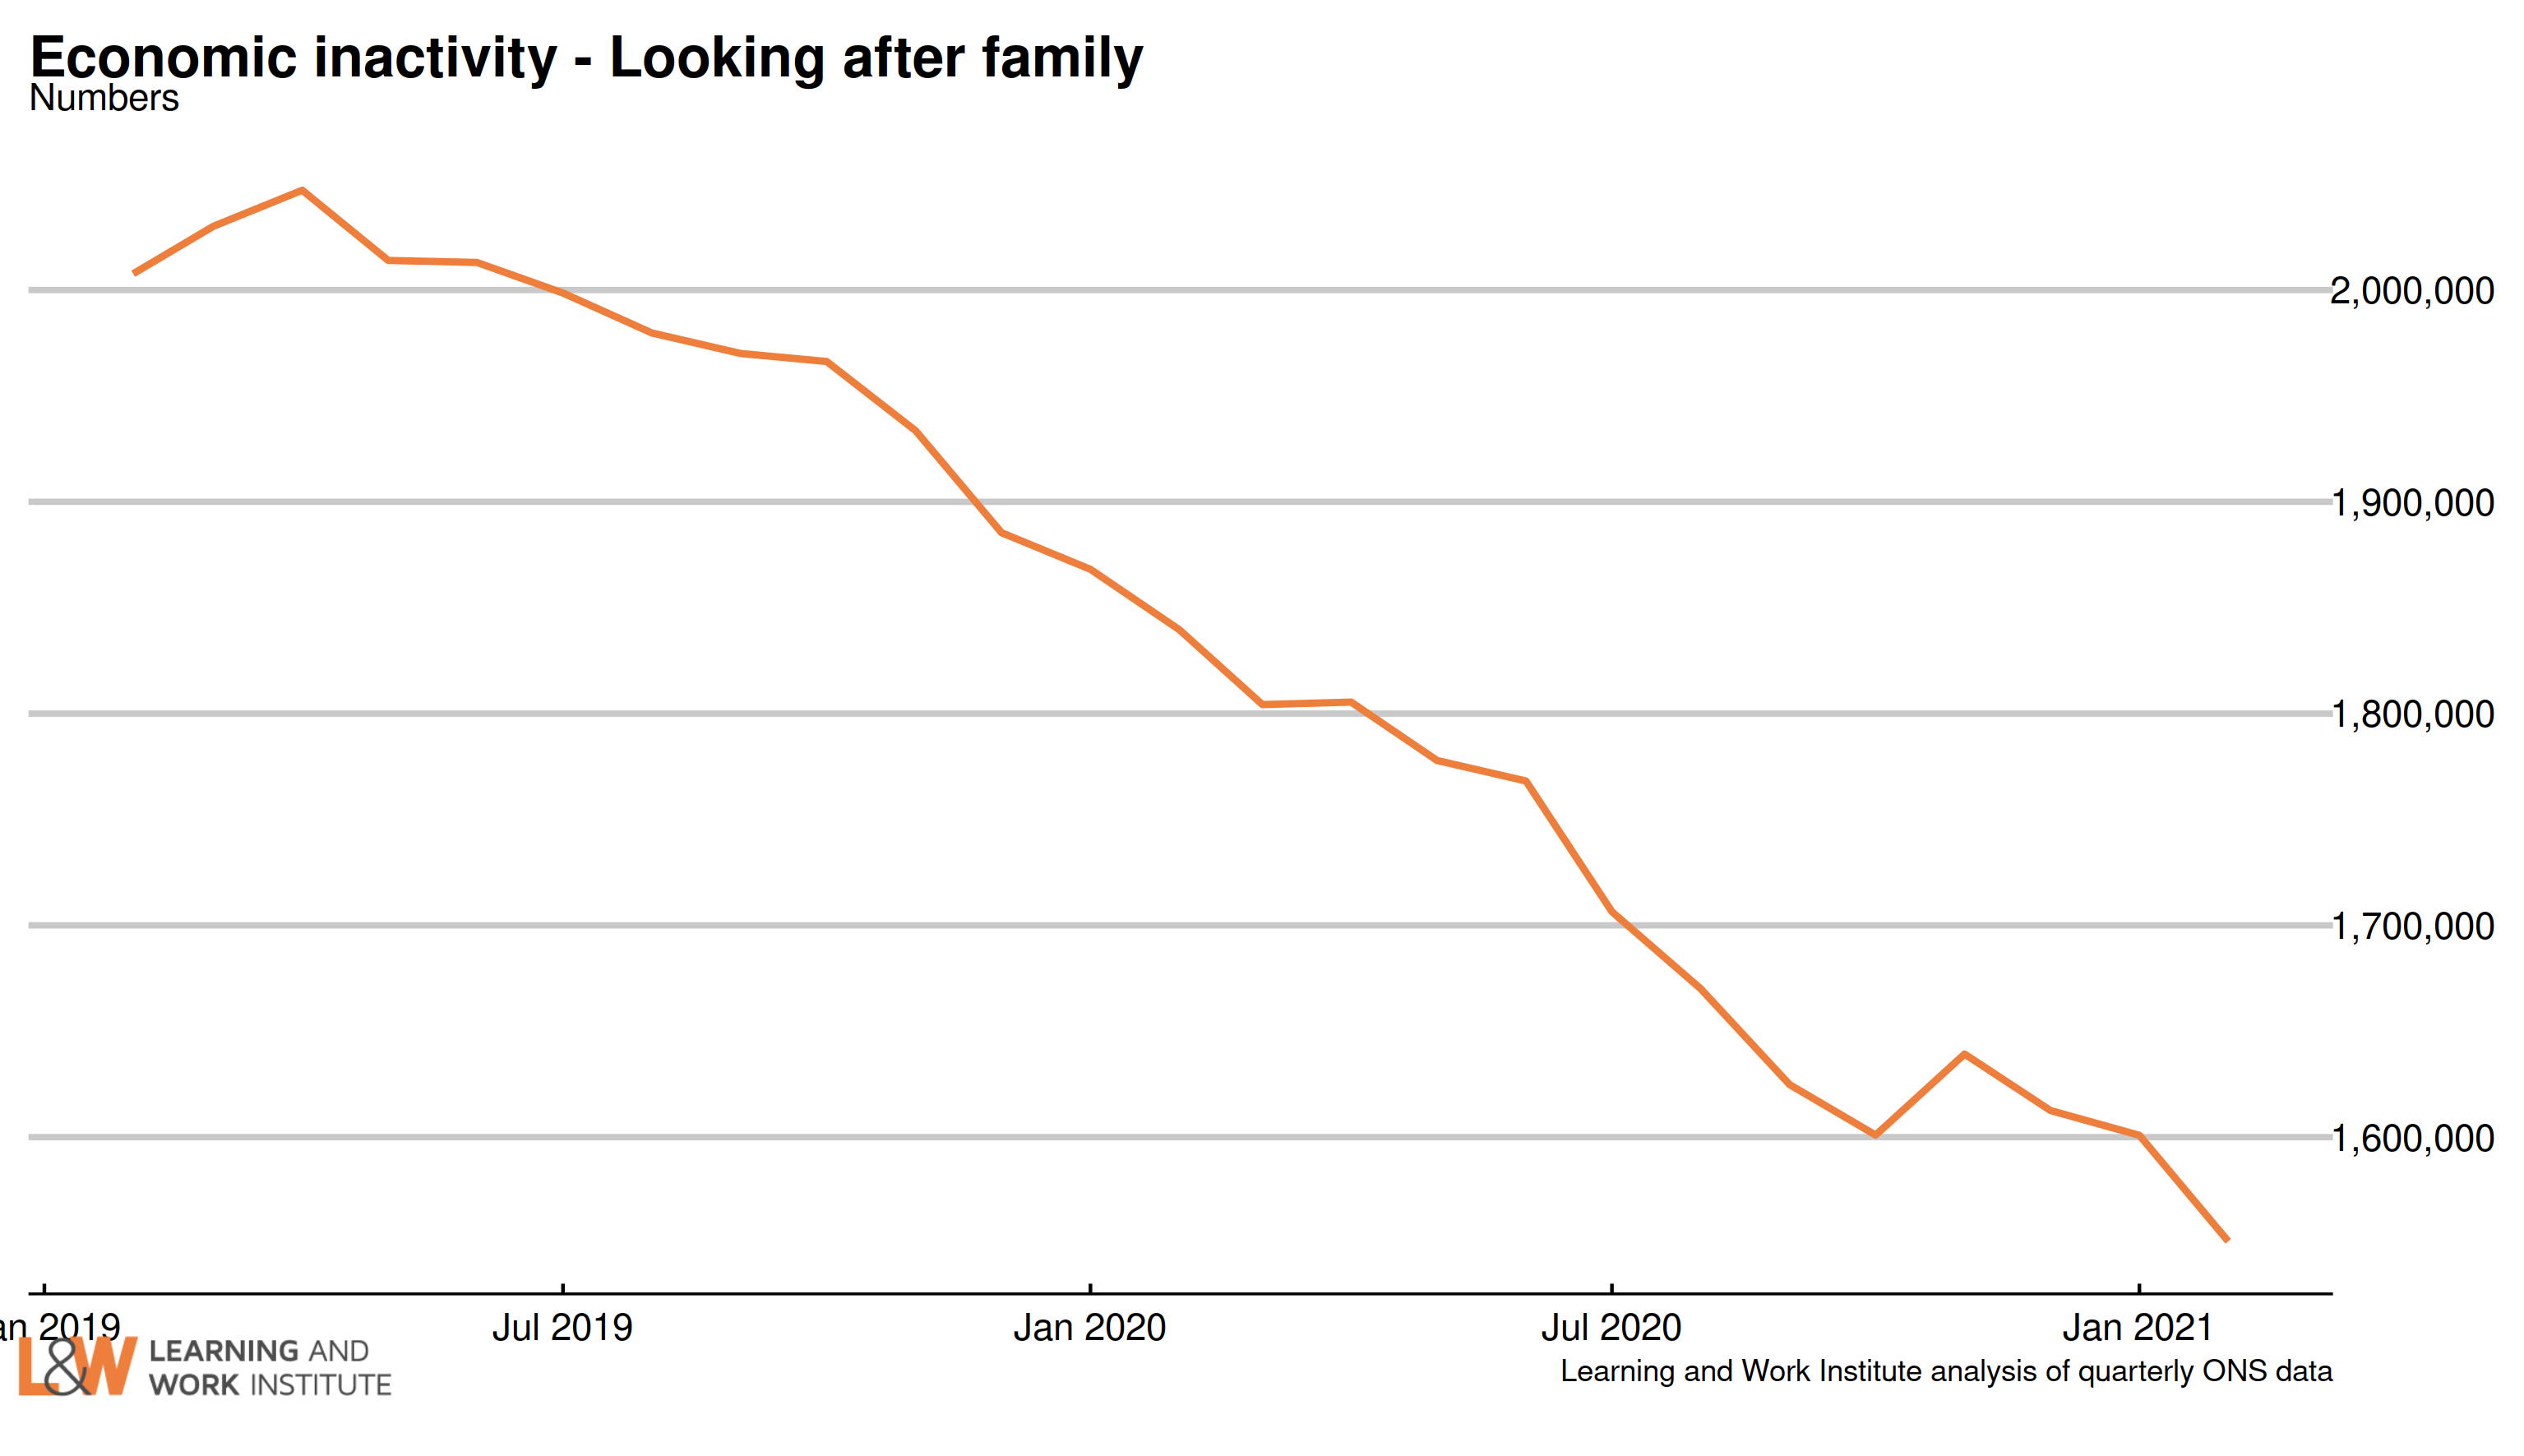 |
|
| Chart 18: Economic inactivity – other inactive In the Coronavirus period, people who were not working or looking for work due to Covid were included in this group. The number in this category increased sharply at the time, and has continued at a high level. A very high proportion of this group want to work, and this increased over the period of the pandemic. People not looking for a job because they are waiting to start a job they have been offered (as is likely to happen as firms reopen) are included in this group. 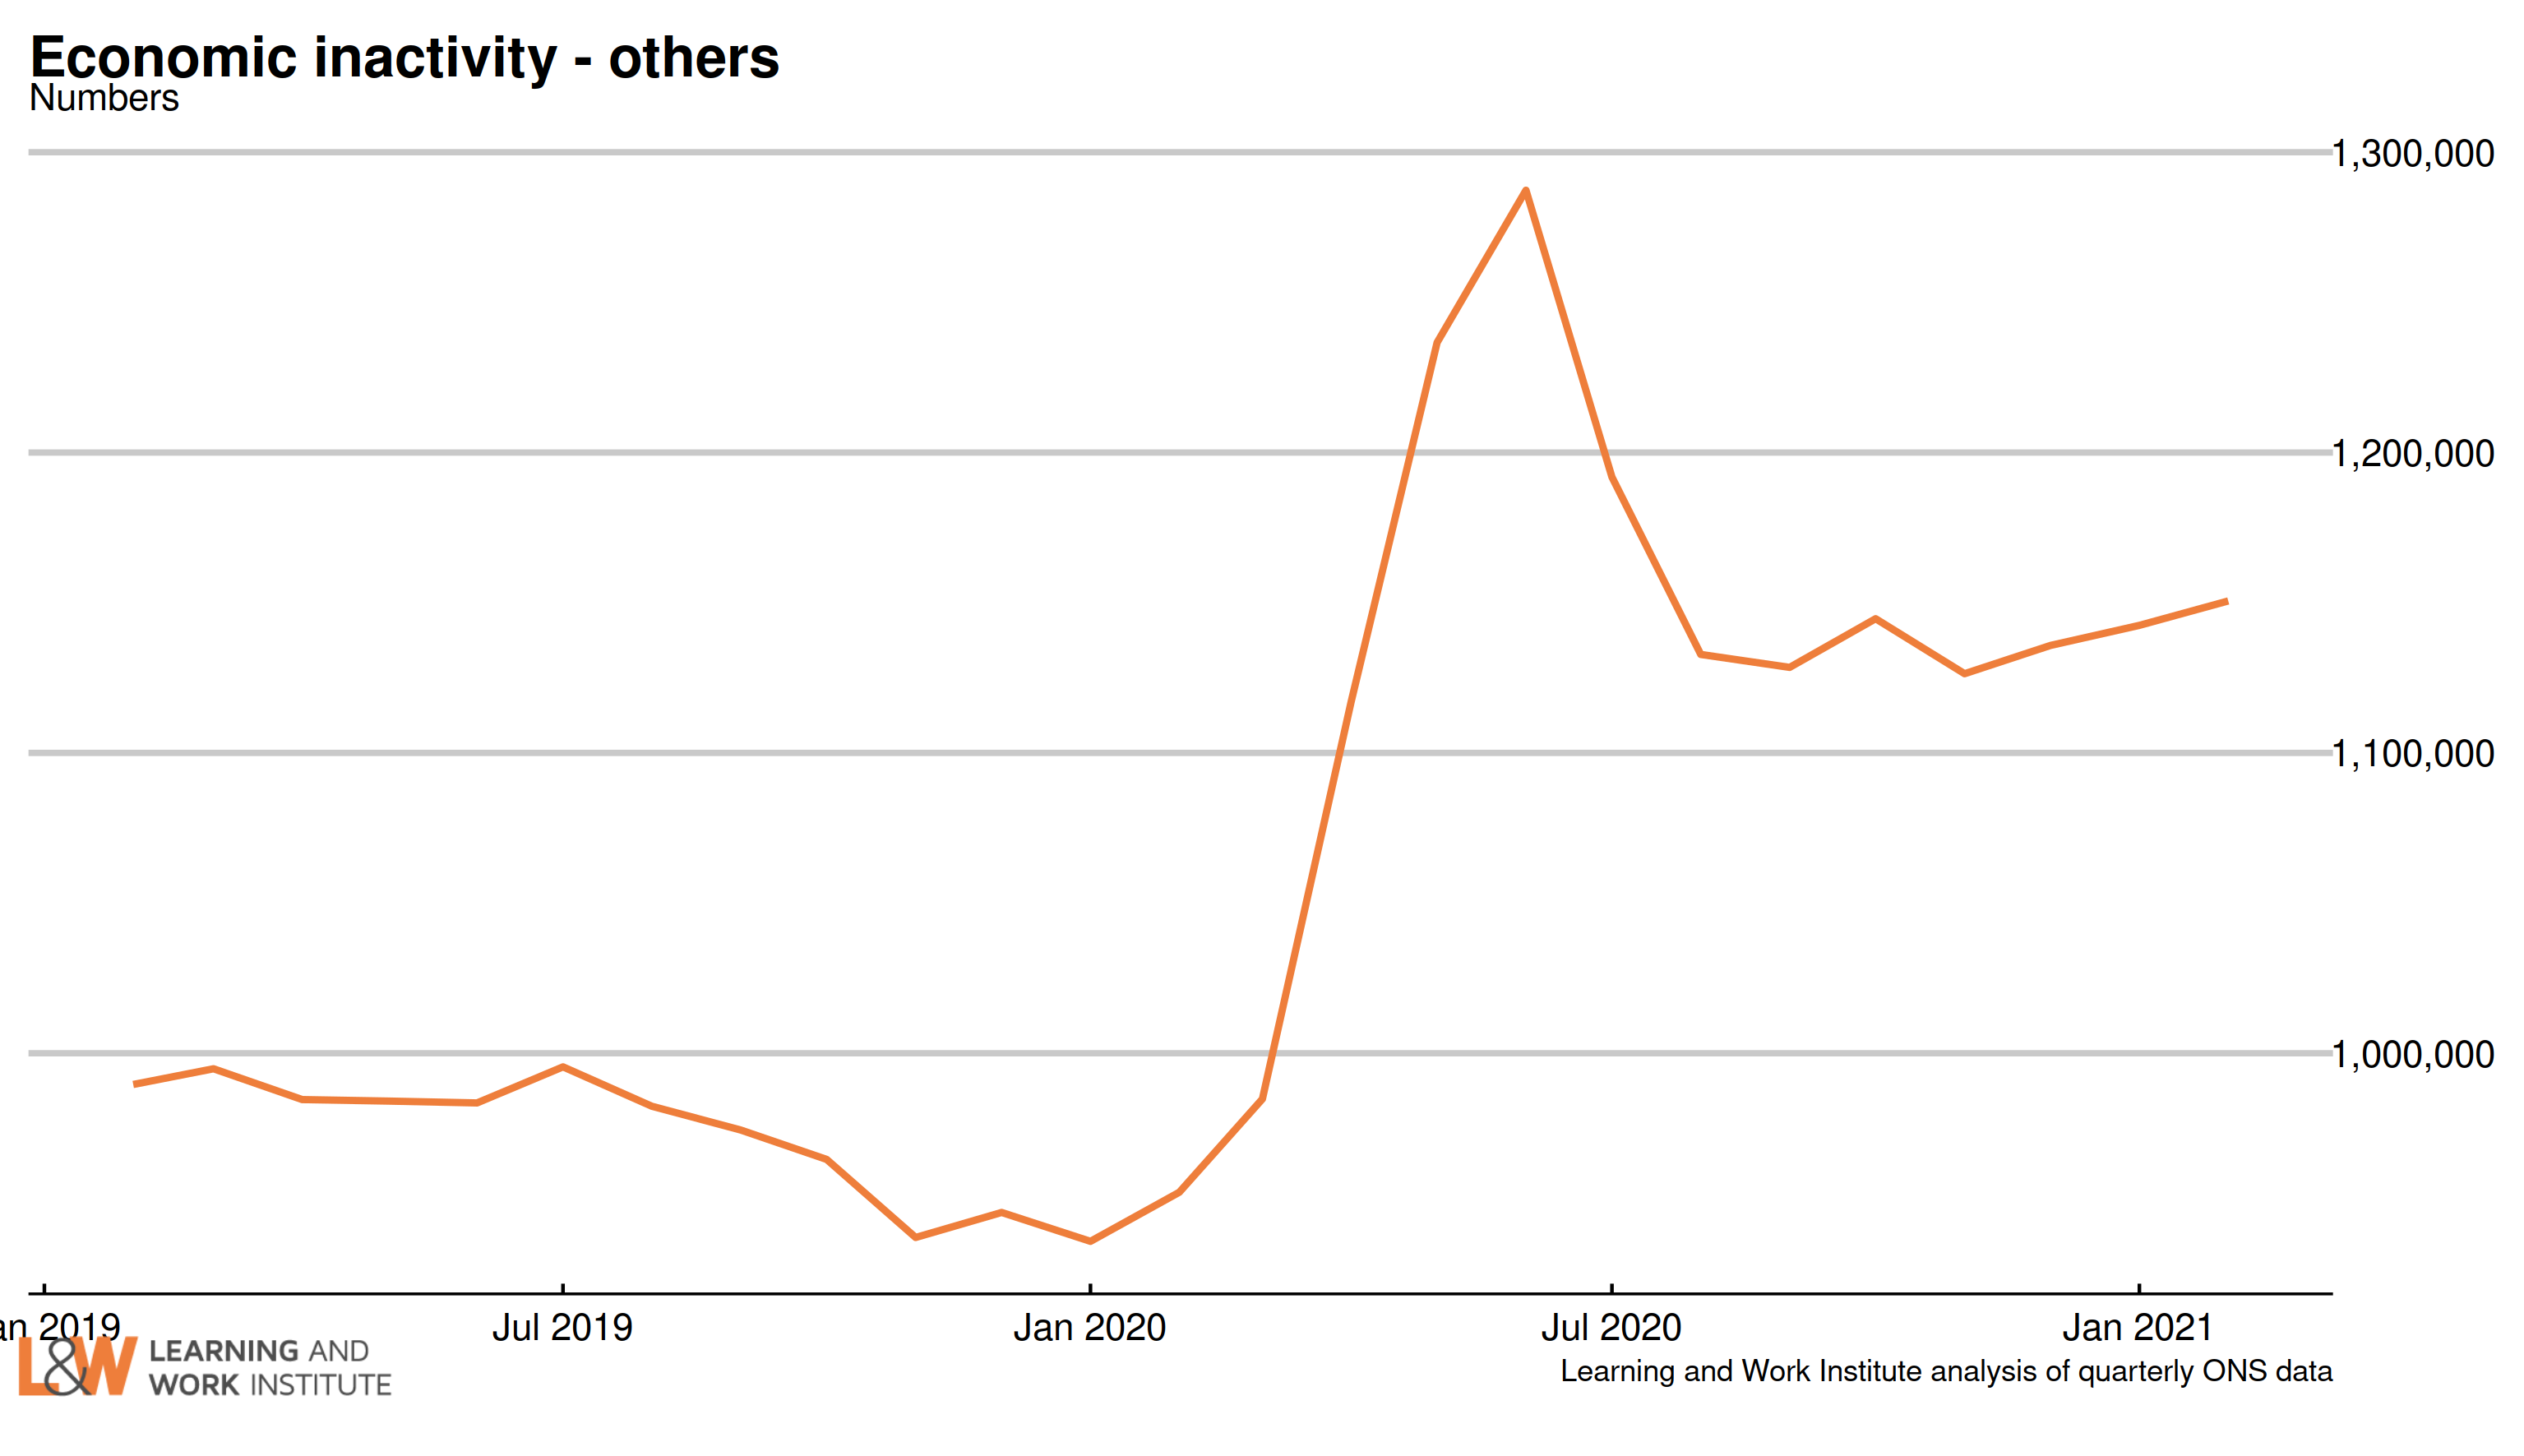 |
|
| Chart 19: Employment rate annual change in regions – February 2020 to February 2021 This quarter, no regions showed an annual rise in the employment rate, with Yorkshire and the Humber showing the smallest fall. The employment rate fell in all regions, with the largest annual falls in Northern Ireland, the South West and London. 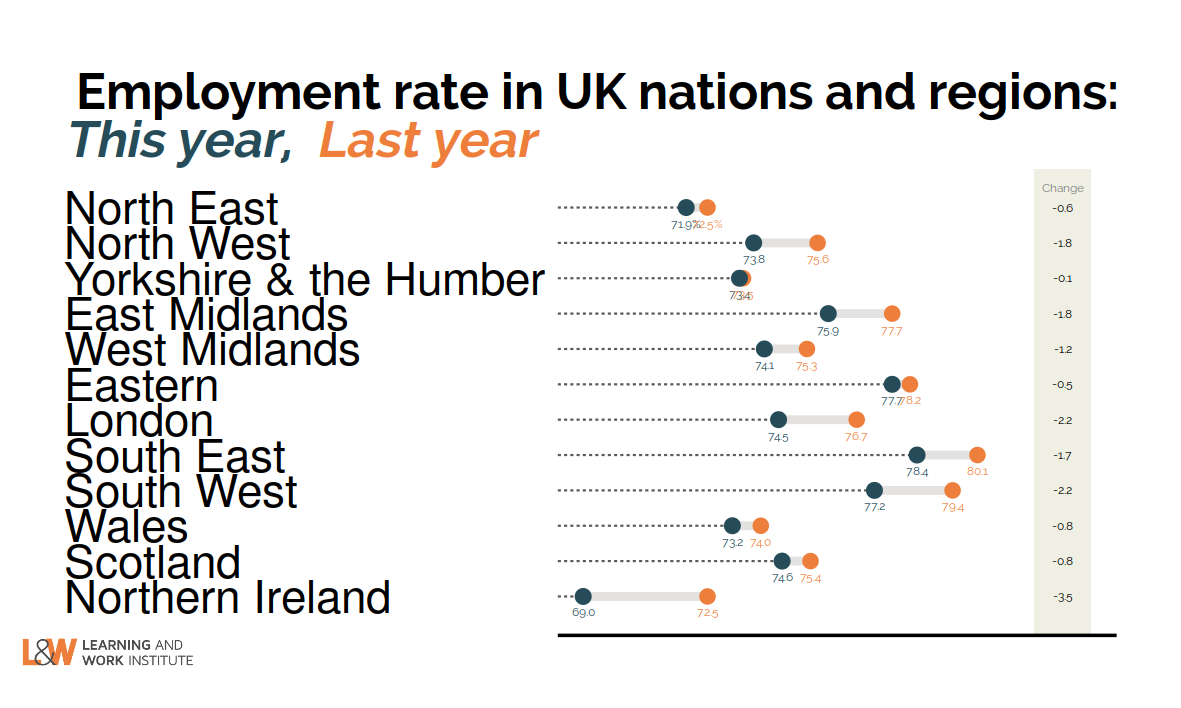 |
|
| Chart 20: Unemployment rate annual change in regions – February 2020 to February 2021 This quarter, all regions showed a rise in the unemployment rate, led by London and Northern Ireland. The smallest rises were in the North East, Yorkshire and the Humber and the Eastern region. 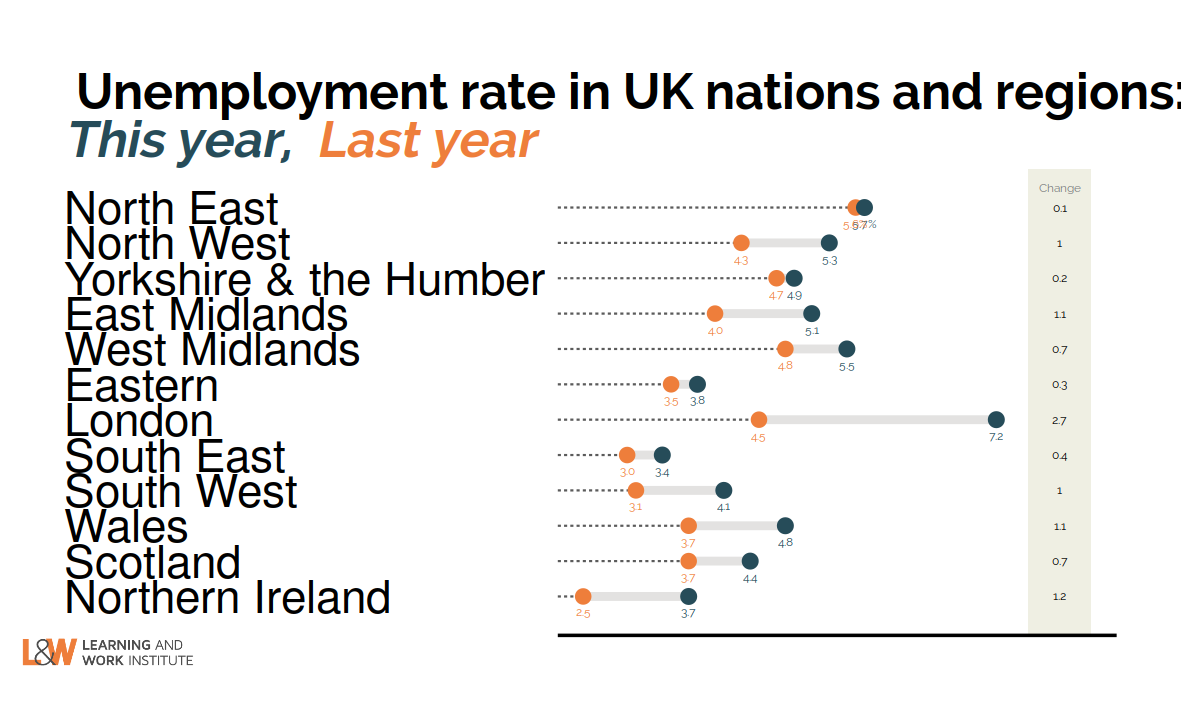 |
|
| Chart 21: Inactivity rate annual change in regions – February 2020 to February 2021 This quarter, 10 regions showed a rise in the inactivity rate, led by the Northern Ireland and the South West. The inactivity rate fell very slightly in 2 regions, Wales and Yorkshire and the Humber. 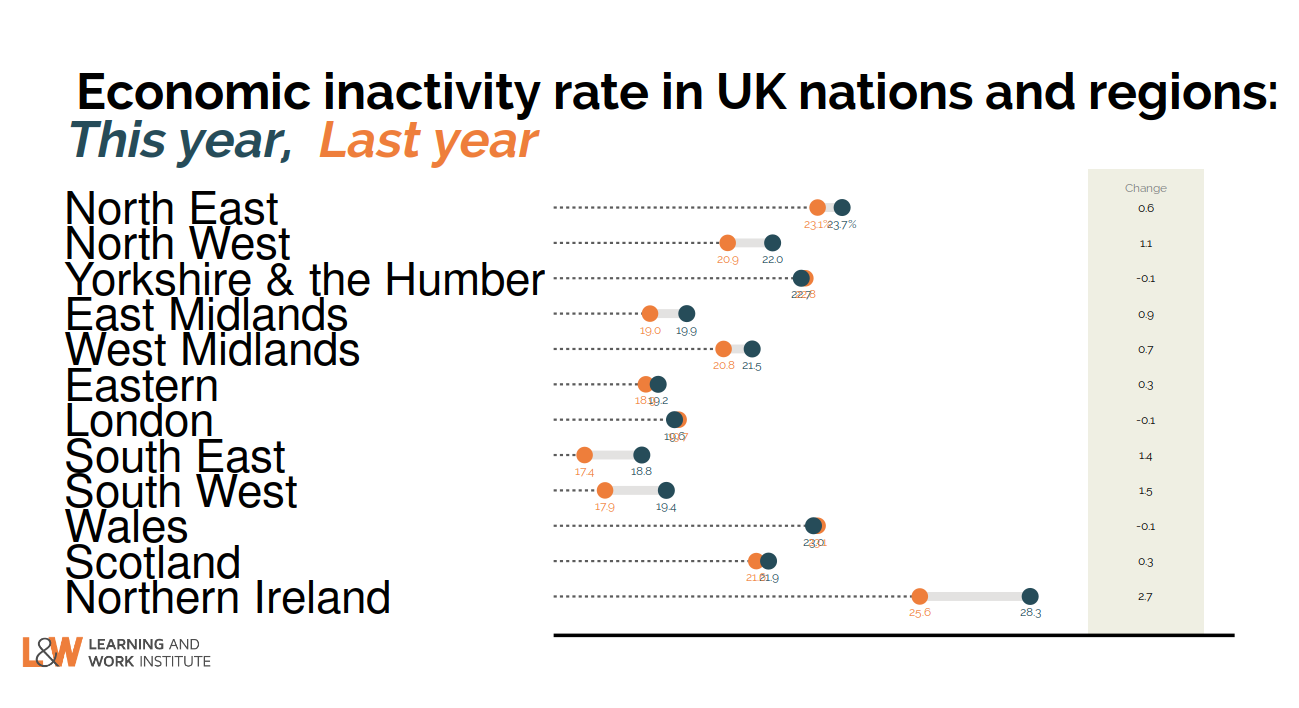 |
|
|
This newsletter is produced by Learning and Work Institute and keeps readers up to date on a wide range of learning and work issues. |
|