 |
|
Making learning and work count
Labour market LIVE from Learning and Work Institute
23 February 2021
- Unemployment is 1,744,000, has risen by 20,000 from last month’s published figure (quarterly headline is up by 121,000) and the unemployment rate at 5.1%, has risen by 0.1 percentage points on last month and increased by 0.4 percentage points on last quarter.
- The ONS figure for claimant unemployed is 2,597,100, down by 20,000 on last month, and the claimant rate is 7.2%.
- The ONS figure for youth claimant unemployed is 514,500, up by 2,700 on last month.
- The number of workless young people (not in employment, full-time education or training) is 1,005,000, fell by 35,000 on the quarter, representing 14.7% of the youth population ( percentage points).
- Youth unemployment (including students) is 589,000, down 12,000 on the quarter.
- Vacancies in November to January were yp slightly (in the ONS official series) to 599,000 after recovering strongly from the low point of 343,00 in April to June..
- There are 3.0 unemployed people per vacancy, down from a peak of 4.0.
- The employment rate is 75% (down by 0.2 percentage points on last month’s published figure and is down by 0.3 percentage points in the preferred quarterly measure).
Learning and Work Institute comment
The labour market figures published on 23 February provide mixed evidence as to the impact of the sudden tightening of lockdown restrictions in the second half of December last year, but suggest that matters have improved in early 2021.
Duncan Melville, Chief Economist at Learning and Work Institute, commented:
The headline numbers for employment and unemployment from the Labour Force Survey (LFS) released today relate to the last three months of 2020. In these three months, employment fell by 114,000 and unemployment rose by 121,000. In of themselves, they suggest a continuation of a steady deterioration in the labour market seen in these headline numbers since the April to June quarter last year. Government policy, and in particular, the
Coronavirus Job Retention Scheme (CJRS) has impacted massively on the measured levels of employment and unemployment since March 2020. Here the decline in the number of furloughed employees aligns with the steady decline in employment and rise in unemployment.
Since the onset of the pandemic, greater focus has been placed on a range of more timely labour market data, including the weekly and monthly LFS data, in order to try and understand what is happening in these extraordinary times. The problem here is extracting the signal from the noise in these numbers given they are based on smaller sample sizes and so are inherently more volatile. In this light, it is important to interrogate further whether or not the large fall in employment of 288,000 and the large rise in unemployment of 165,000 seen in the monthly numbers for December point to a significant deterioration in the labour market as lockdown restrictions were tightened in the second half of
December. The weekly LFS data for December shows considerable volatility with large falls in employment in the first and last weeks of the month, partially offset by a large rise in the third week.
The weekly total hours worked numbers contrast in show a large decline in the third week of December followed by a bounce back in the last week of the month. Here the Office for National Statistics (ONS) caution that they are reviewing the process for seasonally adjusting the hours data for the Christmas period. Other pieces of information paint a more positive picture for December. HMRC payroll data showed an increase for the month, the monthly vacancy data was flat between November and January, and the number of redundancies trended down over the month. All in all, this points to an uncertain picture for December with different pieces of information pointing in different directions.
Perhaps clearer cut is the data we have for early 2021, which seems to
suggest that labour market prospects have improved. HMRC payroll data showed another increase in January. Consistent with this the Chartered Institute for Personnel Development (CIPD)'s Labour Market Outlook for Winter 2020-21 showed a positive net balance for employment intentions for the first three months of 2021 - the first positive number since the start of the first lockdown in March 2020. As mentioned ONS vacancy numbers stayed steady in January and the timelier Adzuna numbers for total job adverts suggest that vacancies rose between mid-January and mid-February. The number of redundancies look set to fall in early 2021. Advance notifications by employers to the Insolvency Service of intentions to undertake redundancies are a leading indicator for actual redundancies and continued to fall in late 2020 and January 2021. The CIPD's Labour Market Outlook for Winter 2020-21 found a sharp reduction in the proportion of employers expecting to undertake redundancies
in early 2021, 20 percent, down from 30 percent in the autumn of 2020.
Whatever the immediate prospects for the labour market some substantial labour market problems remain. Young people, under the age of 25, have borne the brunt of the pandemic. According to the HMRC payroll data 60 percent of the total fall in employee numbers in the year to January 2021 is accounted for by young people even though they formed only 14 percent of employees in January 2020. The figures from the LFS are less dramatic but still show that 46 percent of the fall in employment between January to March 2020 and October to December 2020 was accounted for by young people despite forming only 11 percent of employment in January to March 2020. The number of young people who have been unemployed for at least six months has risen by just over a half from 130,000 in May to July 2020 to 196,000 in October to December. Research has clearly shown that an experience of youth unemployment
has long lasting scarring effects on individuals' subsequent chances of being in work and on their wage levels when in work. The Government has introduced measures including the Kickstart and Restart programmes but needs to go further and introduce a Youth Guarantee of a job, apprenticeship or training offer.
Paul Bivand, Associate director for Statistics and Analysis, Learning and Work Institute, said:
In this briefing we have tried to show the latest weekly estimates from ONS, as well as the official estimates (which usually cover the latest three months surveyed). These potentially indicate the direction of travel over the last month surveyed, but due to the small sample sizes, they are experimental for a reason.
That being said, the sample sizes for the weekly estimates are similar to the regional estimates we regularly report. The major difference is that ONS has more experience of weighting and seasonally adjusting the
regional series, so they may be a little more reliable than the weekly series.
Employment fell by 114,000 between July 2020 to September 2020 and October 2020 to December 2020. In the last 12 months employment fell by 541,000.
Unemployment rose by 121,000 between July 2020 to September 2020 and October 2020 to December 2020. and the unemployment rate is up by 0.4 percentage points to 5.1% in the quarter the highest level since 2016.
Economic inactivity rose by 2,000 between July 2020 to September 2020 and October 2020 to December 2020. and the inactivity rate showed no change at 20.9%.
The national claimant count has fallen by 20,000.
Youth unemployment is showing a quarterly fall. There are 596,000 unemployed young people, and 405,000 (6.0% of the youth population) who are unemployed and not in full-time education.
Self-employment has fallen by 152,000 this quarter. The number of employees increased by
48,000 in the quarter. Involuntary part-time employment is up by 120,000 this quarter to 1 million, 12.9% of all part-time workers.
|
 |
Chart 1: UK unemployment rate (official measure)
The latest unemployment rate is up by 0.1 percentage points to 5.1%. The chart shows the experimental weekly survey figures as well as the official quarterly measure. Further rises are in prospect. 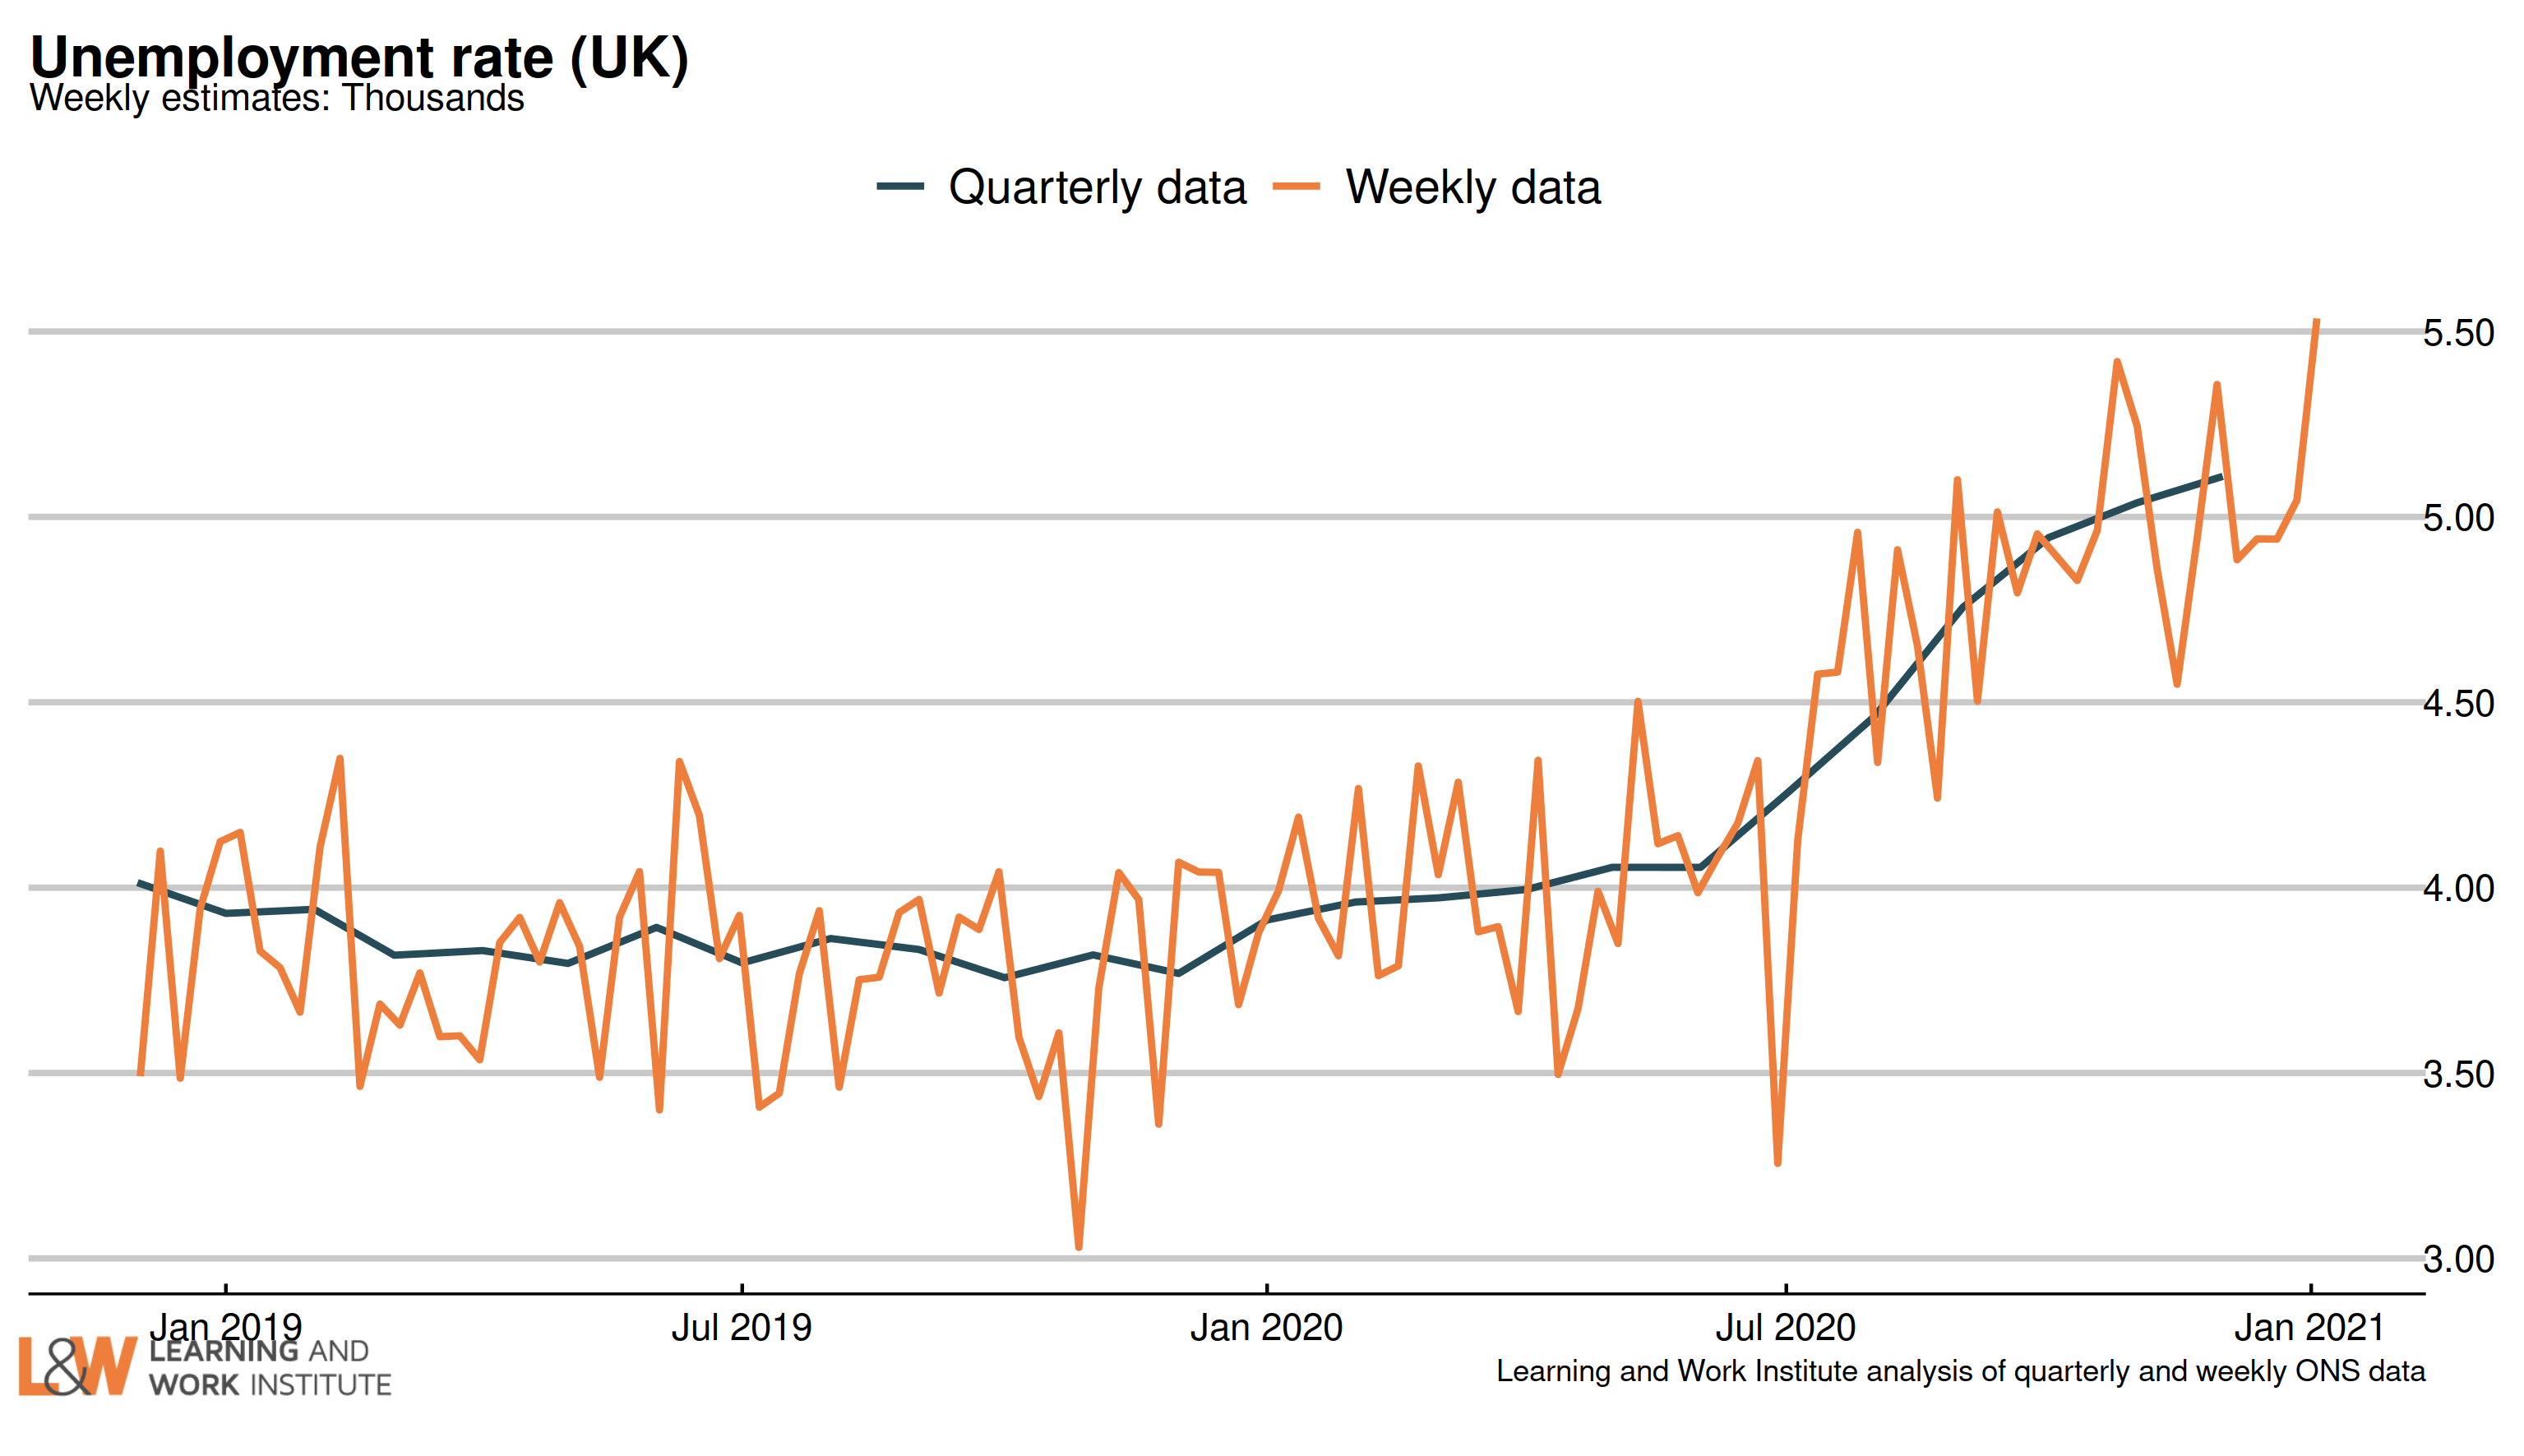 |
|
Chart 2: The claimant count and UK unemployment compared
The number of unemployed people who are claiming unemployment-related benefits is now 853,000 higher than the number of unemployed in the official measure. 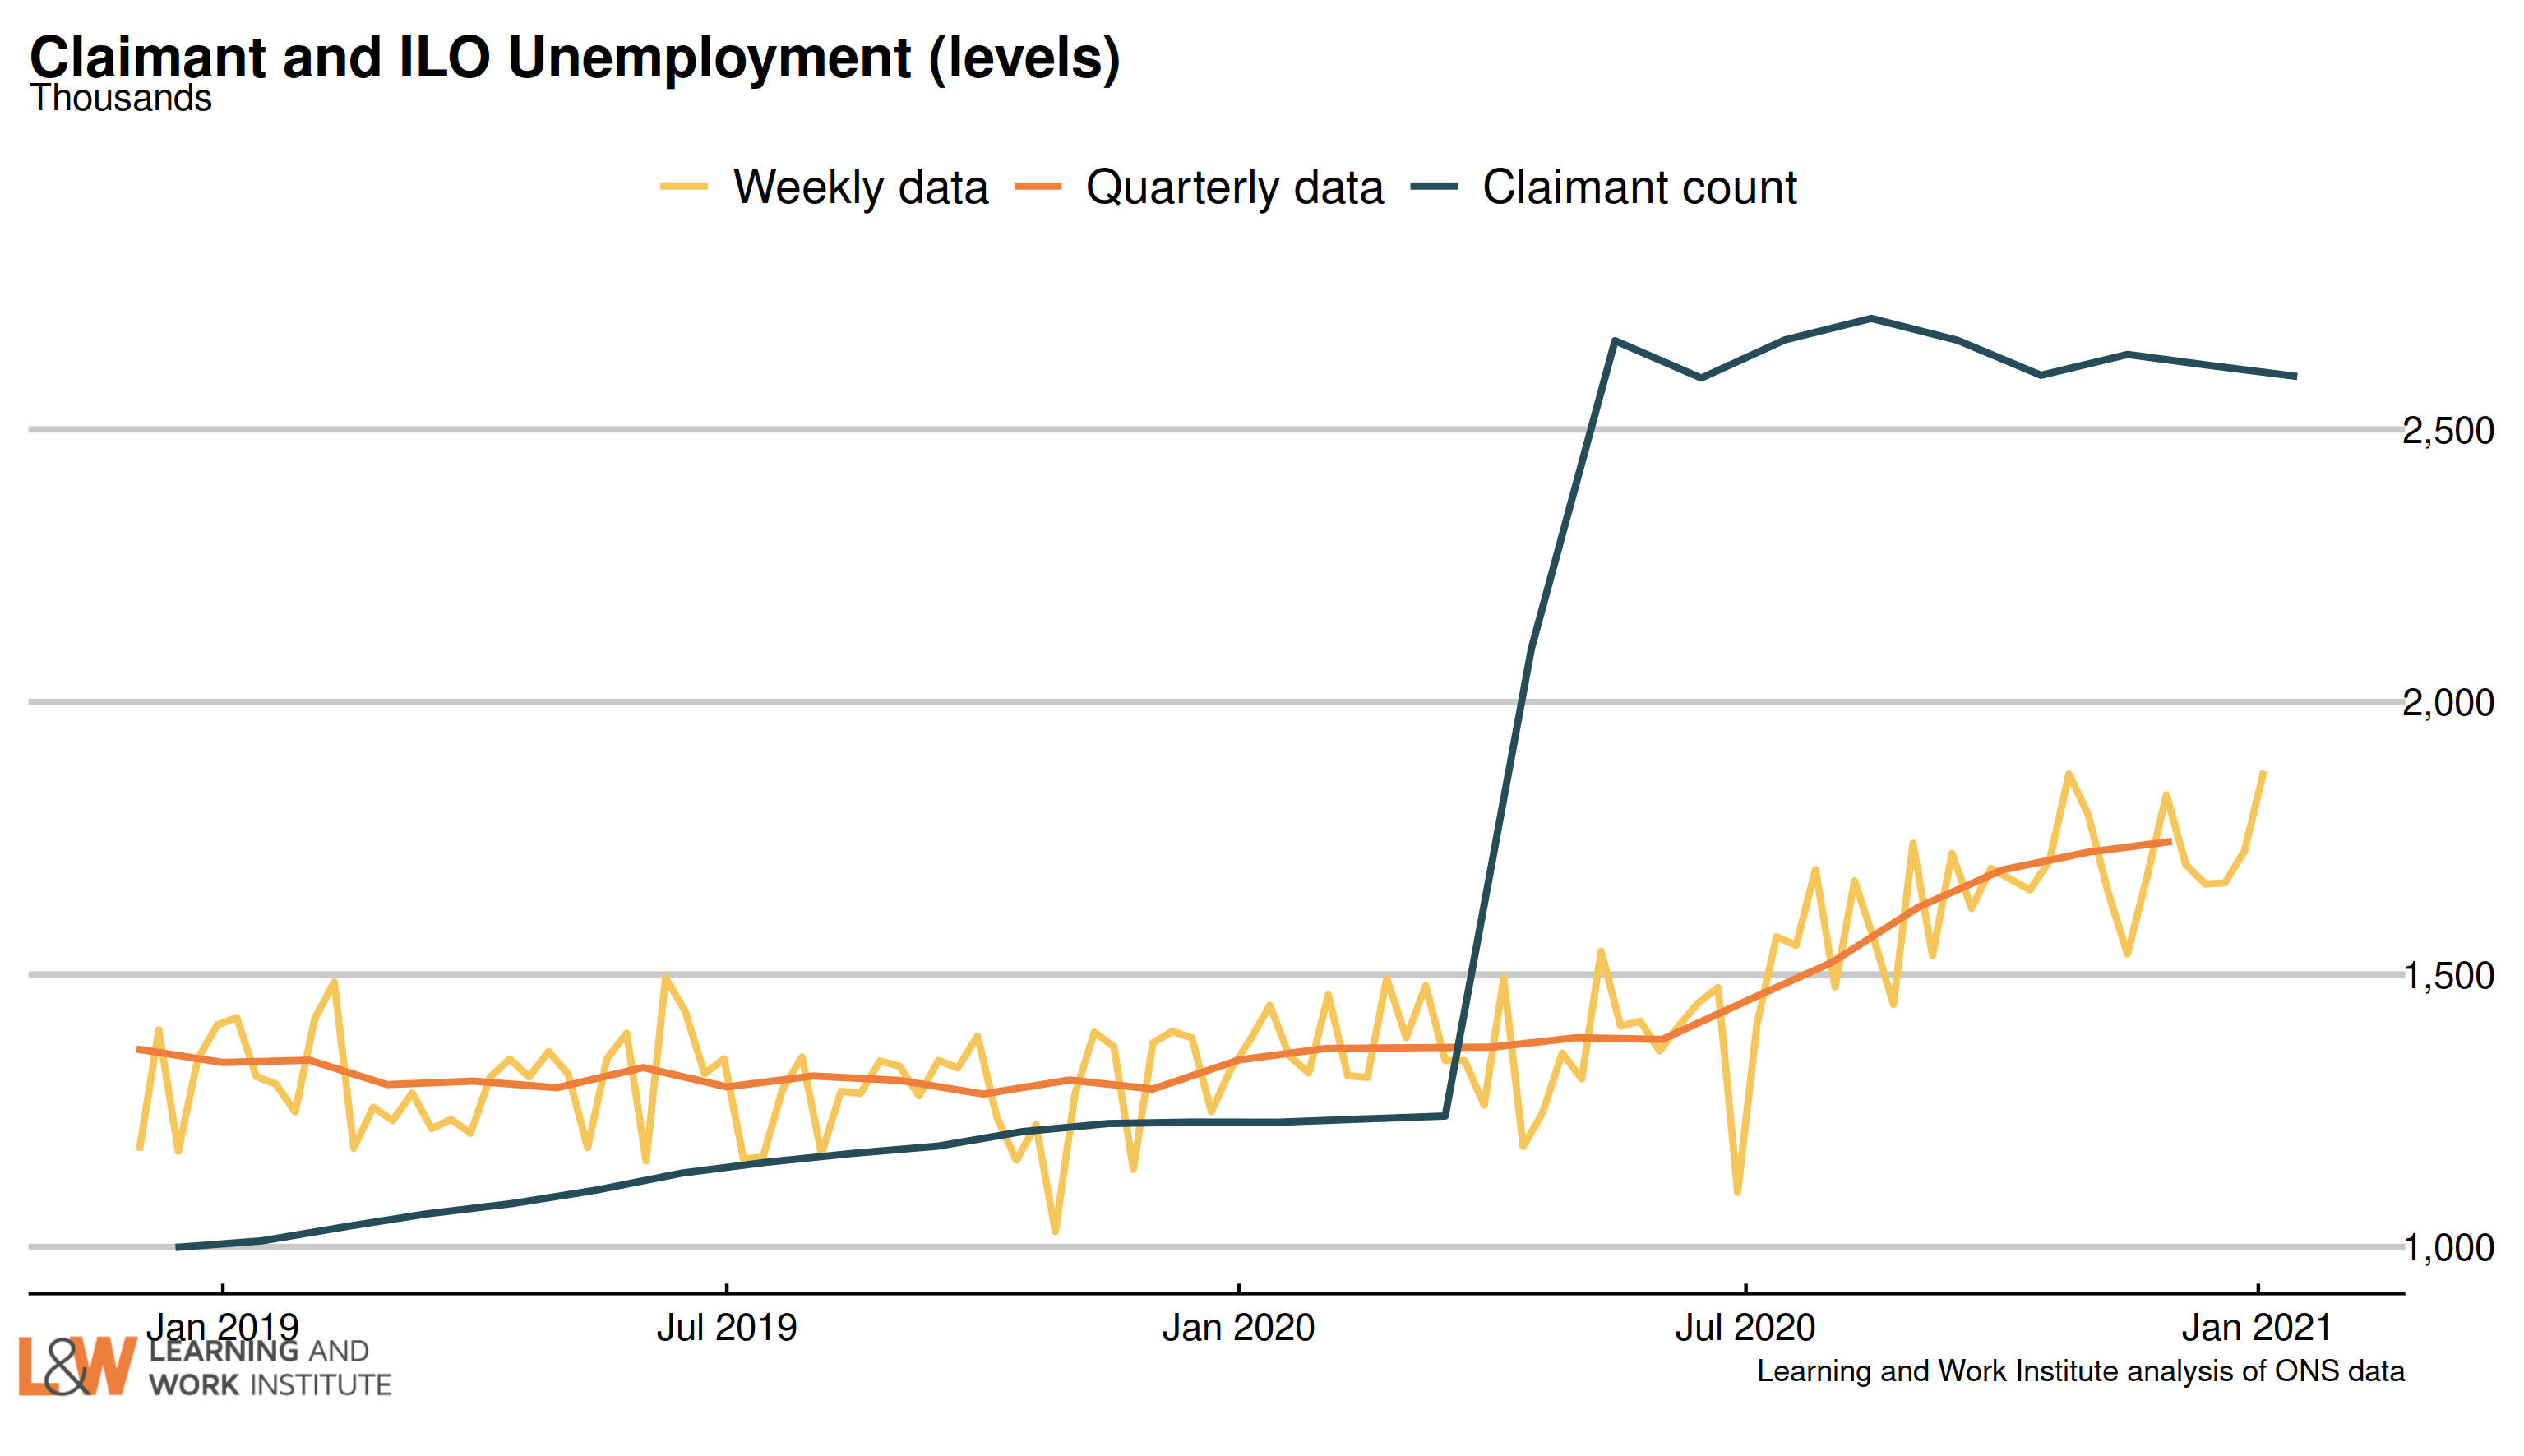 |
|
Chart 3: Youth unemployment
The number of unemployed young people is now 596,000.
Meanwhile, the number of young Universal Credit or Jobseeker’s Allowance claimants is now 514,534. 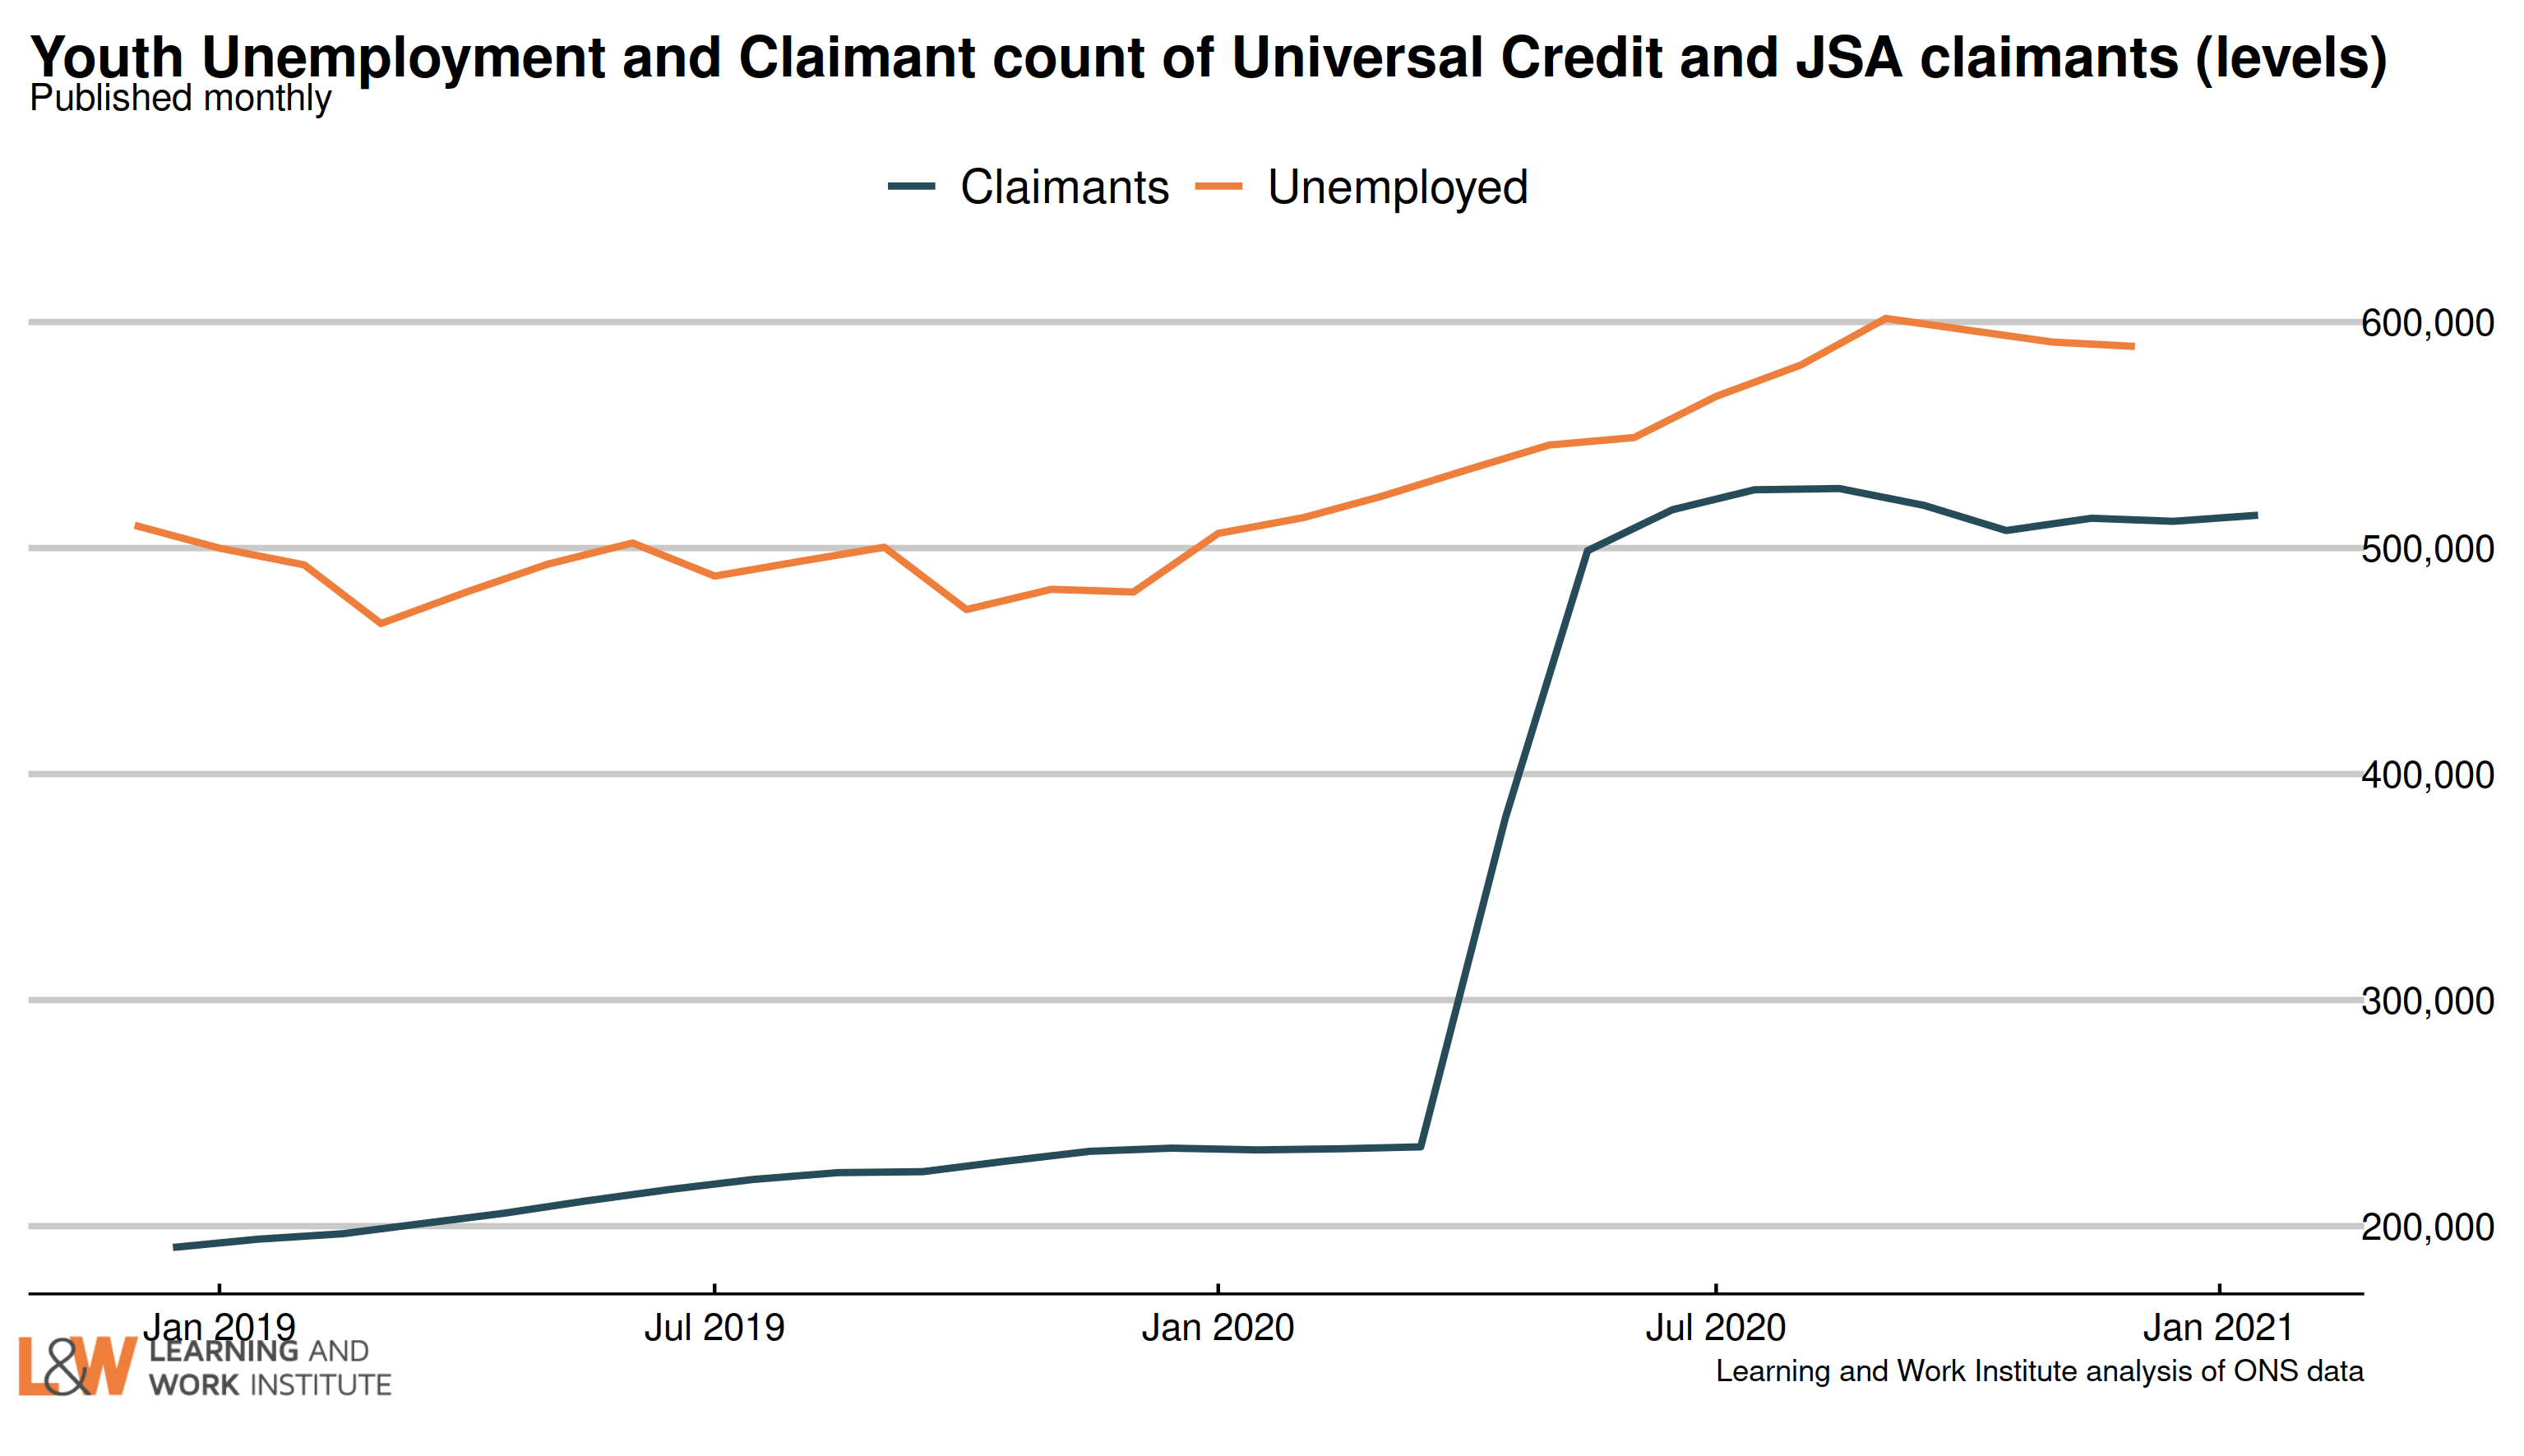 |
|
Chart 4: Young people not in employment, full-time education or training
The number of out of work young people who are not in full-time education (999,000) has risen in the past quarter by 30,000. The rise was largely among the inactive, with the number of unemployed young people not in full-time education or training rising at a lower rate. 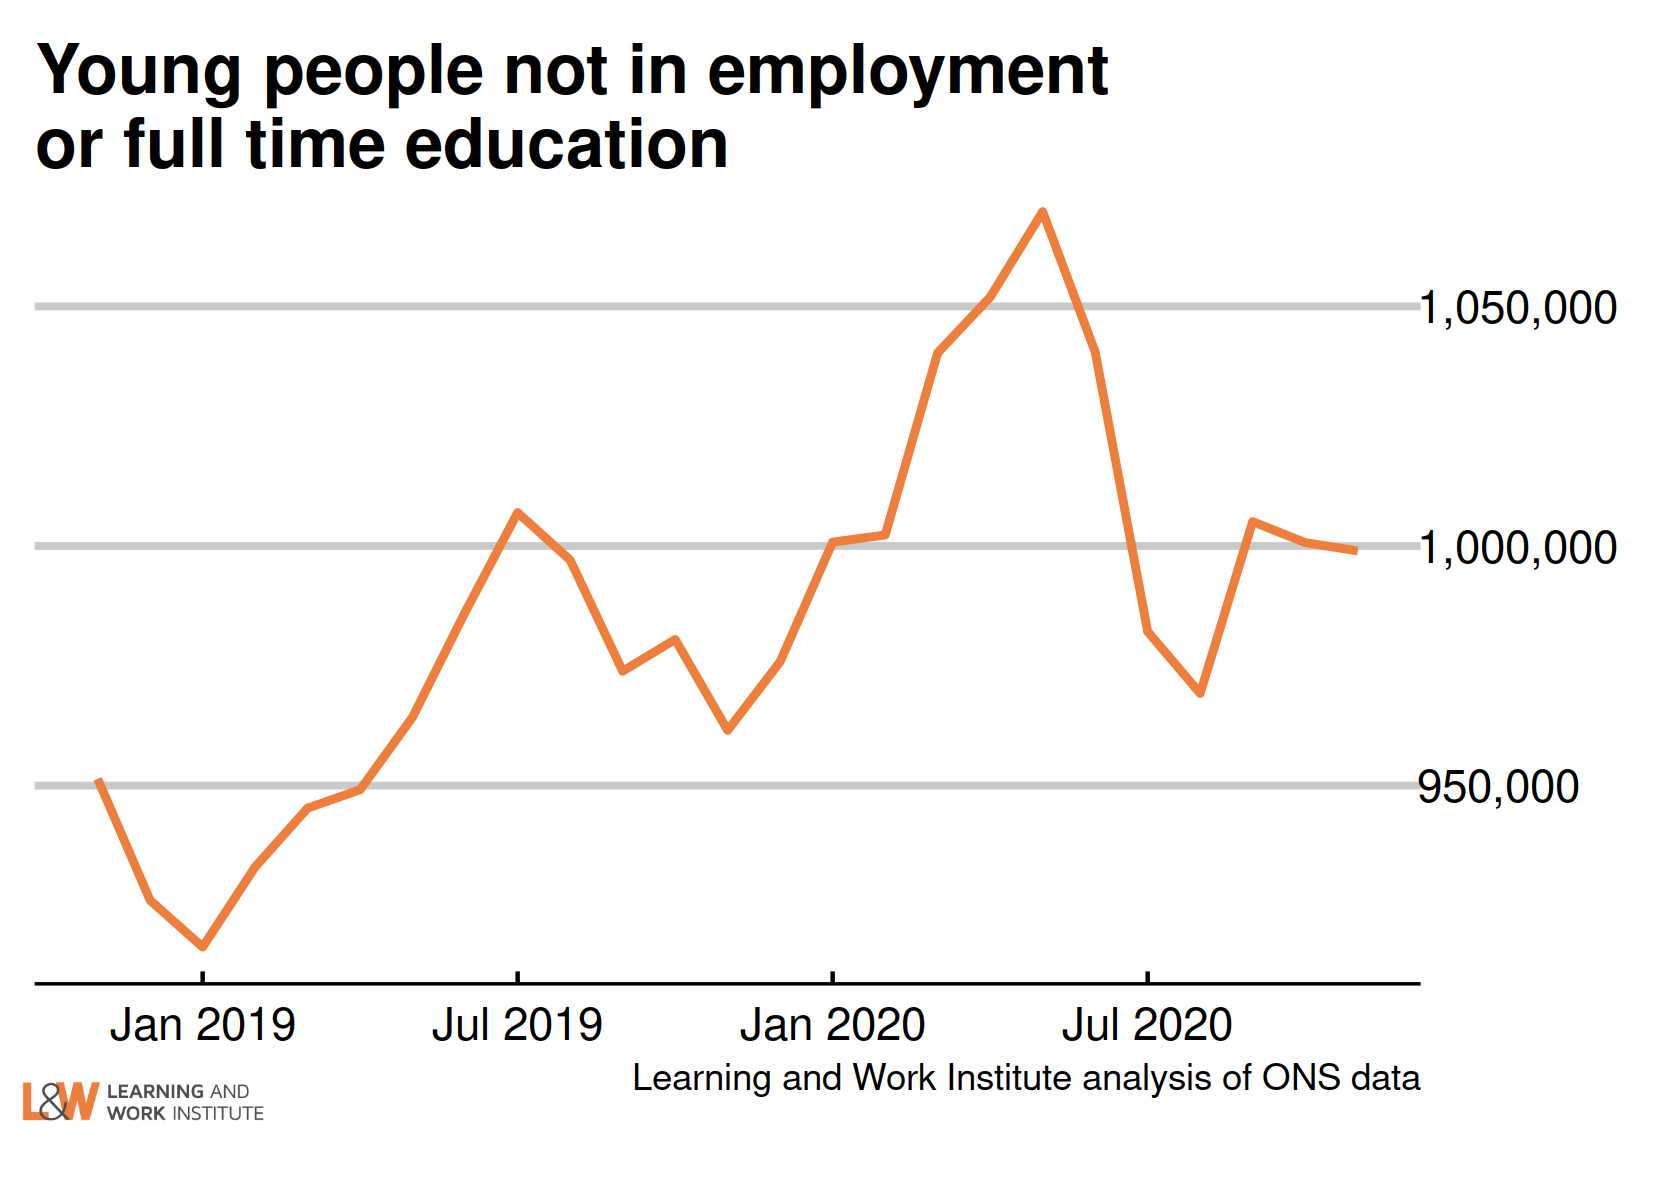 |
|
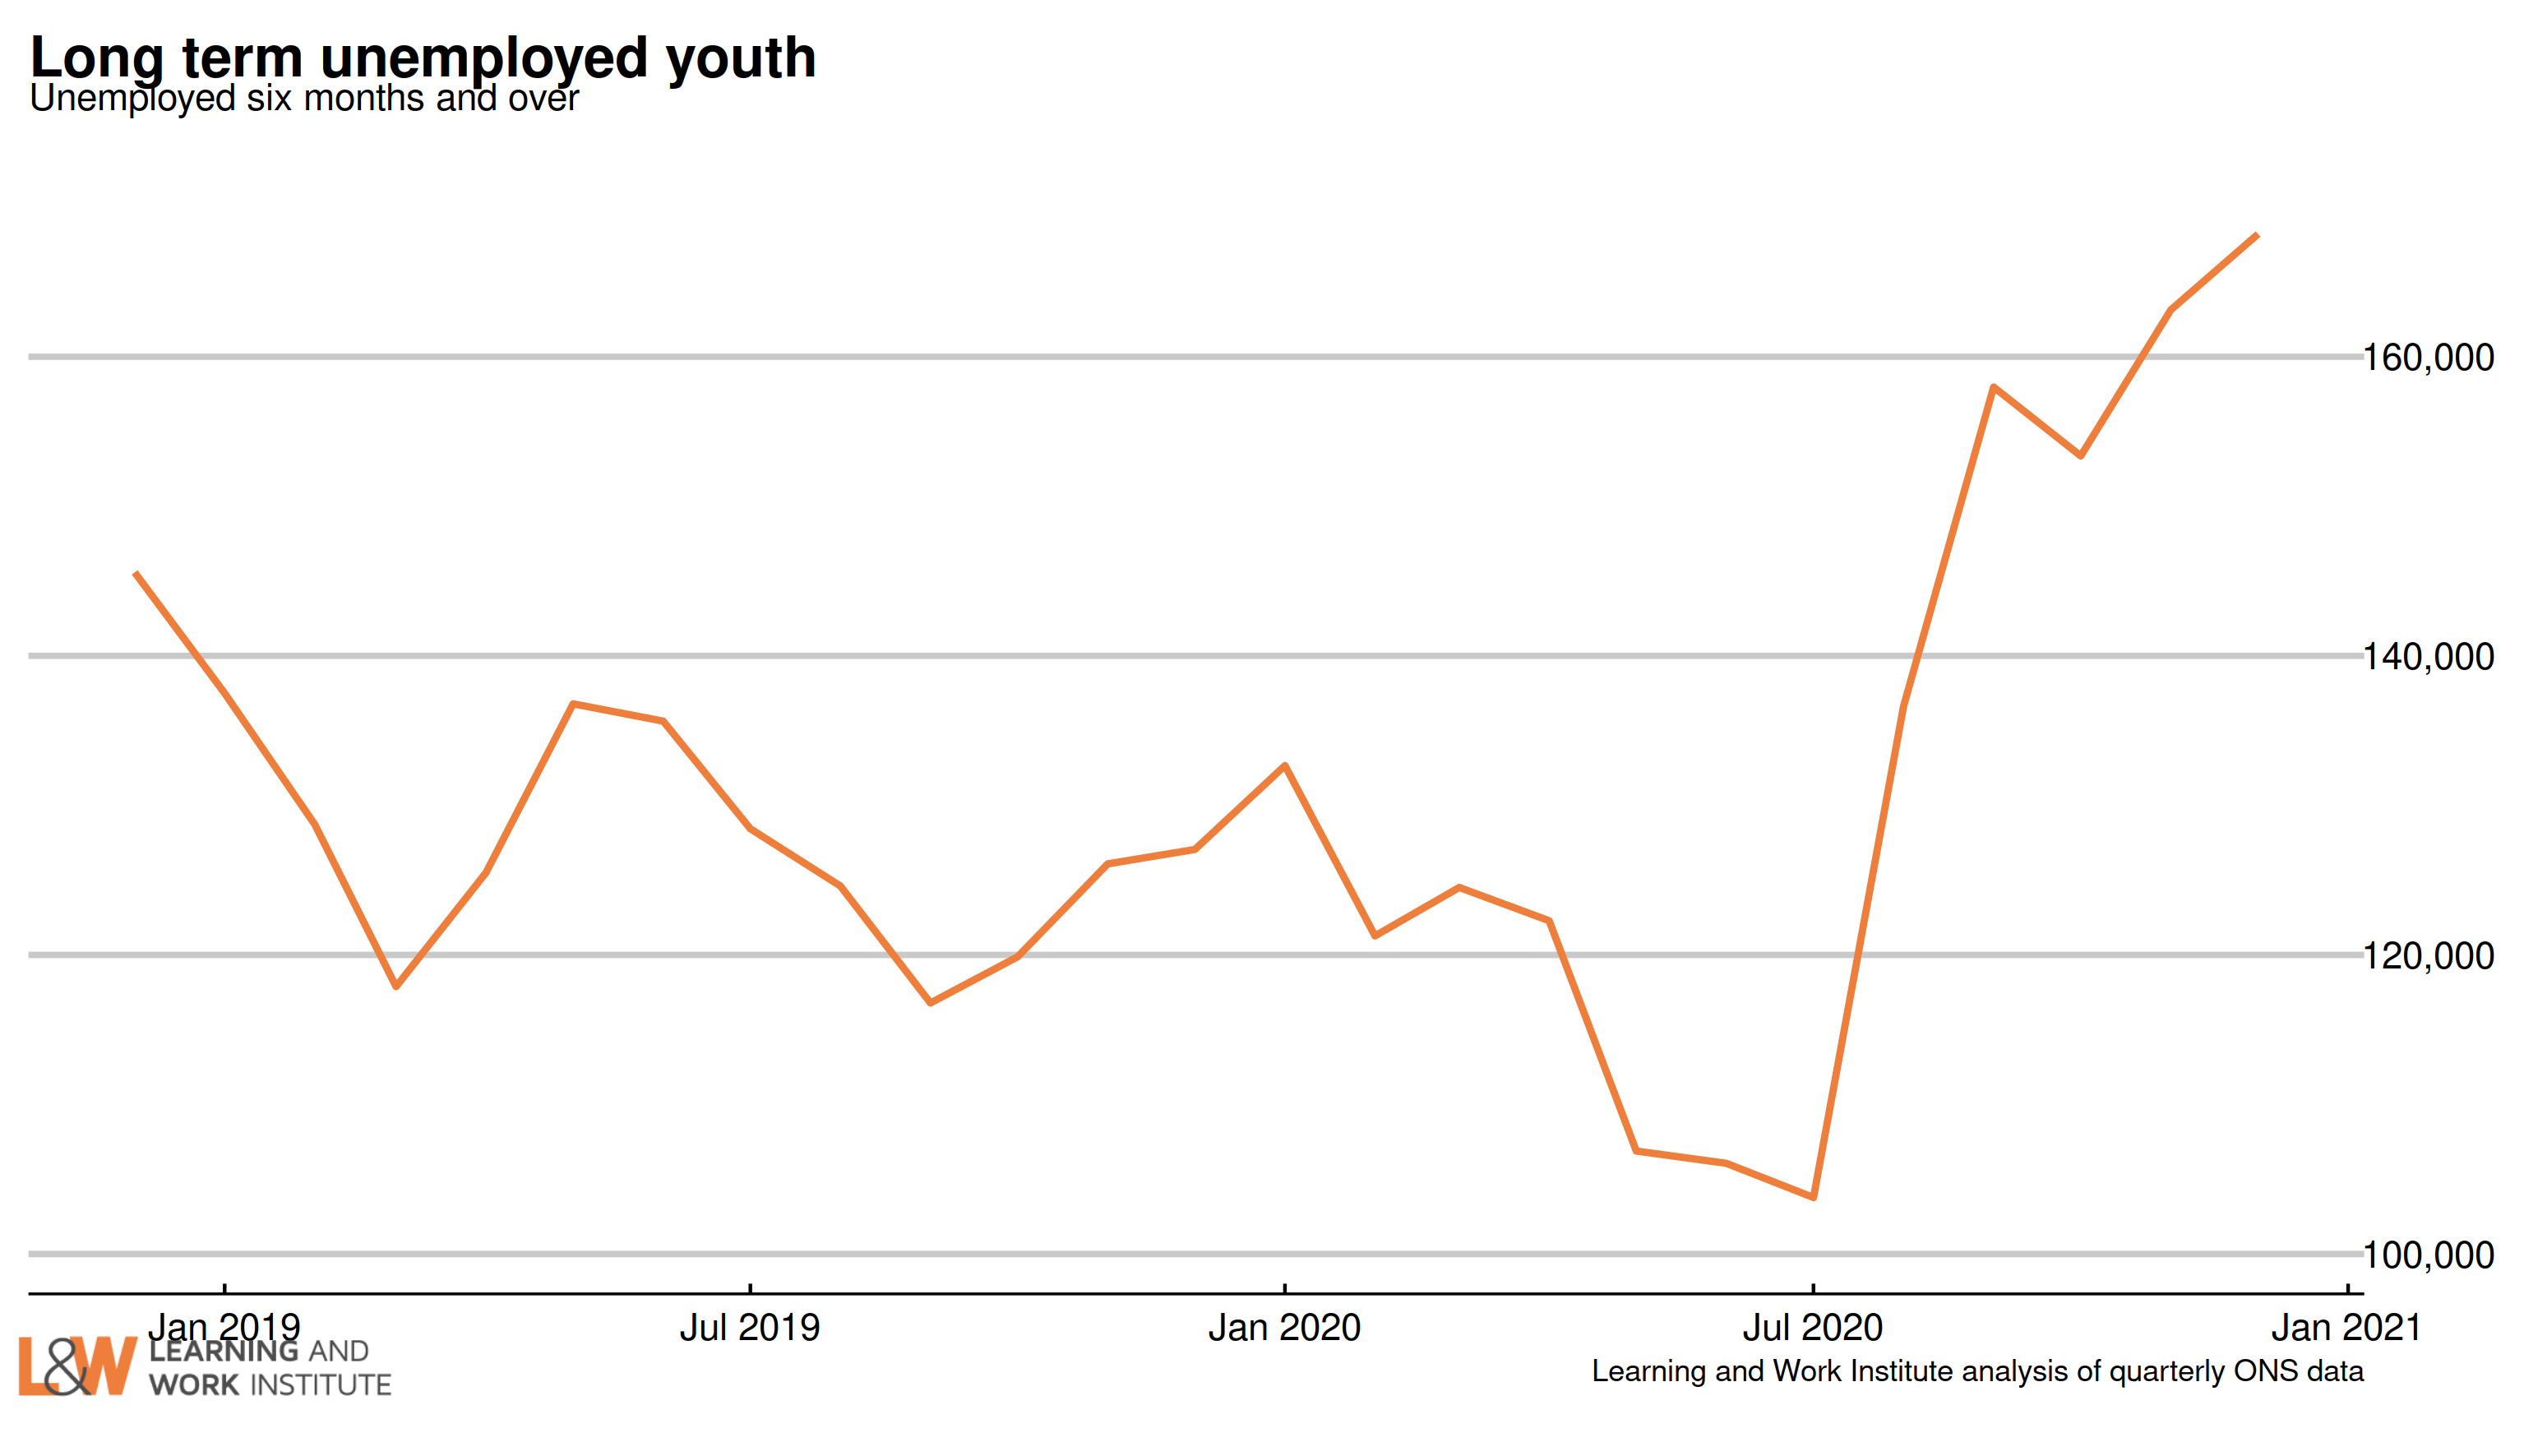
Chart 5: Youth long-term unemployment (six months and over, 18-24)
Youth long-term unemployment (which can include students) has risen by from last month’s figure and is now 196,000.
 |
|
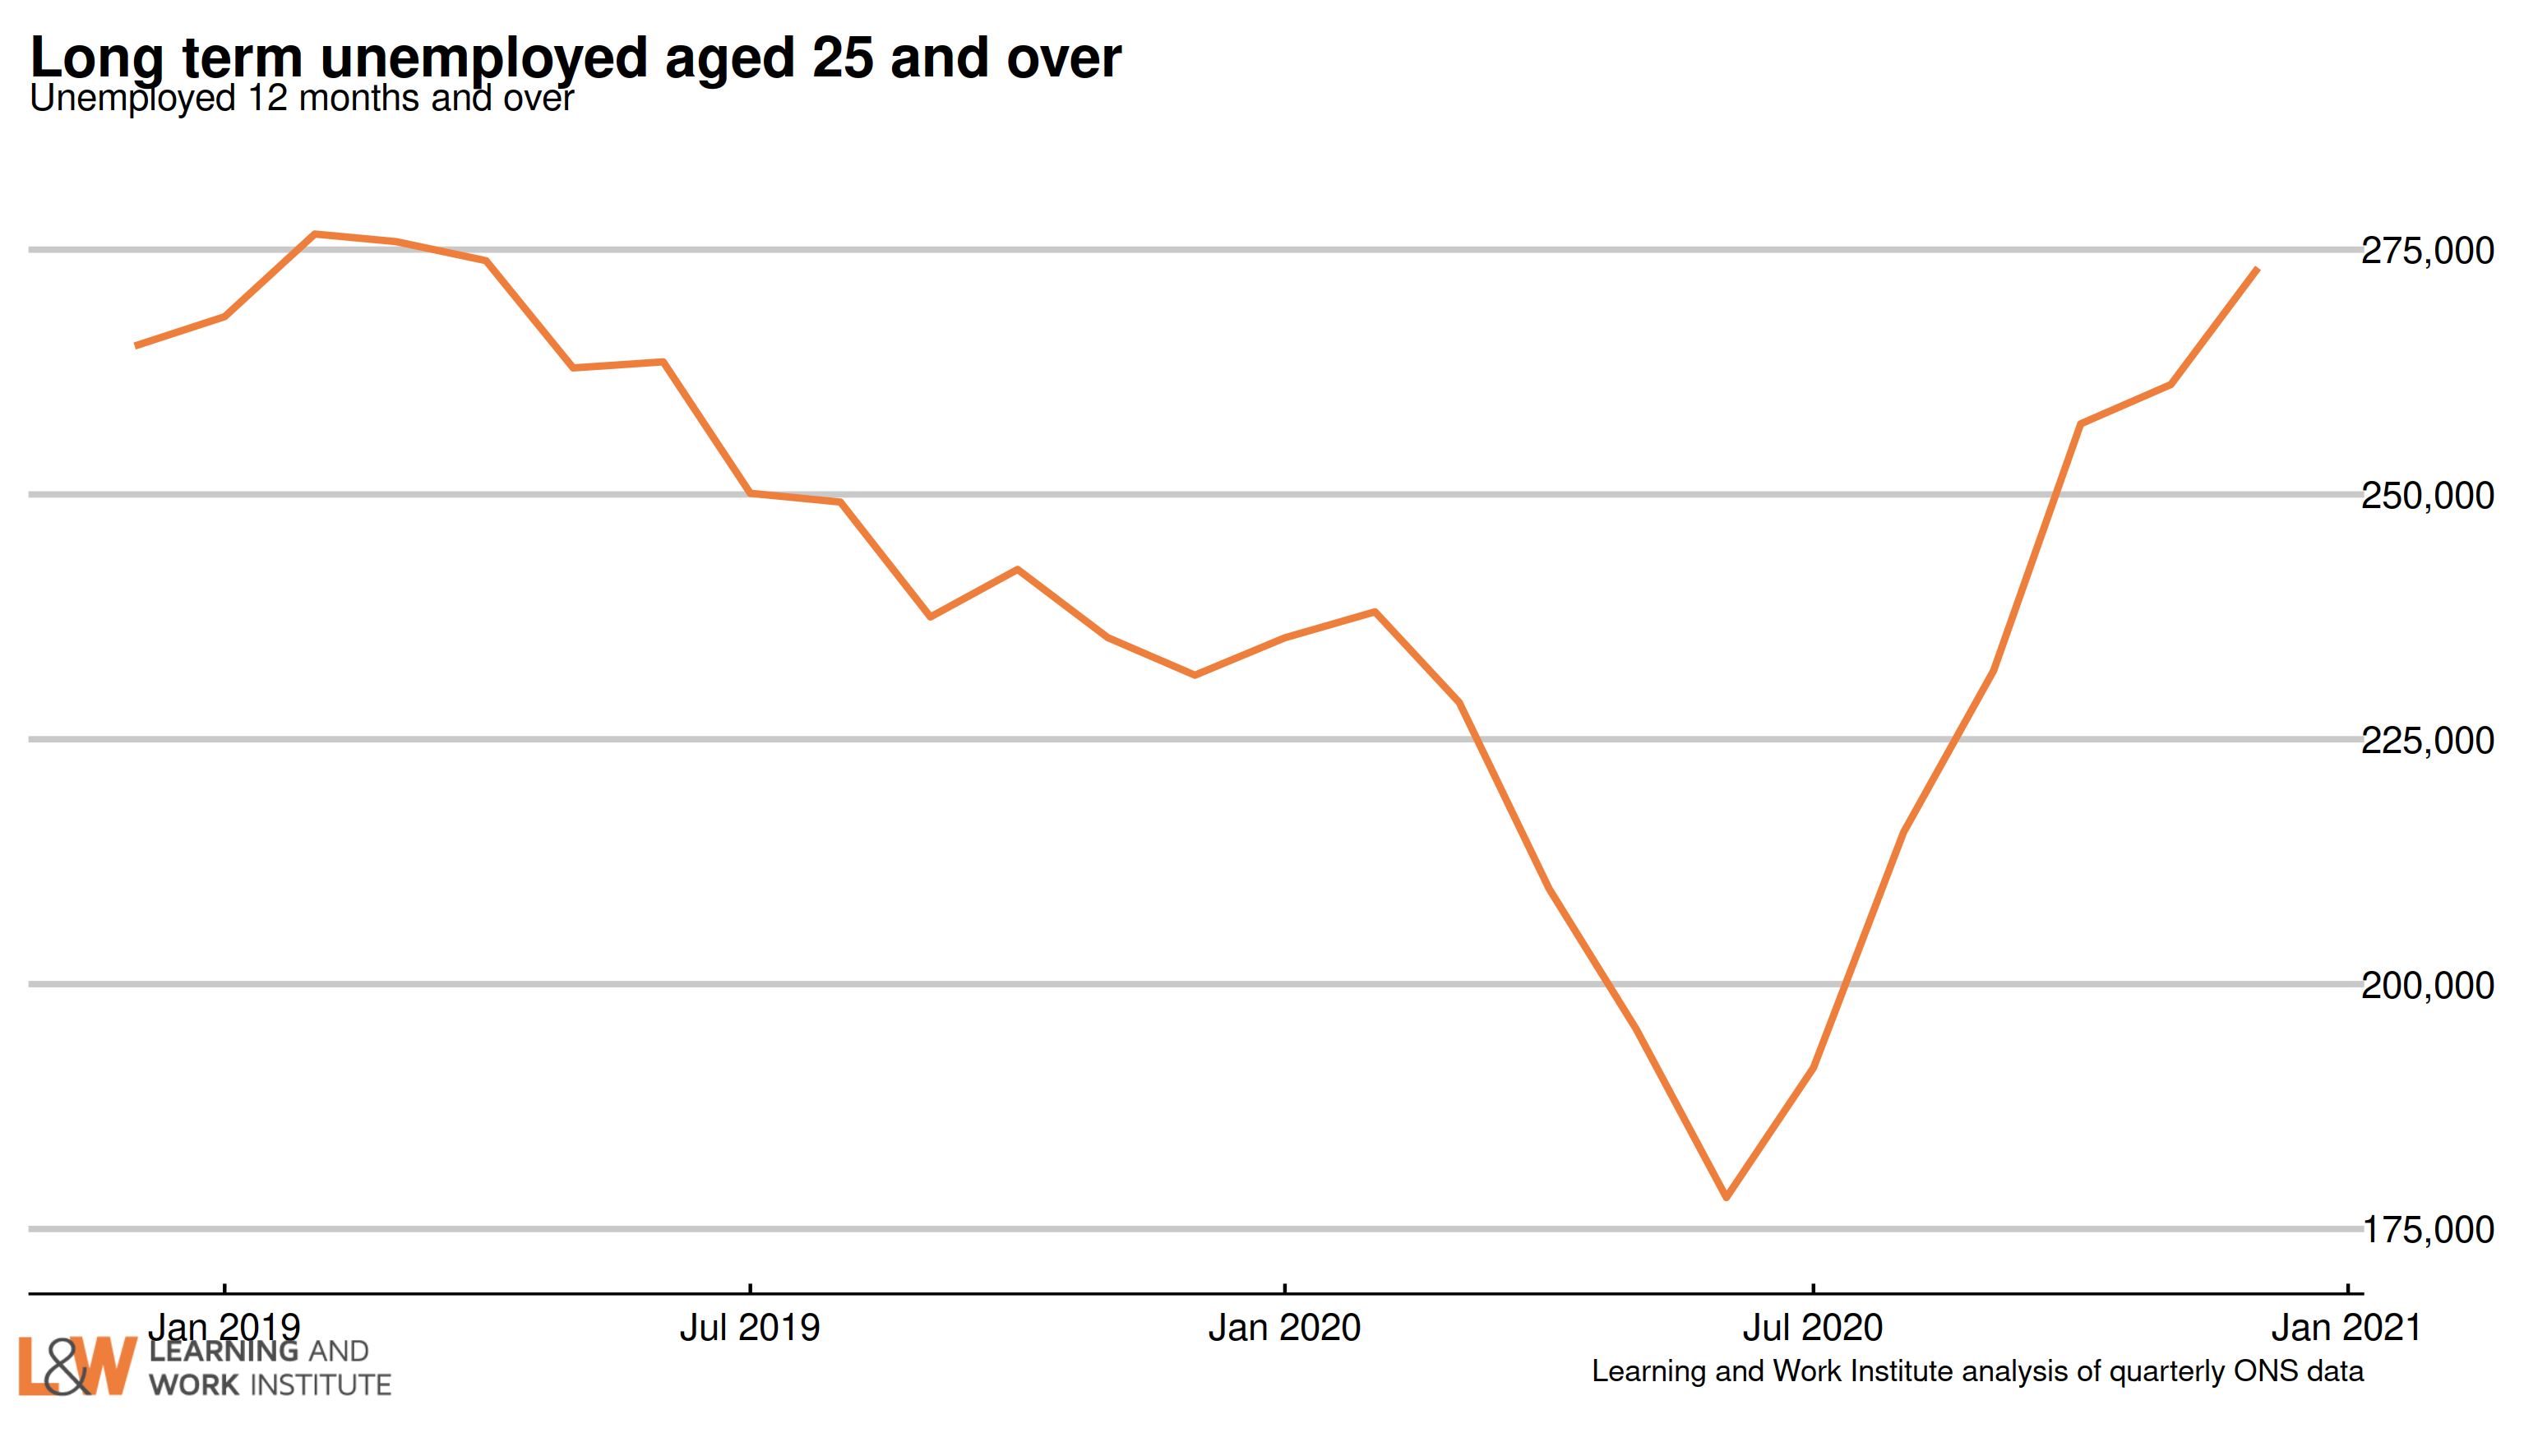
Chart 6: Adult long-term unemployment (12 months and over, 25+)
Adult long-term unemployment on the survey measure is now 273,000. The fall in the first lockdown period of 2020 (April to June 2020) is due to long-term unemployed people stopping looking for work at that time. Later, they resumed looking for work and may have counted their unemployment from when they lost their job, missing out the lockdown period. .
 |
|
Chart 7: Unemployment rates by age
The 18 to 24 year old unemployment rate (including students) is 13.4% of the economically active – excluding one million economically inactive students from the calculation. The rate for those aged 25 to 49 is 3.8%. For those aged 50 and over it is 3.9%. The quarterly change is down 0.2 for 18 to 24 year olds, up 0.4 for 25 to 49 year olds, and up 0.5 for the over-50s. 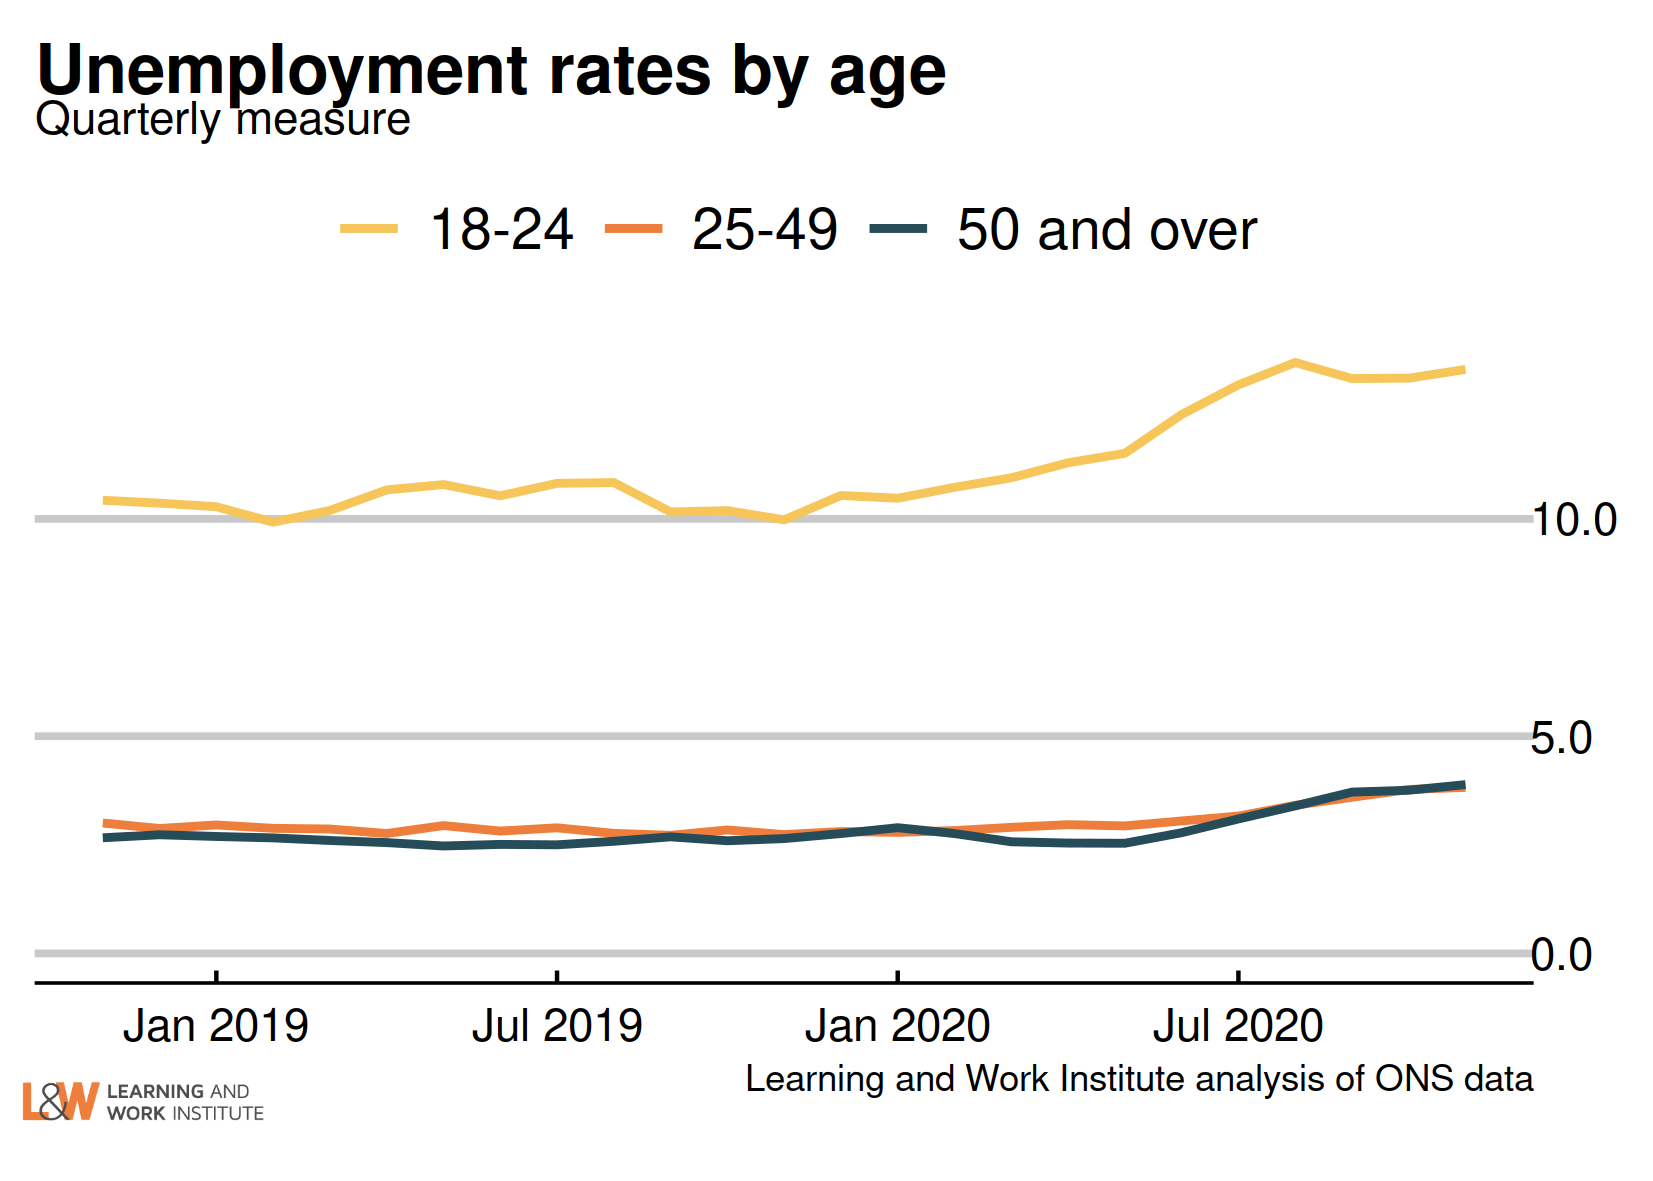 |
|
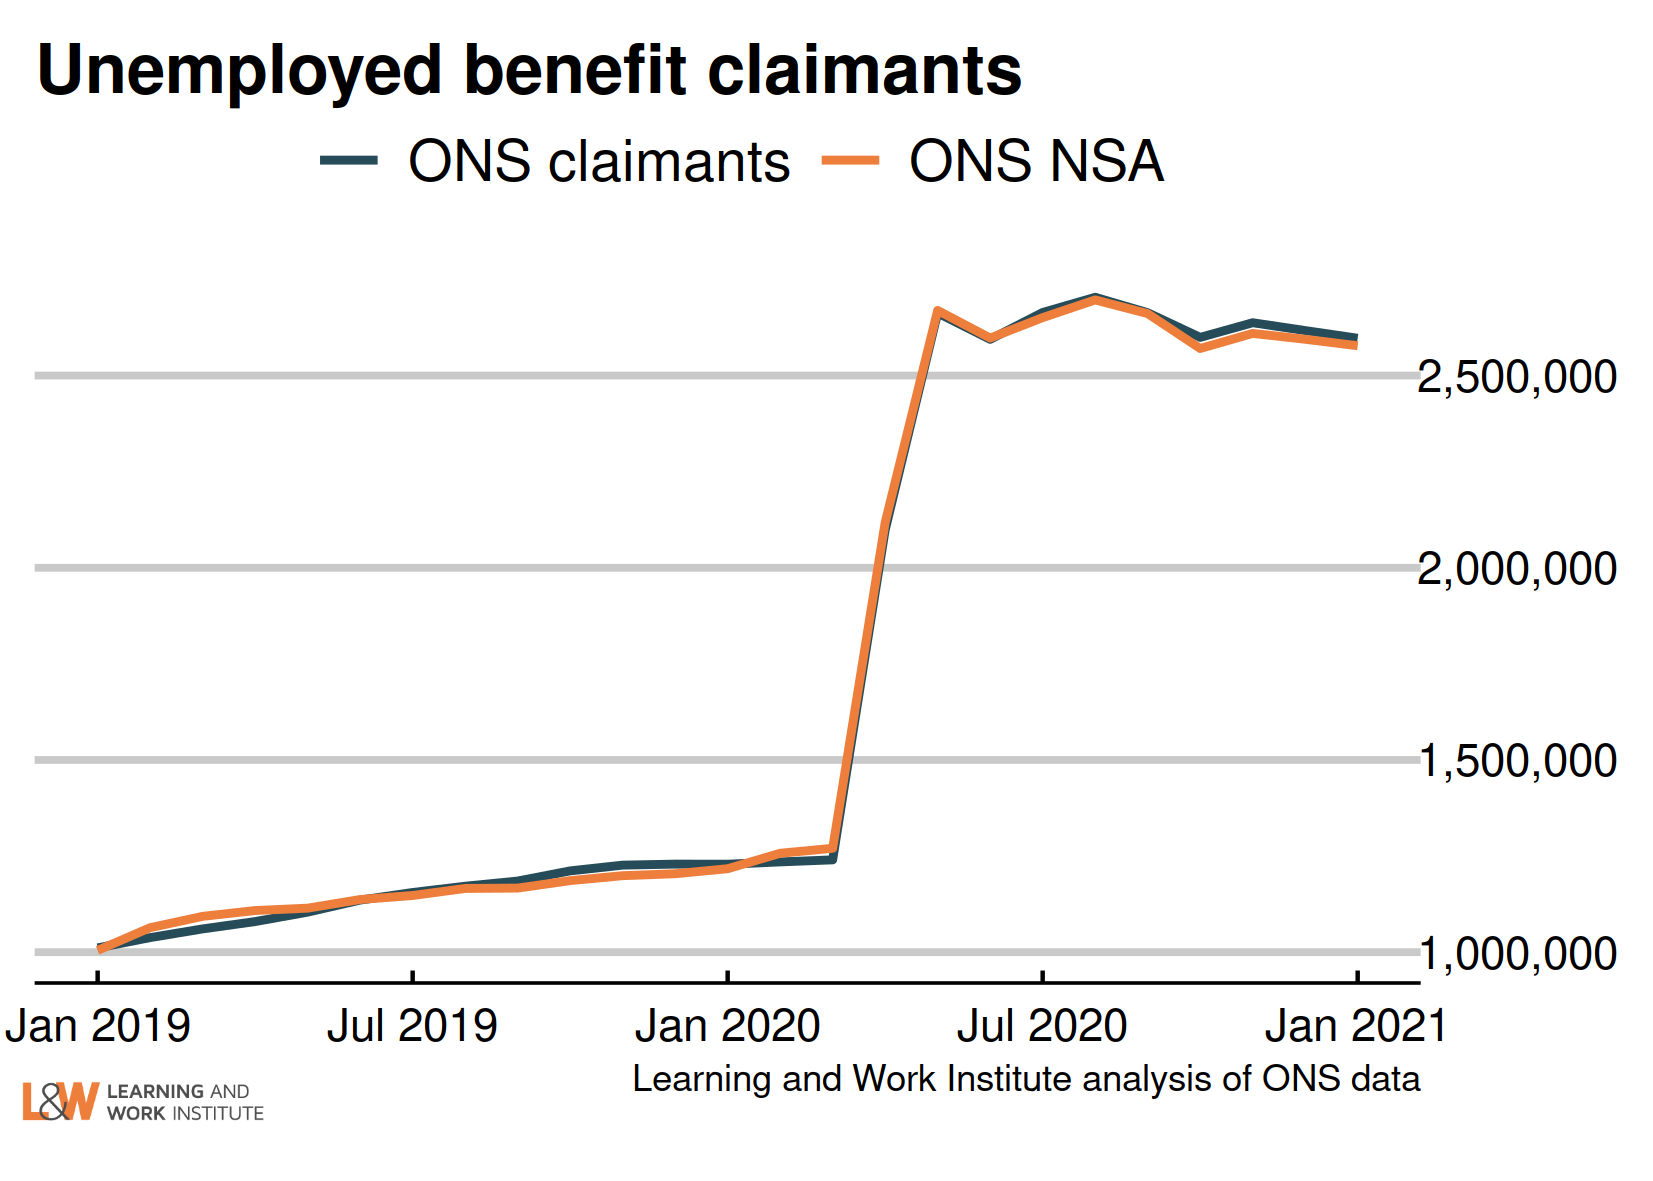
Chart 8: Jobseeker’s Allowance and Universal Credit claimant count
The ONS headline Jobseeker’s Allowance and Universal Credit claimant count has fallen by 20,002 in January, taking the total to 2,597,090.
 |
|
Chart 9: Vacancies – whole economy survey
Headline vacancies rose slightly this month, to 599,000. The ONS' experimental single-month vacancy figures shows a fall of 71,000 between October and January. The headline ONS vacancy figure is both seasonally adjusted and a three-month average. The chart shows both series. 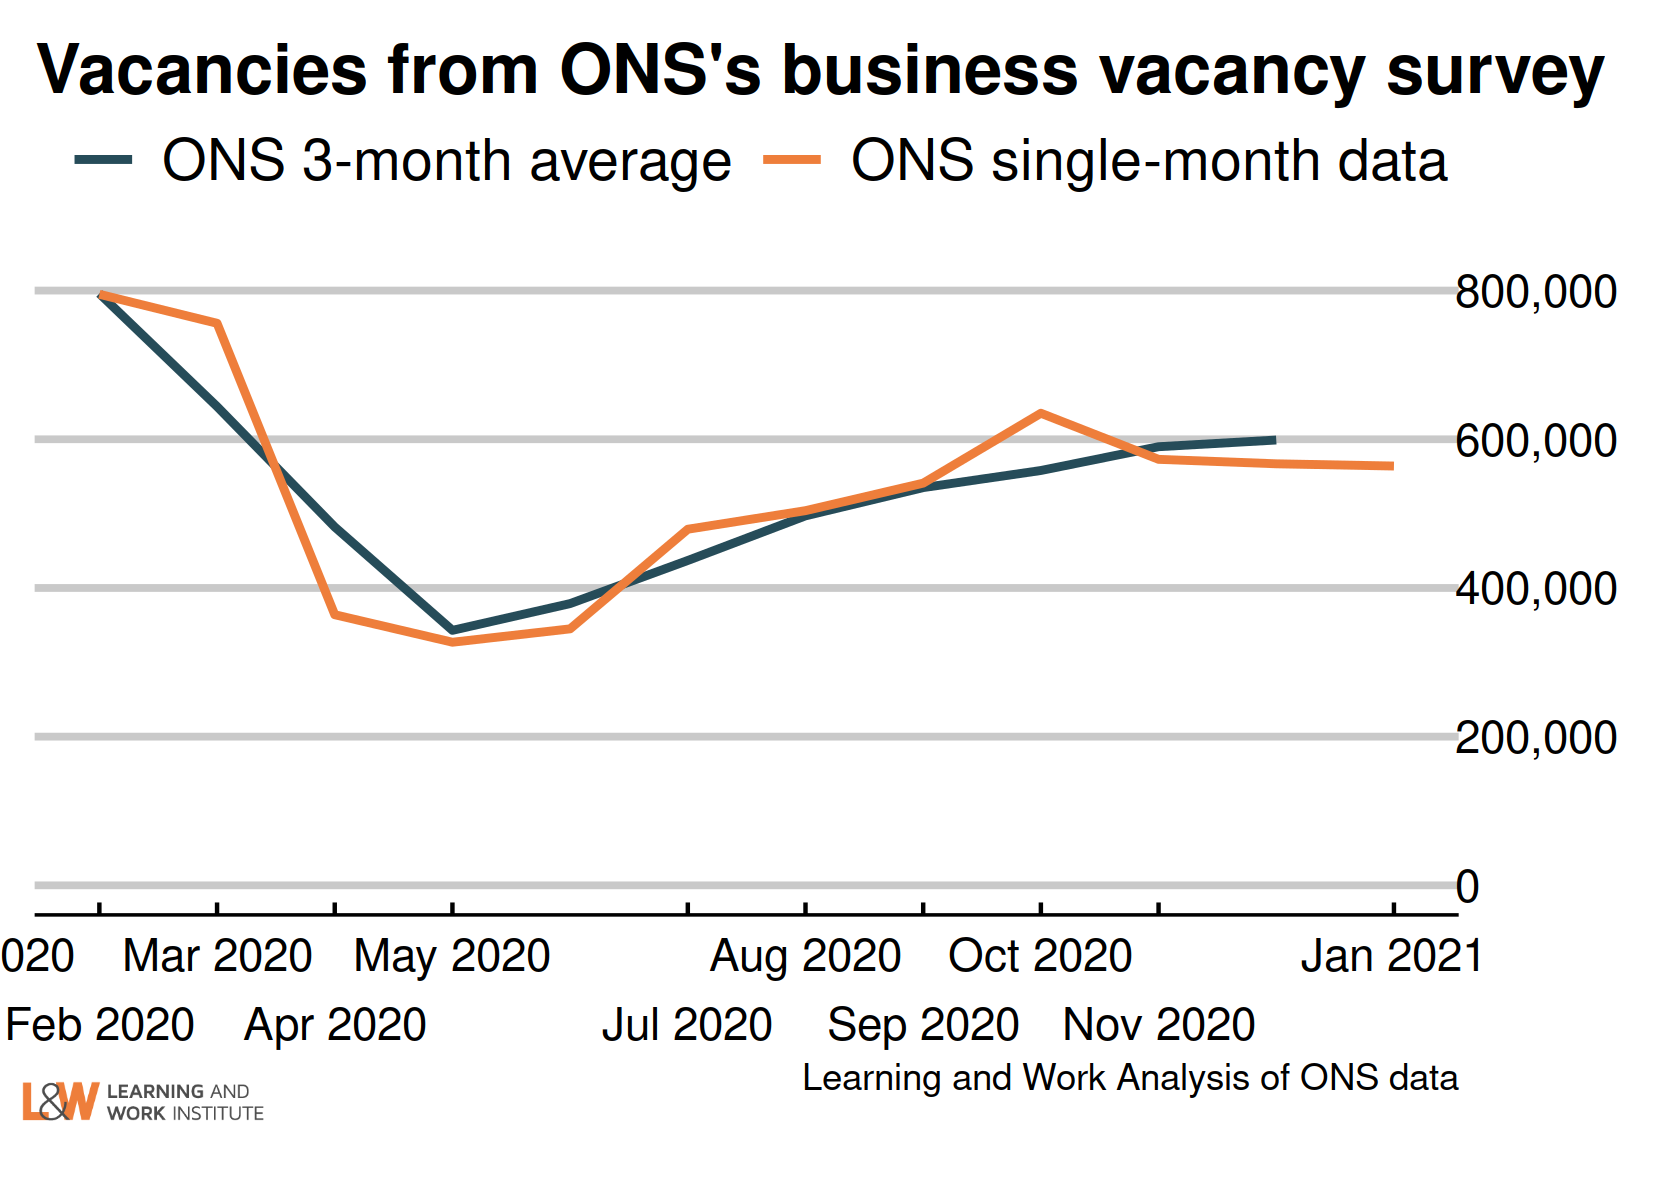 |
 |
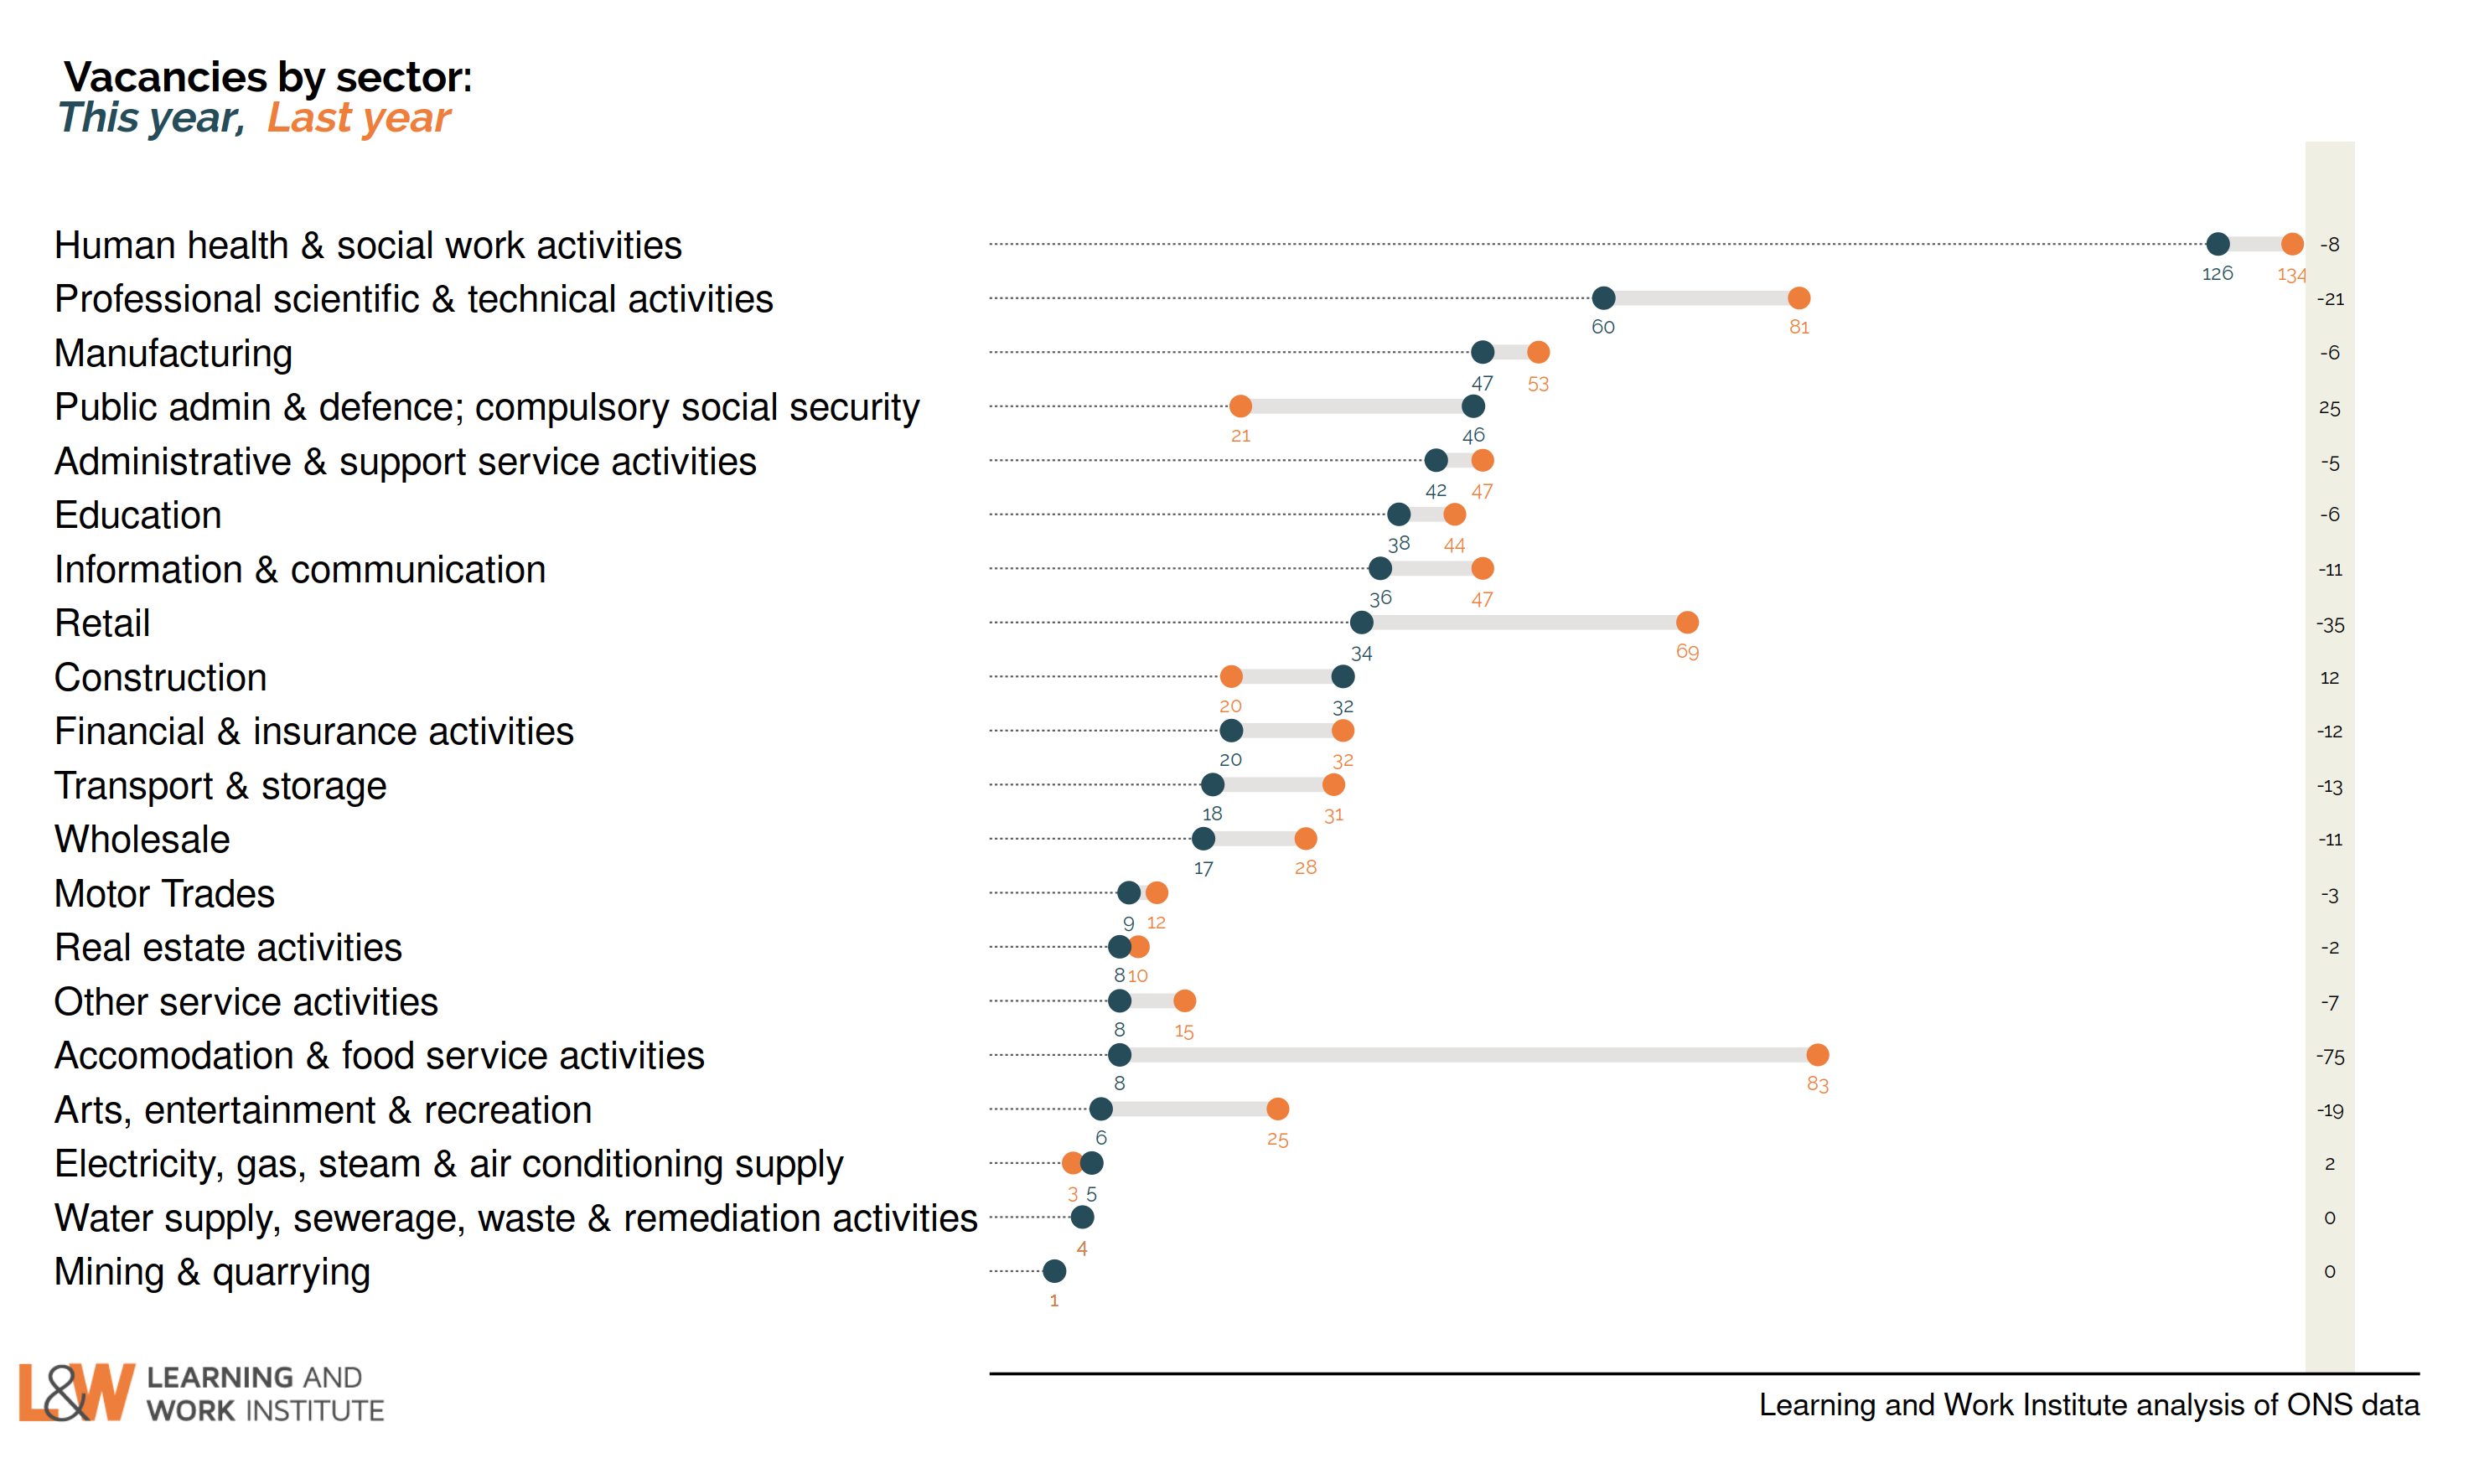
Chart 10: Experimental single month vacancies – whole economy survey
The Office for National Statistics experimental single month vacancy estimates include sectoral information. As these are not seasonally adjusted, it is better to look at annual changes. The numbers are thousands of vacancies, under each number, and on the right, the annual change in thousands of vacancies.
 |
|
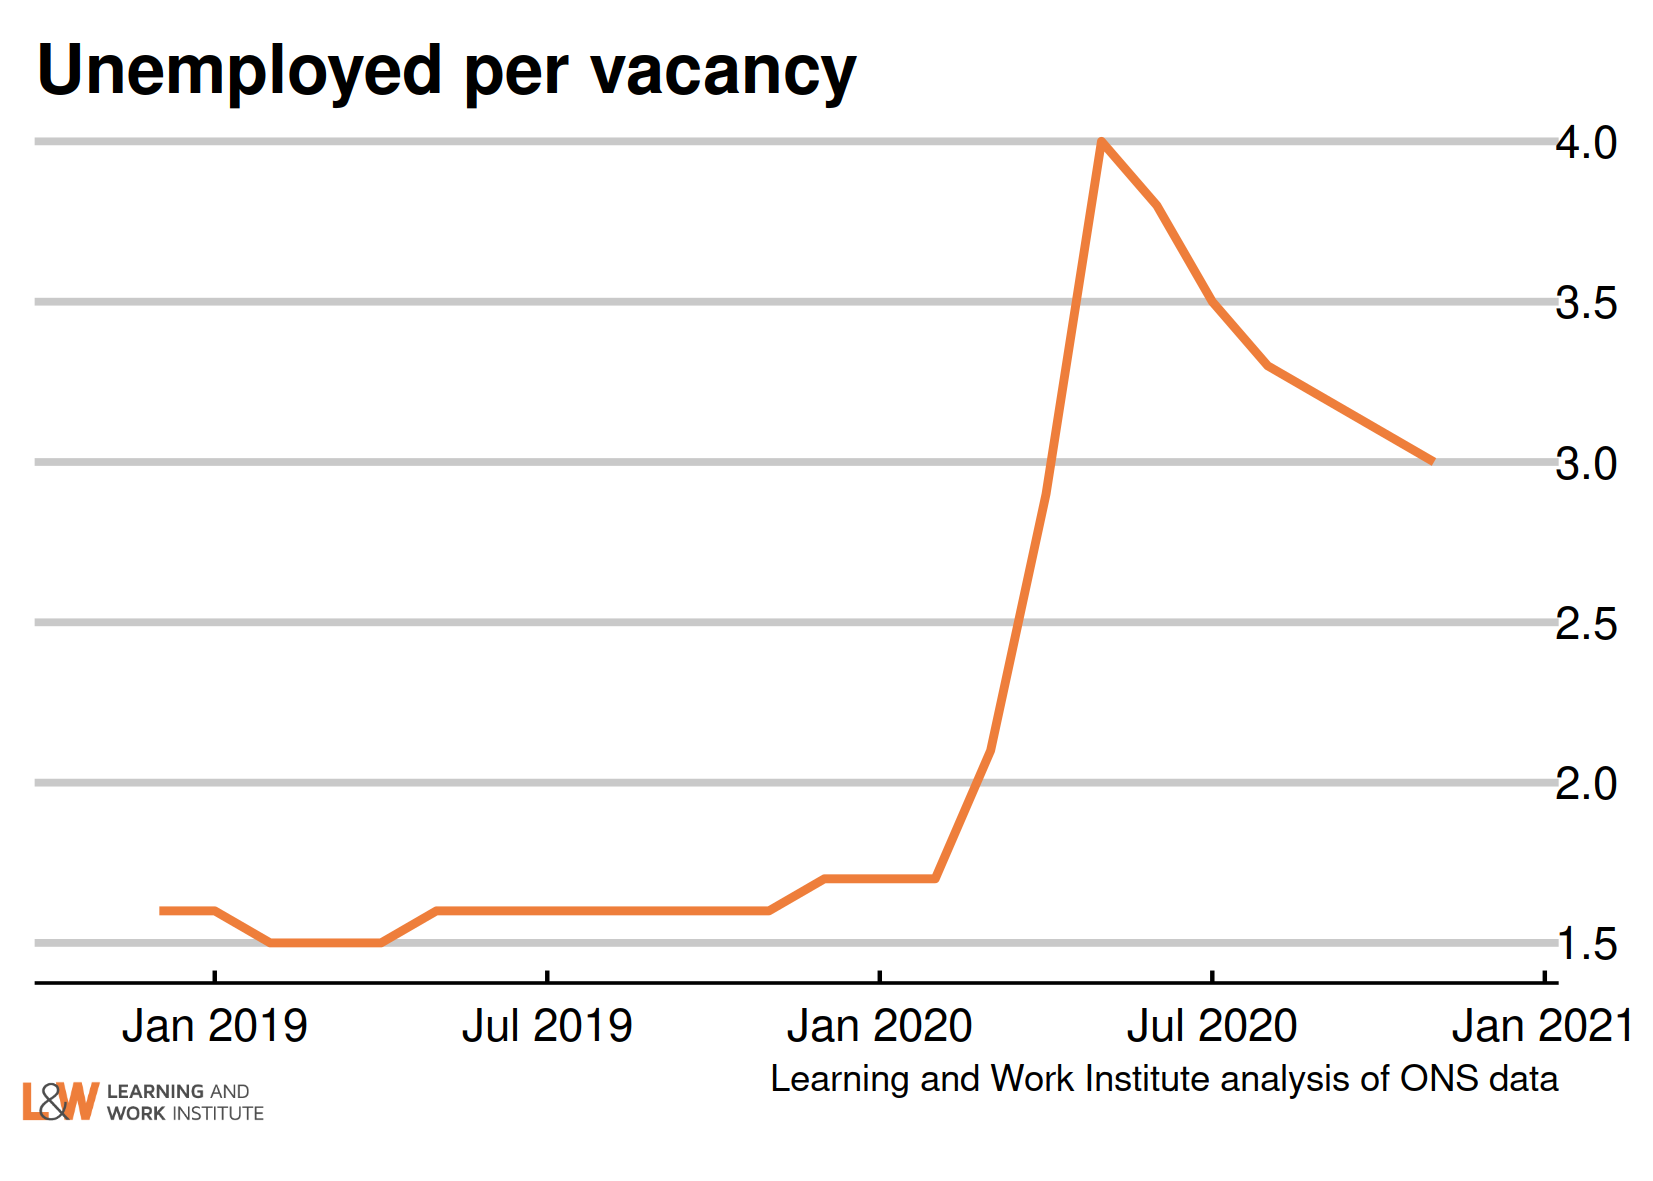
Chart 11: Unemployed people per vacancy
There are 3.0 unemployed people per vacancy. This has fallen back as the number of vacancies has risen, despite increasing numbers of unemployed.
 |
|
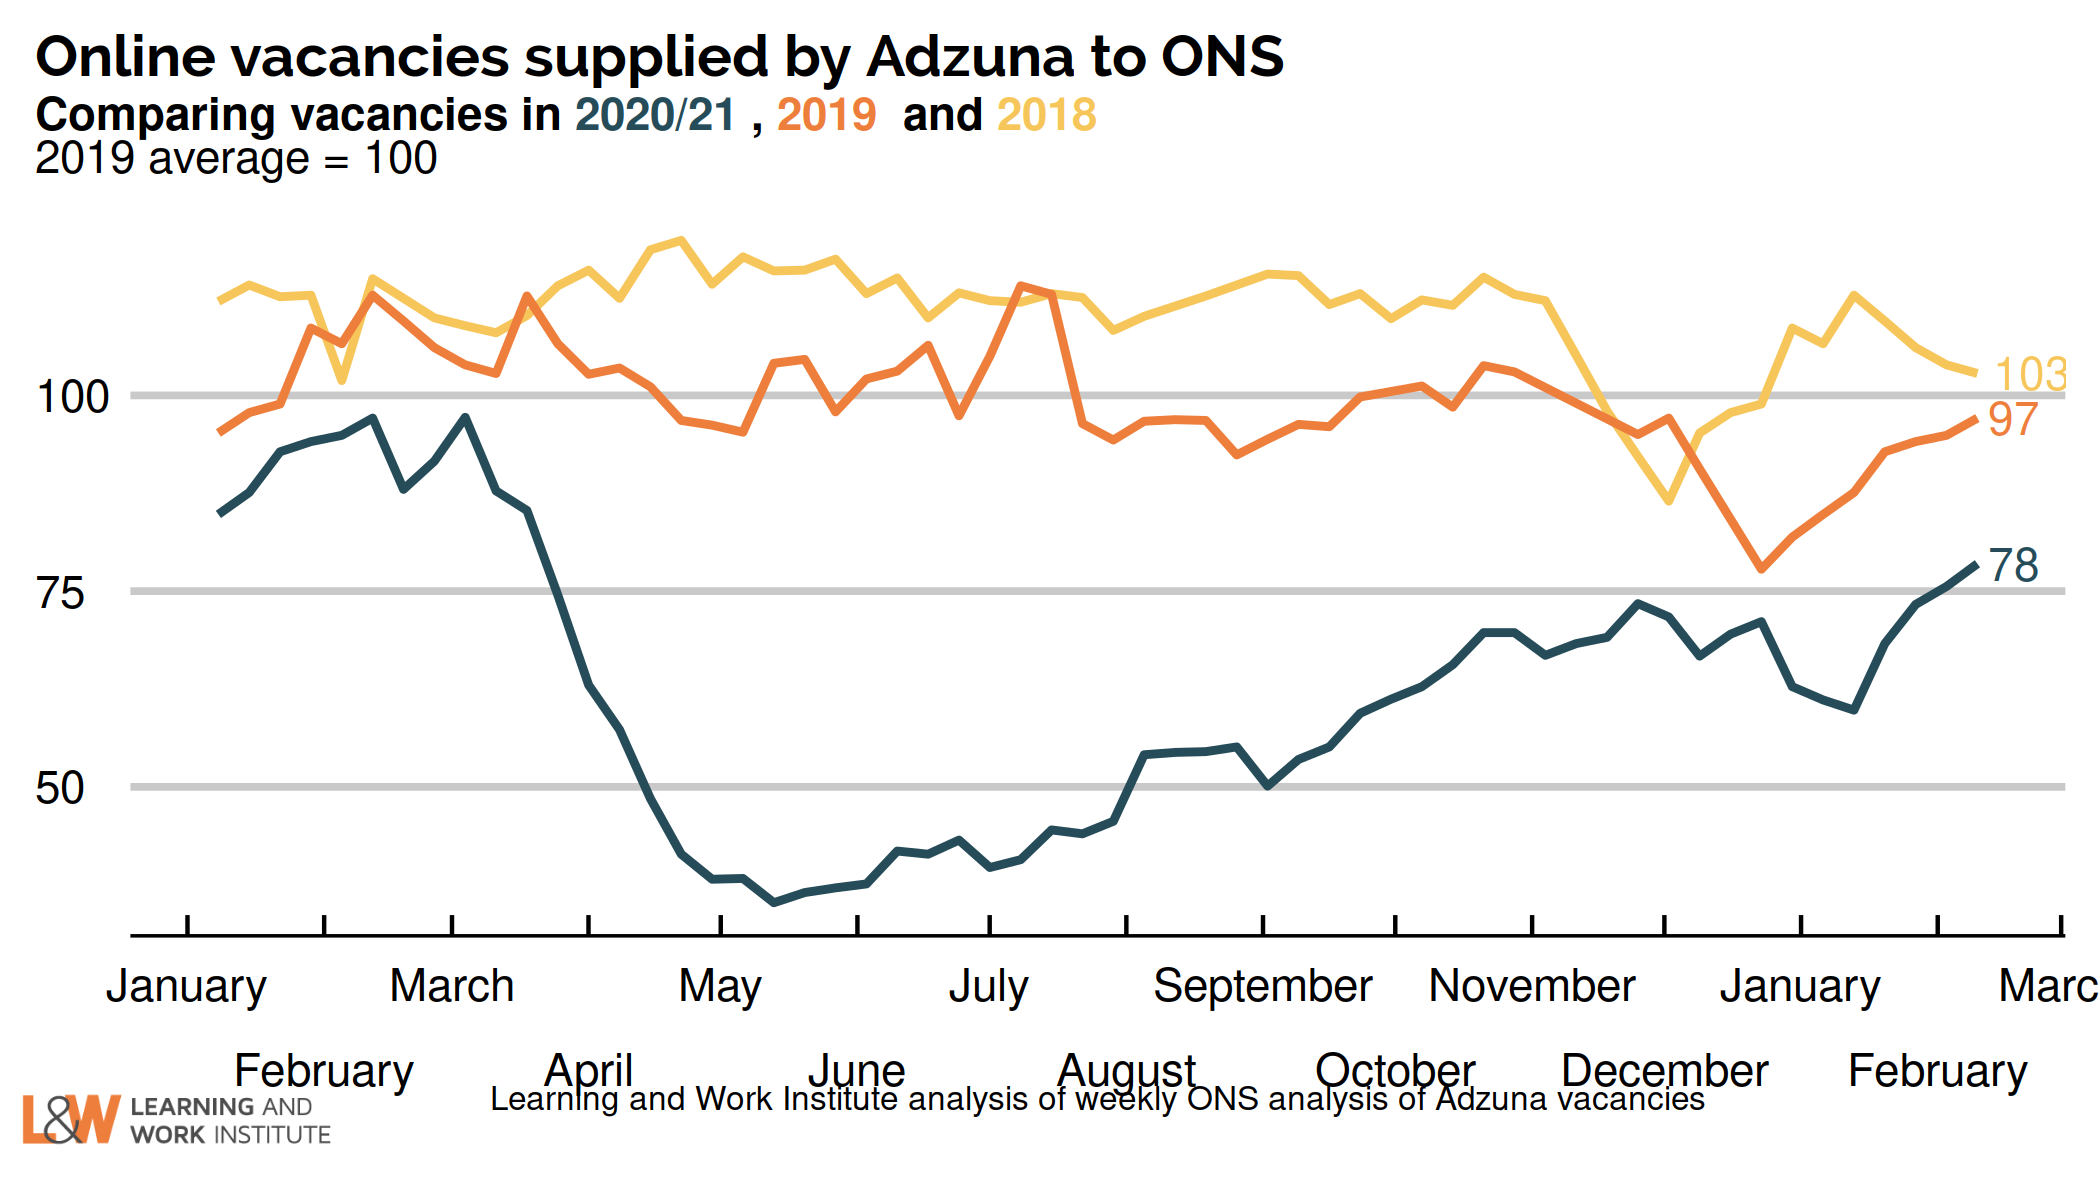
Chart 12: Online vacancies to the early December from Adzuna
Job vacancies dropped to below half of the 2019 average following lockdown. ONS analysis suggests that it was this reduced hiring that led to falls in employment, rather than increased job loss. There had been a gradual increase as the lockdown had eased, but the number of online vacancies captured by Adzuna at the start of February was just 78% of pre-crisis levels.
 |
|
Chart 13: UK employment
Employment has fallen by 110,000 on the figure published last month, to 32,393,000. The chart shows both the official figures and the experimental weekly figures. The trend is likely to be downwards. 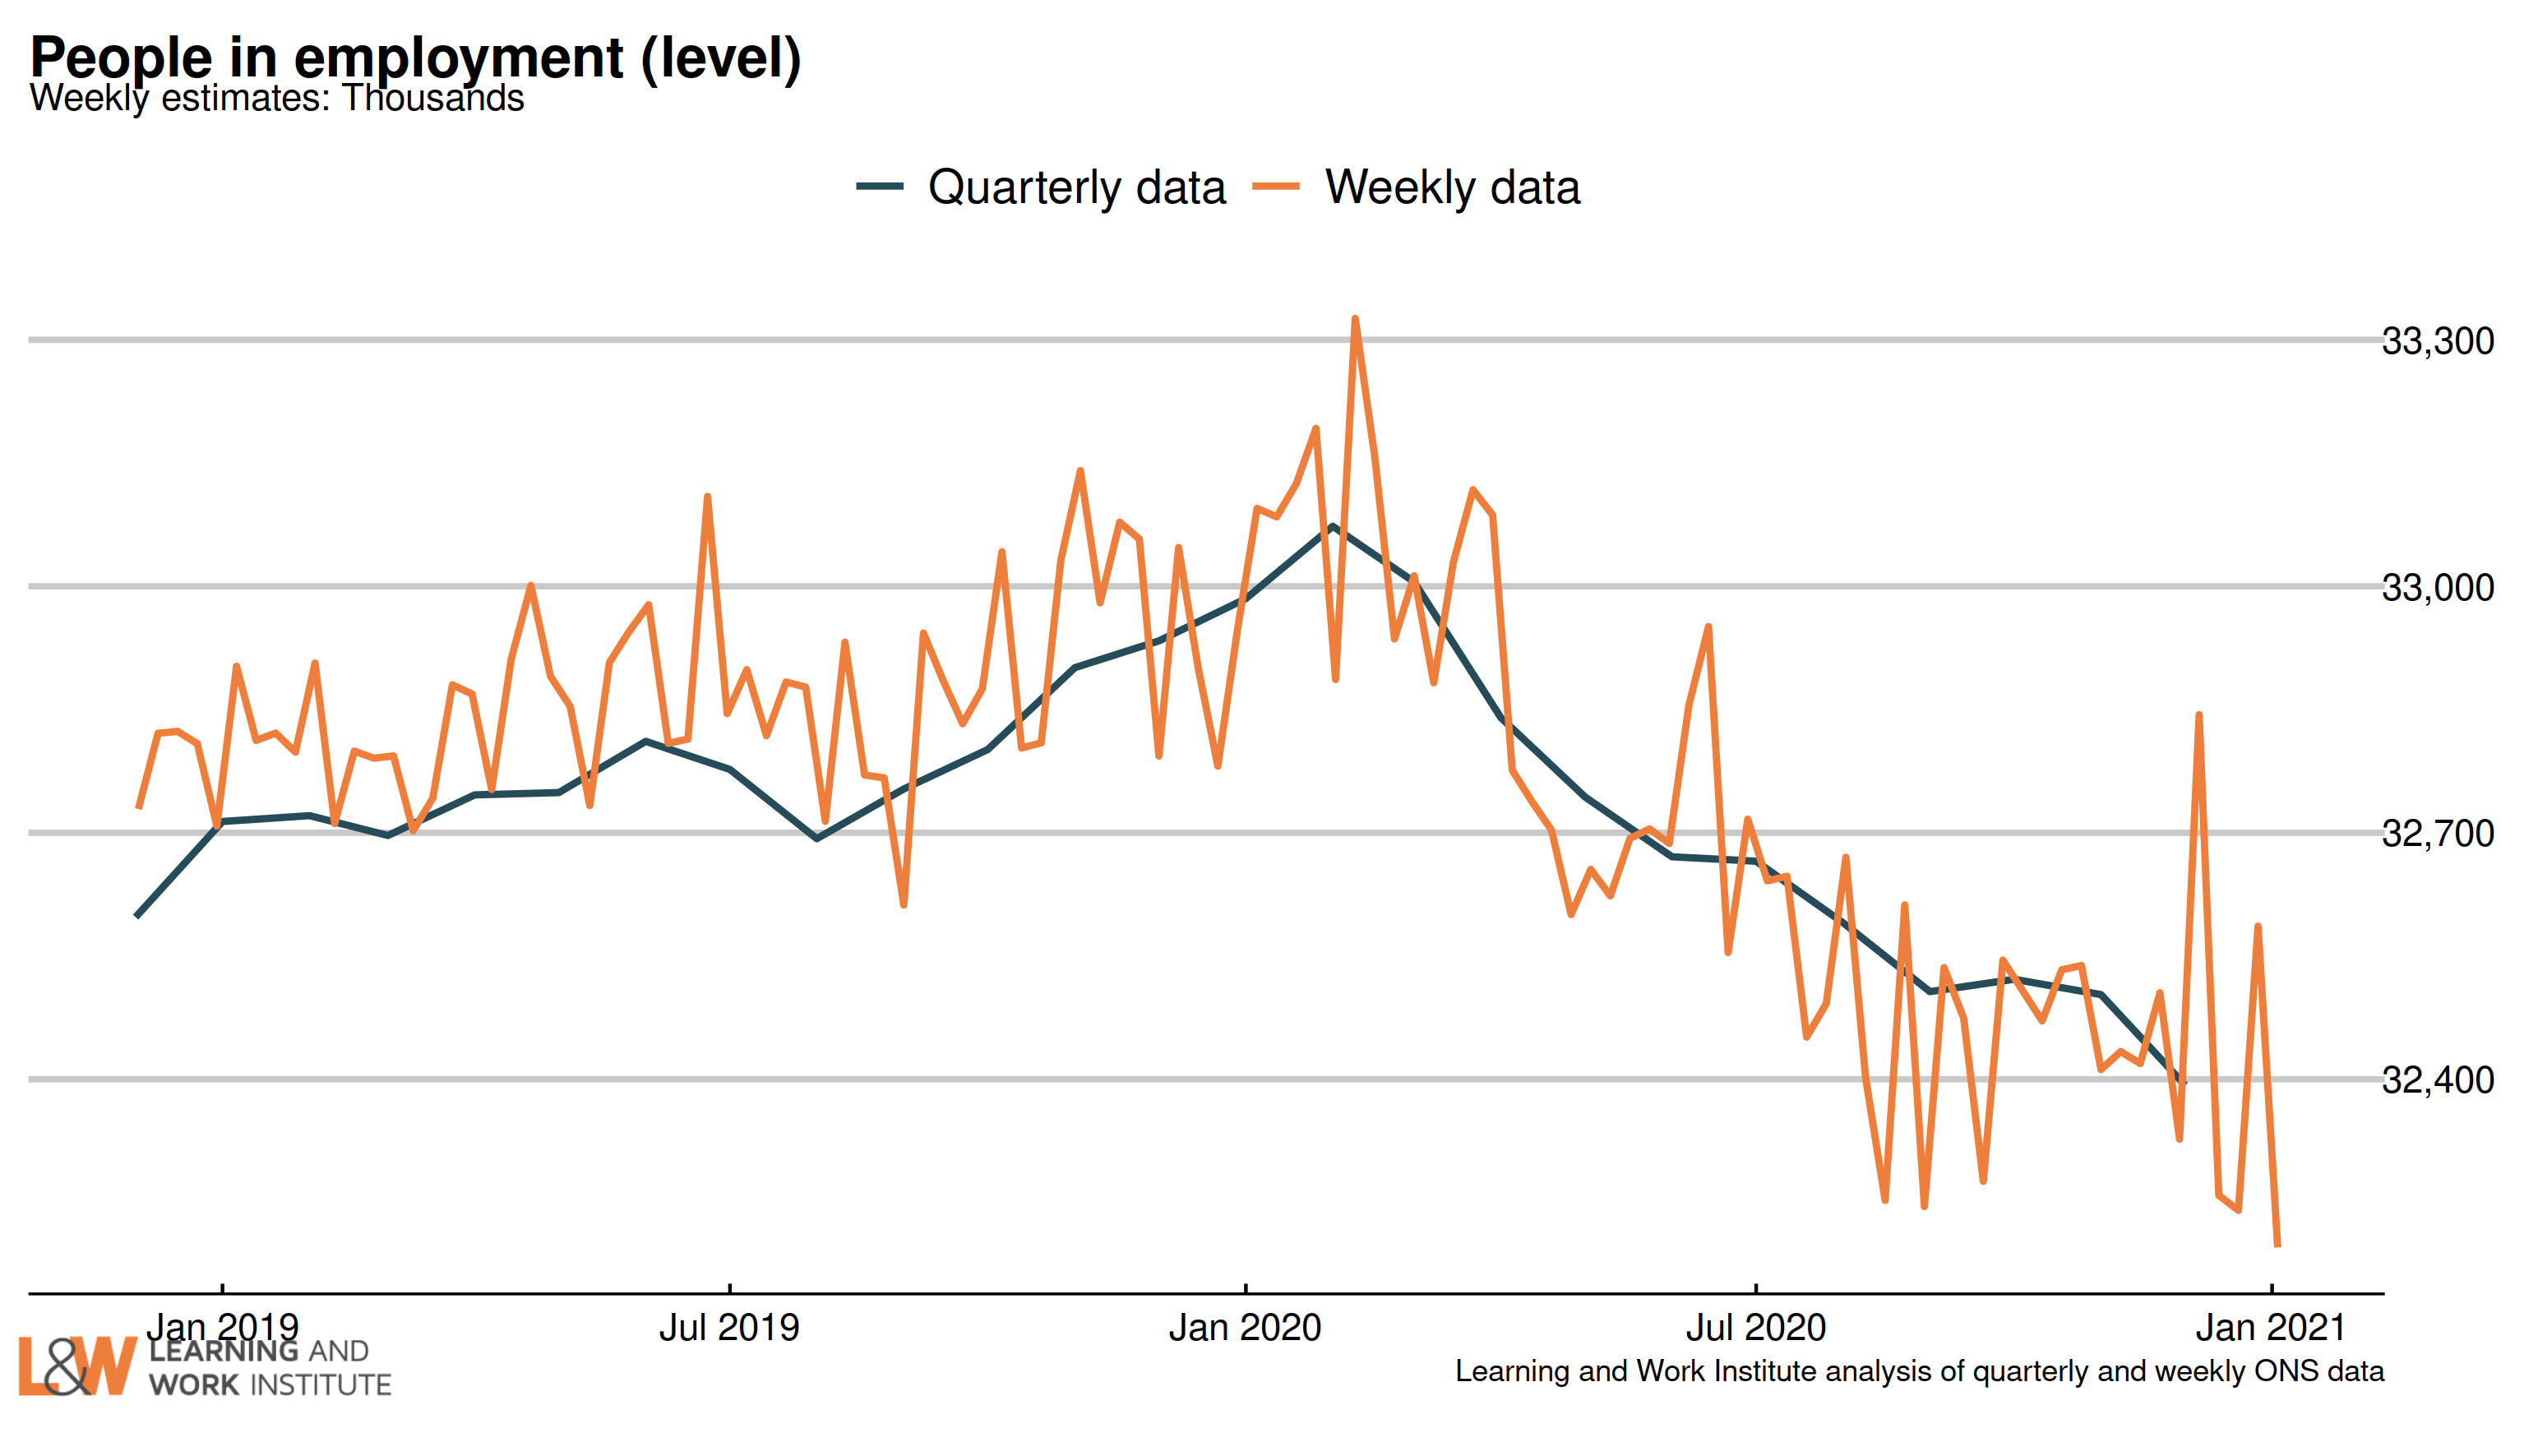 |
|
Chart 14: Employment rate in the UK
The employment rate fell by 0.3 percentage points over the quarter, to 75.0%. The chart shows both the official figures and the experimental weekly figures. The trend is likely to be downwards. 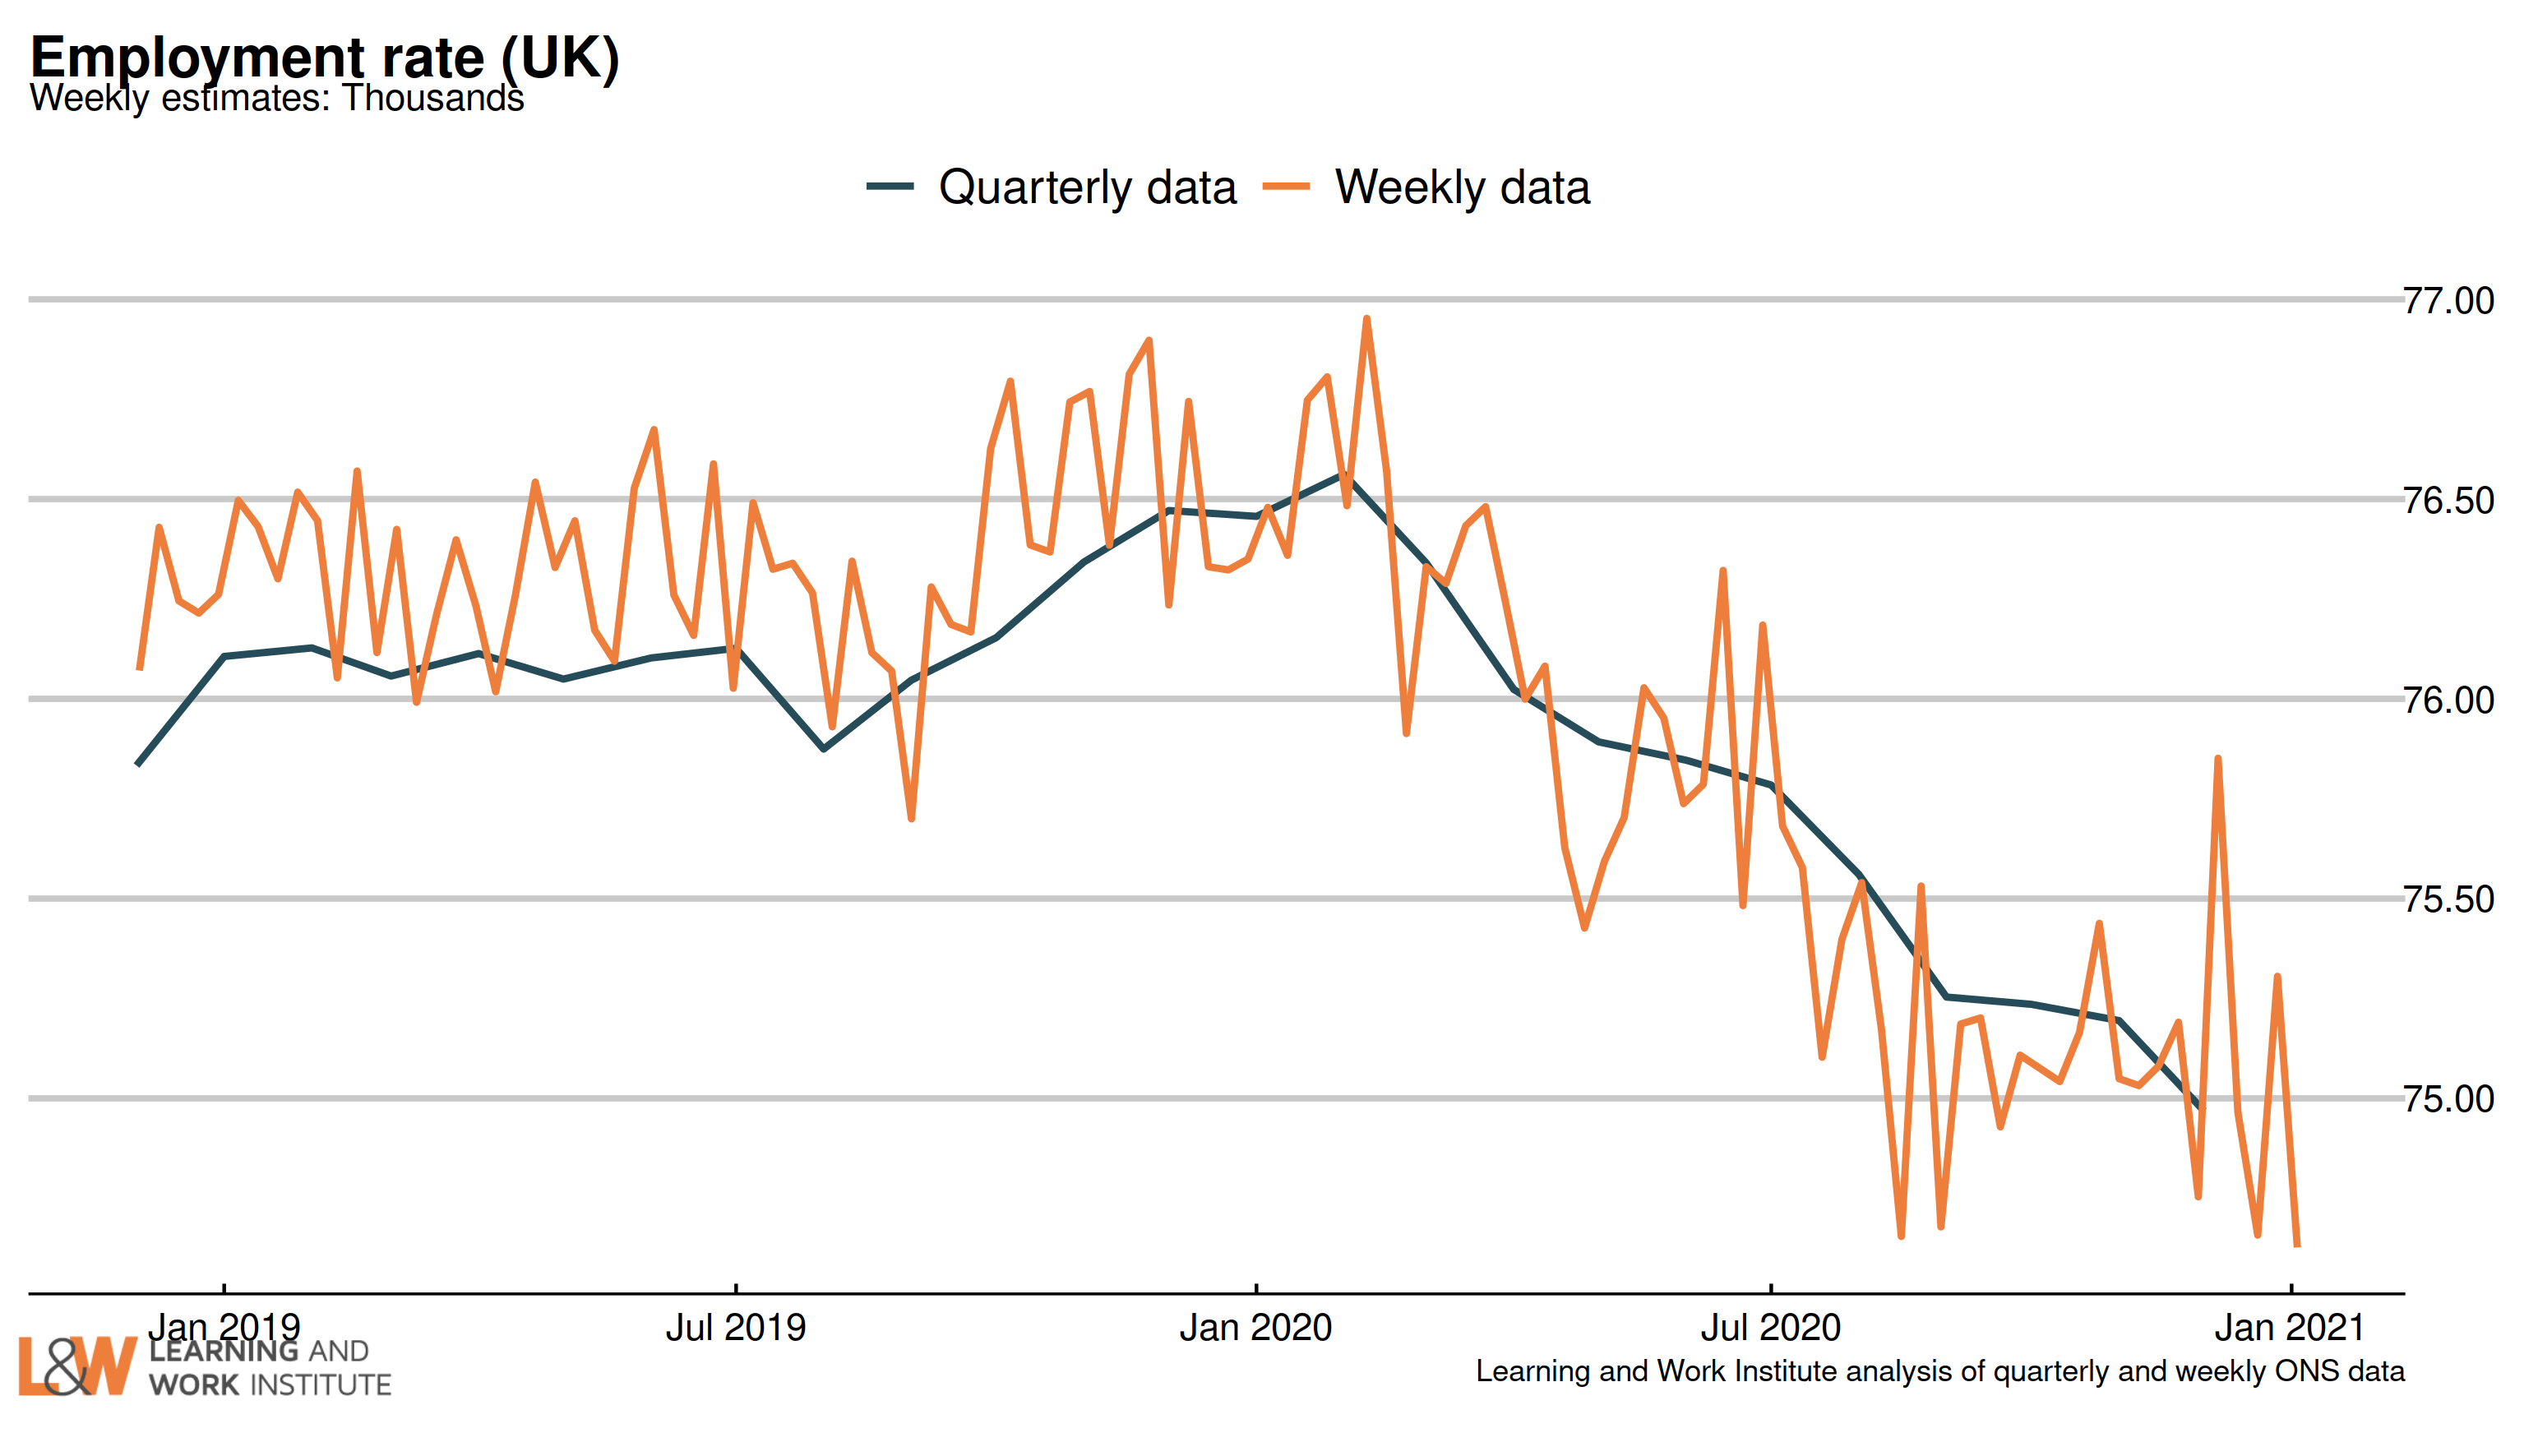 |
|
Chart 15: Claimants for inactive benefits and the economically inactive – inactivity benefits
The number of people inactive owing to long-term sickness rose, as did the benefit figure.
This chart shows claimants of Employment and Support Allowance, and Universal Credit equivalents (the orange dots), compared with survey figures for the economically inactive owing to long-term sickness. 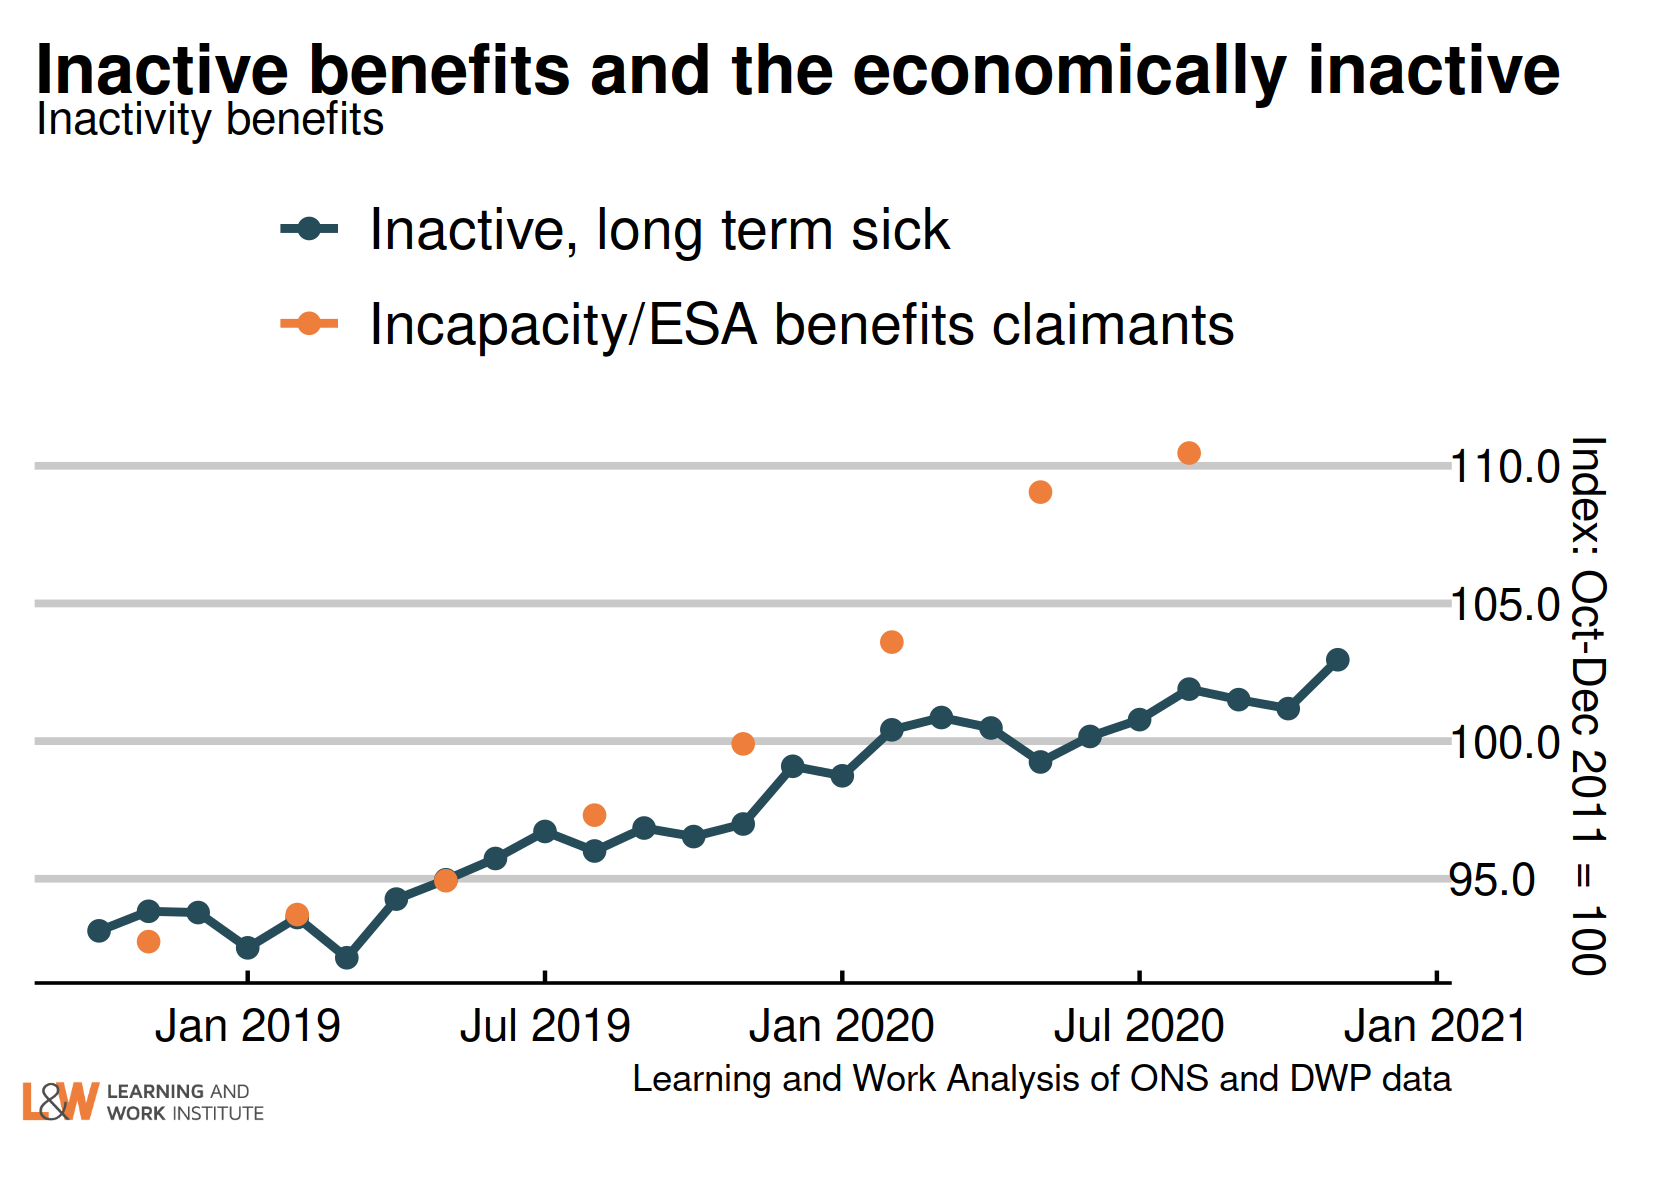 |
|
Chart 16: Claimants for inactive benefits and the economically inactive – lone parents
The survey figures (showing those looking after family) fell while benefit measures were more stable
Income Support estimates have decreased, but continue to exist despite the move to Universal Credit.
This chart shows claimants of Income Support as lone parents, plus lone parents claiming Universal Credit who are planning for work (the orange dots) and survey figures for all those who are economically inactive looking after family (including couple families). 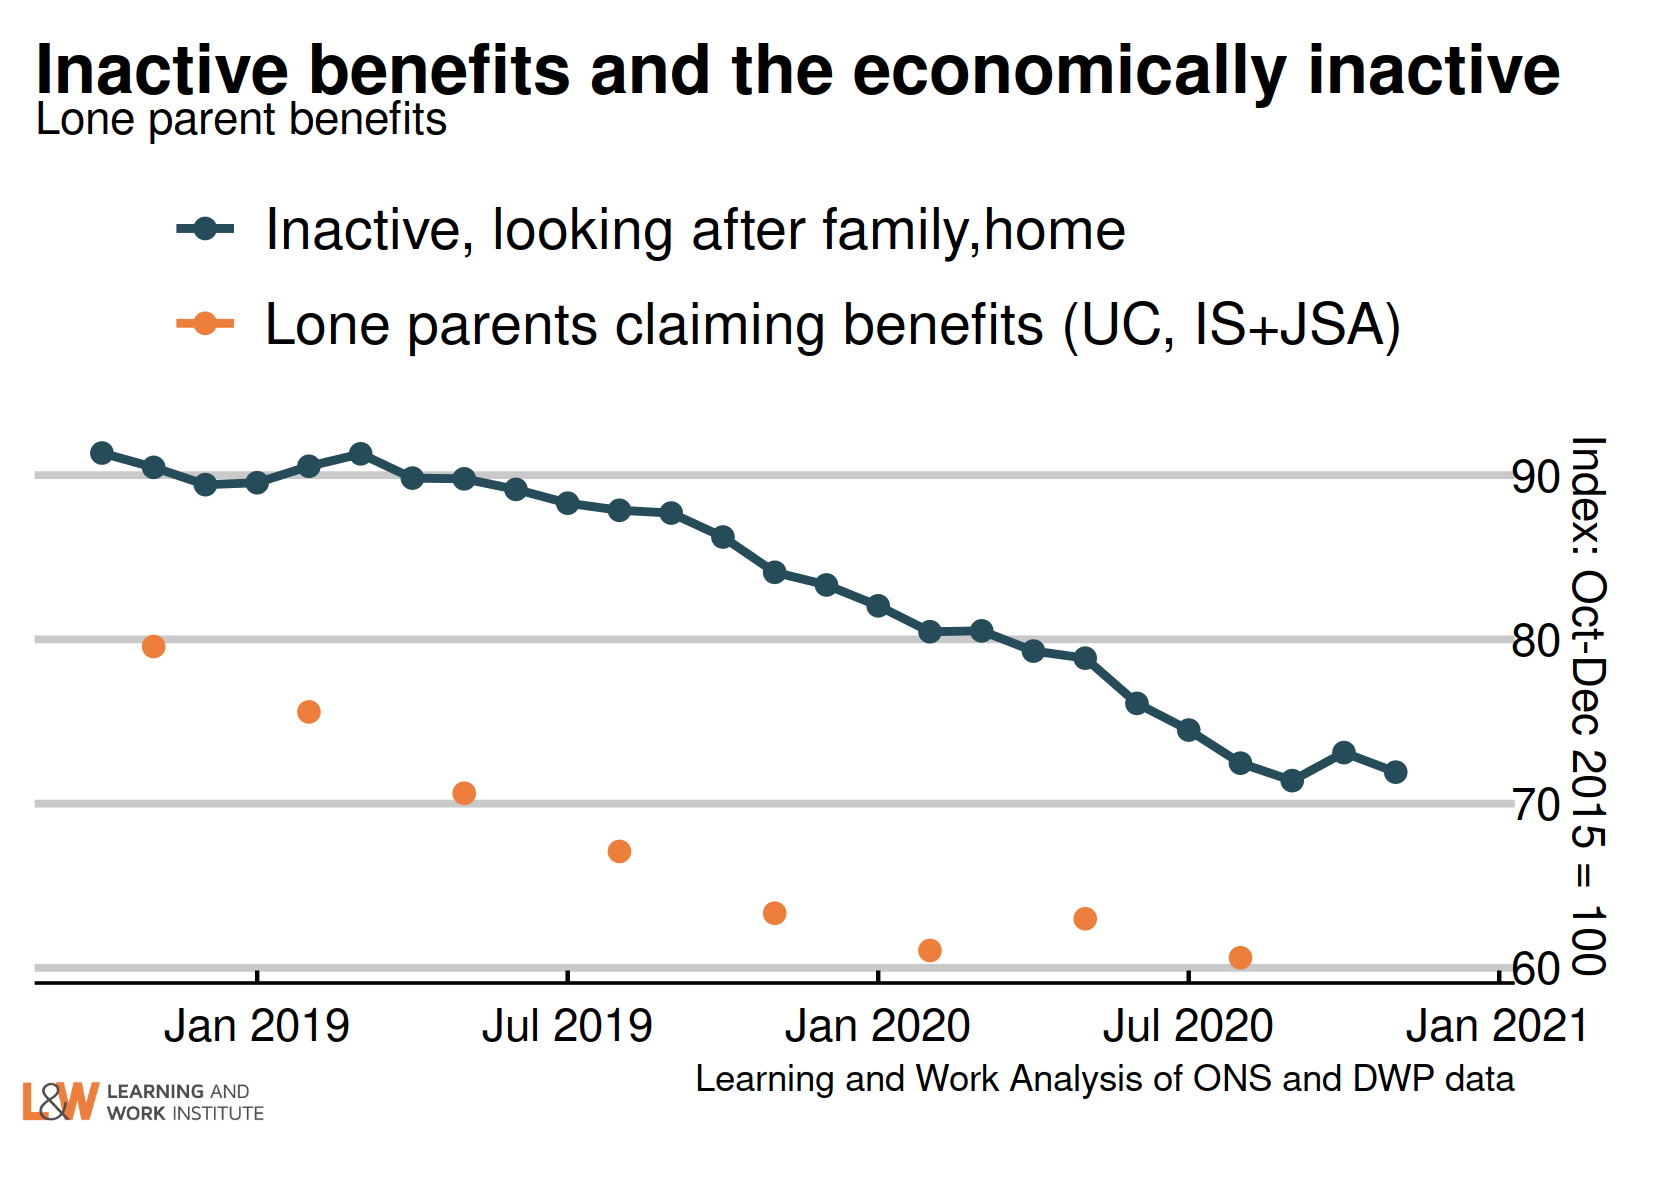 |
|
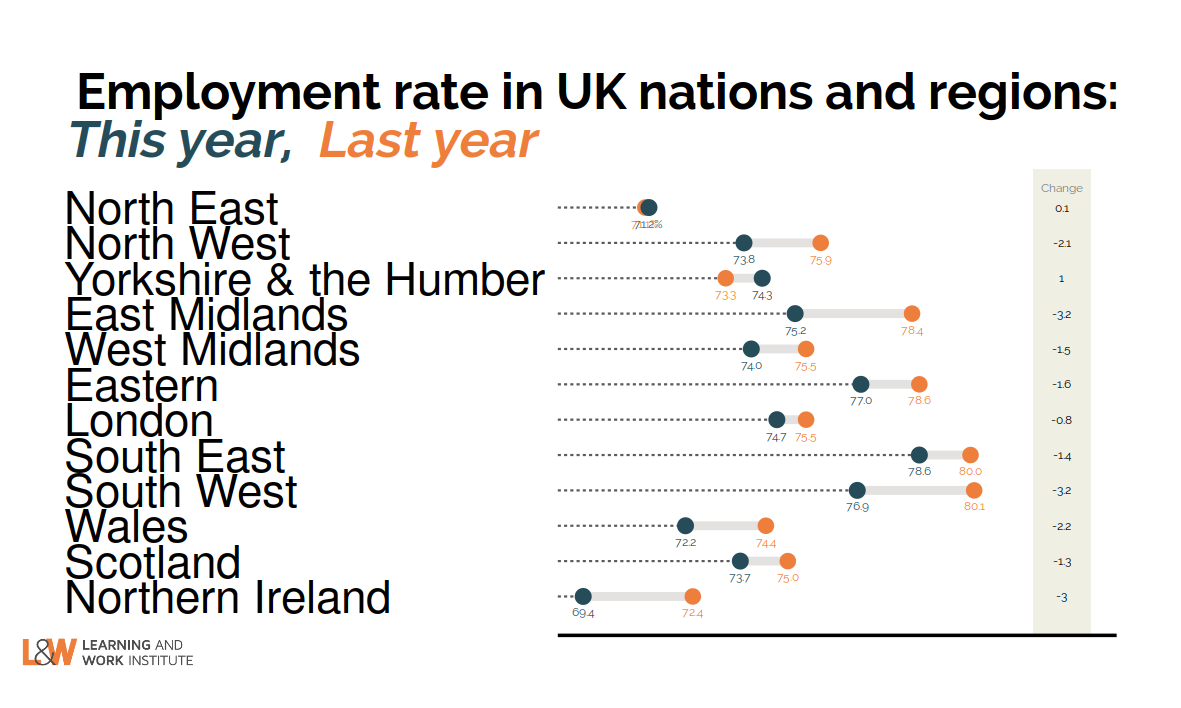
Chart 17: Employment rate annual change in regions – Year to October-December 2020
Compared to last year, one region (Yorkshire and the Humber) still showed a rise in the employment rate, while the remaining 11 showed a fall. The largest falls were in the South West and the East Midlands.
 |
|
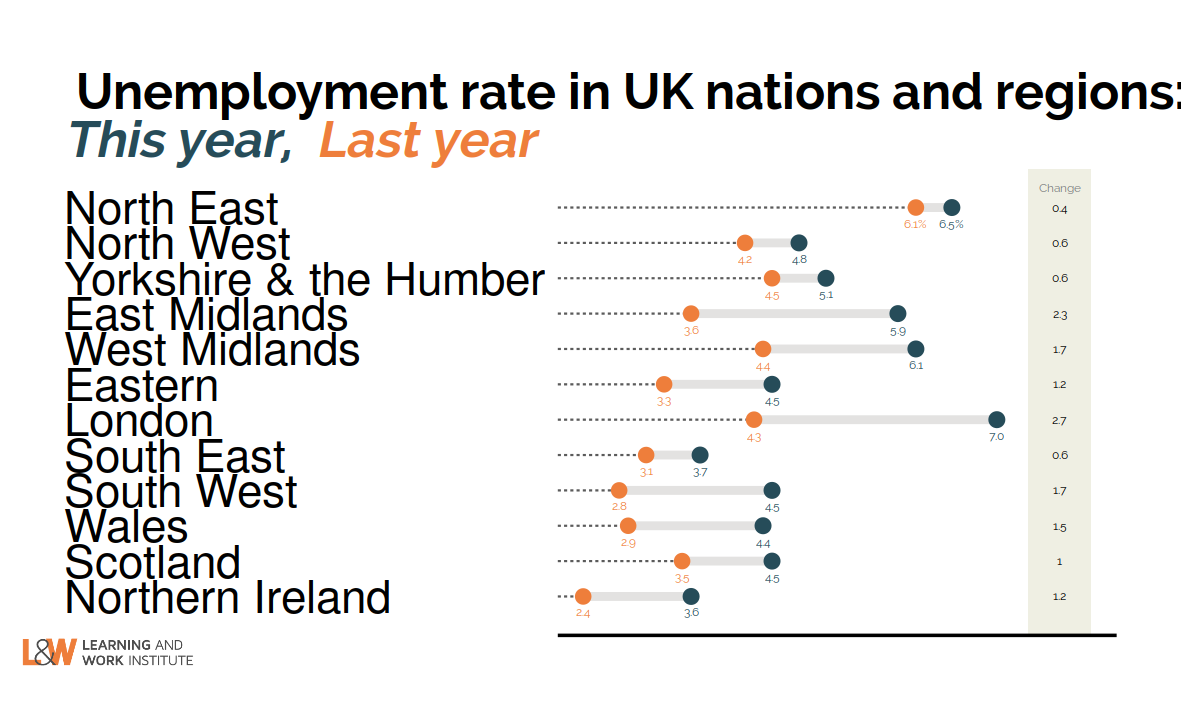
Chart 18: Unemployment rate annual change in regions – Year to October-December 2020
Compared to last year, all regions showed a rise in unemployment. The largest rises were in London and the East Midlands.
 |
|
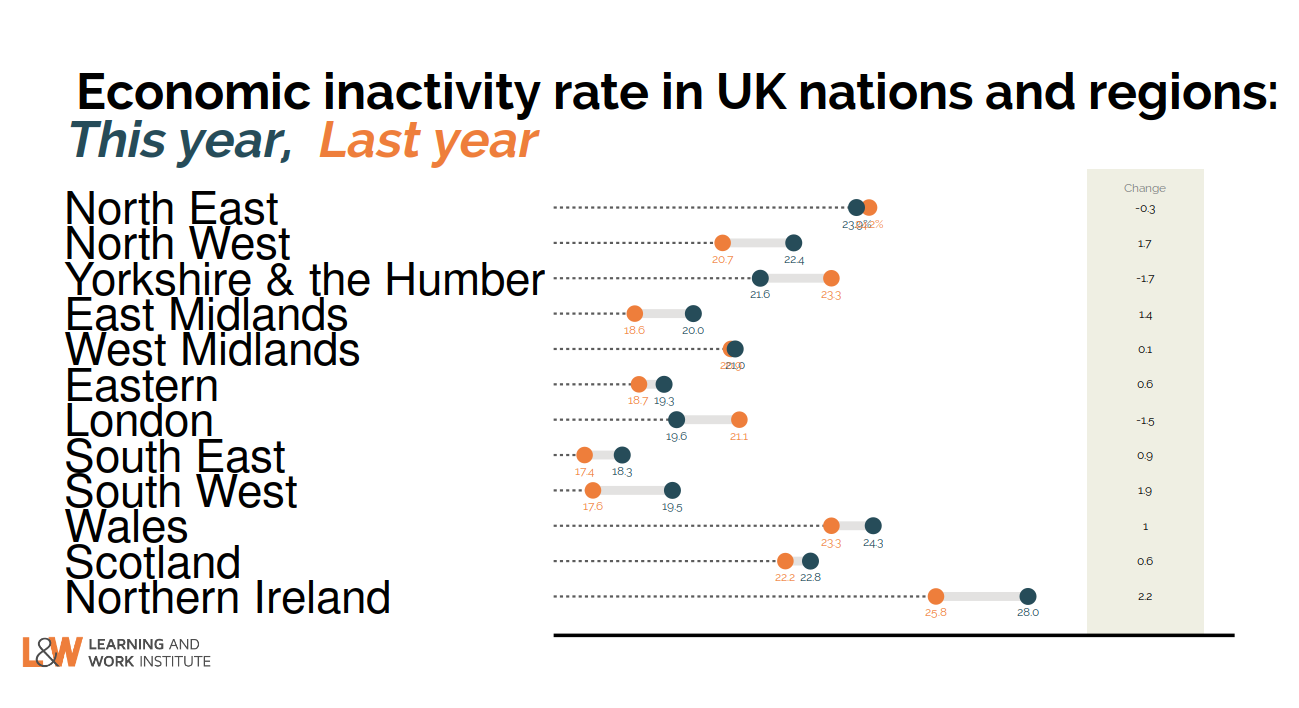
Chart 19: Inactivity rate annual change in regions – Year to October-December 2020
Compared to last year, nine regions showed a rise in the inactivity rate, led by the South West and Northern Ireland, while three showed falls, led by London and Yorkshire and the Humber.
 |
|
This newsletter is produced by Learning and Work Institute and keeps readers up to date on a wide range of learning and work issues.
If you have any questions, contact Paul Bivand
© 2020 Learning and Work Institute. All rights reserved. Click here to update your info
Click here to unsubscribe | Click here to see a web copy of this email
|
|