Share

Making learning and work count

Labour market LIVE from Learning and Work Institute
14 September 2021


  • Unemployment is 1,550,000, down by 50,000 from last month’s published figure (quarterly headline fell by 86,000) and the unemployment rate is 4.6%, down by 0.2 percentage points on last month and is down by 0.3 percentage points on last quarter.
  • The ONS figure for claimant unemployed is 2,193,300, down by 58,600 on last month, and the claimant rate is 5.4%.
  • The number of workless young people (not in employment, full-time education or training) is 851,000, and fell by 80,000 on the quarter, representing 12.5% of the youth population (down by 1.2 percentage points).
  • Youth unemployment (including students) is 525,000, down by 10,000 on the quarter.
  • Vacancies in June to August 2021 rose (in the ONS official series) to 1,034,000 after recovering strongly from the low point of 340,000 in April to June 2020.
  • There are now 1.6 unemployed people per vacancy.
  • The employment rate is 75.2% (rose by 0.1 percentage points on last month’s published figure and rose by 0.5 percentage points in the preferred quarterly measure).

Learning and Work Institute comment

The labour market figures published on 14 September indicate a strongly recovering labour market. However, employment levels remain well below those seen pre-pandemic and the outlook between now and the end of 2021 remains highly uncertain given the Coronavirus Job Retention Scheme ends this month.

Duncan Melville, Chief Economist at the Learning and Work Institute, commented:

‘Employment is growing strongly. Today’s headline numbers from the Labour Force Survey (LFS) show an increase in employment of 183,000 in the three months to May to July 2021. This is the largest quarterly increase since November 2019 to January 2020 before the onset of the pandemic. New data on workforce jobs shows an increase in the three months to June 2021 of 293,000 - the largest quarterly increase for over seven years. The more timely HMRC payroll numbers show an increase of 241,000 in the month to August - the largest increase on record. Vigorous employment growth can be expected to continue as vacancies exceeded a million for the first time in June to August, and data on job ads from Adzuna indicate that vacancy levels continued to remain strong into this month.

Alongside this picture of robust demand for labour, both unemployment and inactivity amongst people of working age have fallen substantially: down by 86,000 and 121,000 in the three months to May to July 2021 respectively. It is particularly welcome that the improving labour market is encouraging people back into the labour market to find work.

While the above is all very encouraging, we should not forget that employment remains substantially lower than it was pre-pandemic. Admittedly, HMRC employee payroll numbers are back at pre-pandemic levels, but on the wider LFS and workforce jobs measures employment is down by over 700,000 and 800,000 respectively since the start of the pandemic. Full recovery in the labour market is unlikely to be seen for at least a couple of years and will require supportive action on the part of government: both in terms of labour market policy to help individuals move back into work and wider macroeconomic policy to ensure that the economy continues to grow.

The immediate outlook for the labour market also remains highly uncertain due to the ending of the Coronavirus Job Retention Scheme this month. The latest data showed that there were nearly 1.6 million furloughed workers at the end of July. Based on more recent survey data, the number of people on the scheme could still be around a million when it closes. Many of these are likely to return to their existing jobs, perhaps on reduced hours, but inevitably, despite the strong labour market environment, some will lose their jobs. Of these some may leave the labour market, for example, some older workers may retire. Even so some rise in unemployment seems highly likely. The magnitude of this rise is highly uncertain, but some simple calculations suggest it could be in the range 130,000 to 280,000.

Whatever happens to overall unemployment, long term unemployment has already risen substantially. The number of young people aged 16-24 who have been unemployed for six months or more is a third higher than it was pre-pandemic, and the number of people aged 25 and over who have been unemployed for 12 months or more is up by nearly a half since the start of the pandemic. The Spending Review next month will need to ensure that the necessary support is available to help individuals move into sustained employment. ’

Paul Bivand, Associate Director for Statistics and Analysis at Learning and Work Institute said:

"The headlines today are based on HMRC's 'flash' estimate of payrolled employees in August. The figures will be revised (normally downwards) because HMRC include some expected employer returns that have not yet arrived. The rise of 240,000 in HMRC employment is the net change of 855,000 job starts and 613,000 people leaving a job. Job churn is very high, even if these figures may be revised down."

Employment rose by 183,000 between February to April 2021 and May to July 2021. In the last 12 months employment is down by 202,000.

Unemployment reduced by 86,000 between February to April 2021 and May to July 2021 and the unemployment rate fell by 0.3 percentage points to 4.6% in the quarter. In the last 12 months unemployment has risen 81,000.

Economic inactivity decreased by 121,000 between February to April 2021 and May to July 2021 and the inactivity rate decreased by 0.3 percentage points to 21.1% in the quarter. In the last 12 months inactivity has risen 75,000.

The national claimant count has fallen by 58,600.

Youth unemployment is down by 10,000 in the quarter. There are 525,000 unemployed young people, and 317,000 (4.7% of the youth population) who are unemployed and not in full-time education.

Self-employment decreased by 336,000 this year. The number of employees increased by 159,000 over the year. Involuntary part-time employment is down by 50,000 this quarter to 980,000, 12.6% of all part-time workers. Involuntary temporary employment is up by 15,000 this quarter to 526,000, 32.1% of all temporary workers.

Chart 1: UK unemployment (ILO)

The latest unemployment rate has fallen by 0.2 percentage points to 4.6% compared to last month's figures. The experimental weekly statistics show a further fall to 4.1% at the end of July. chart 1
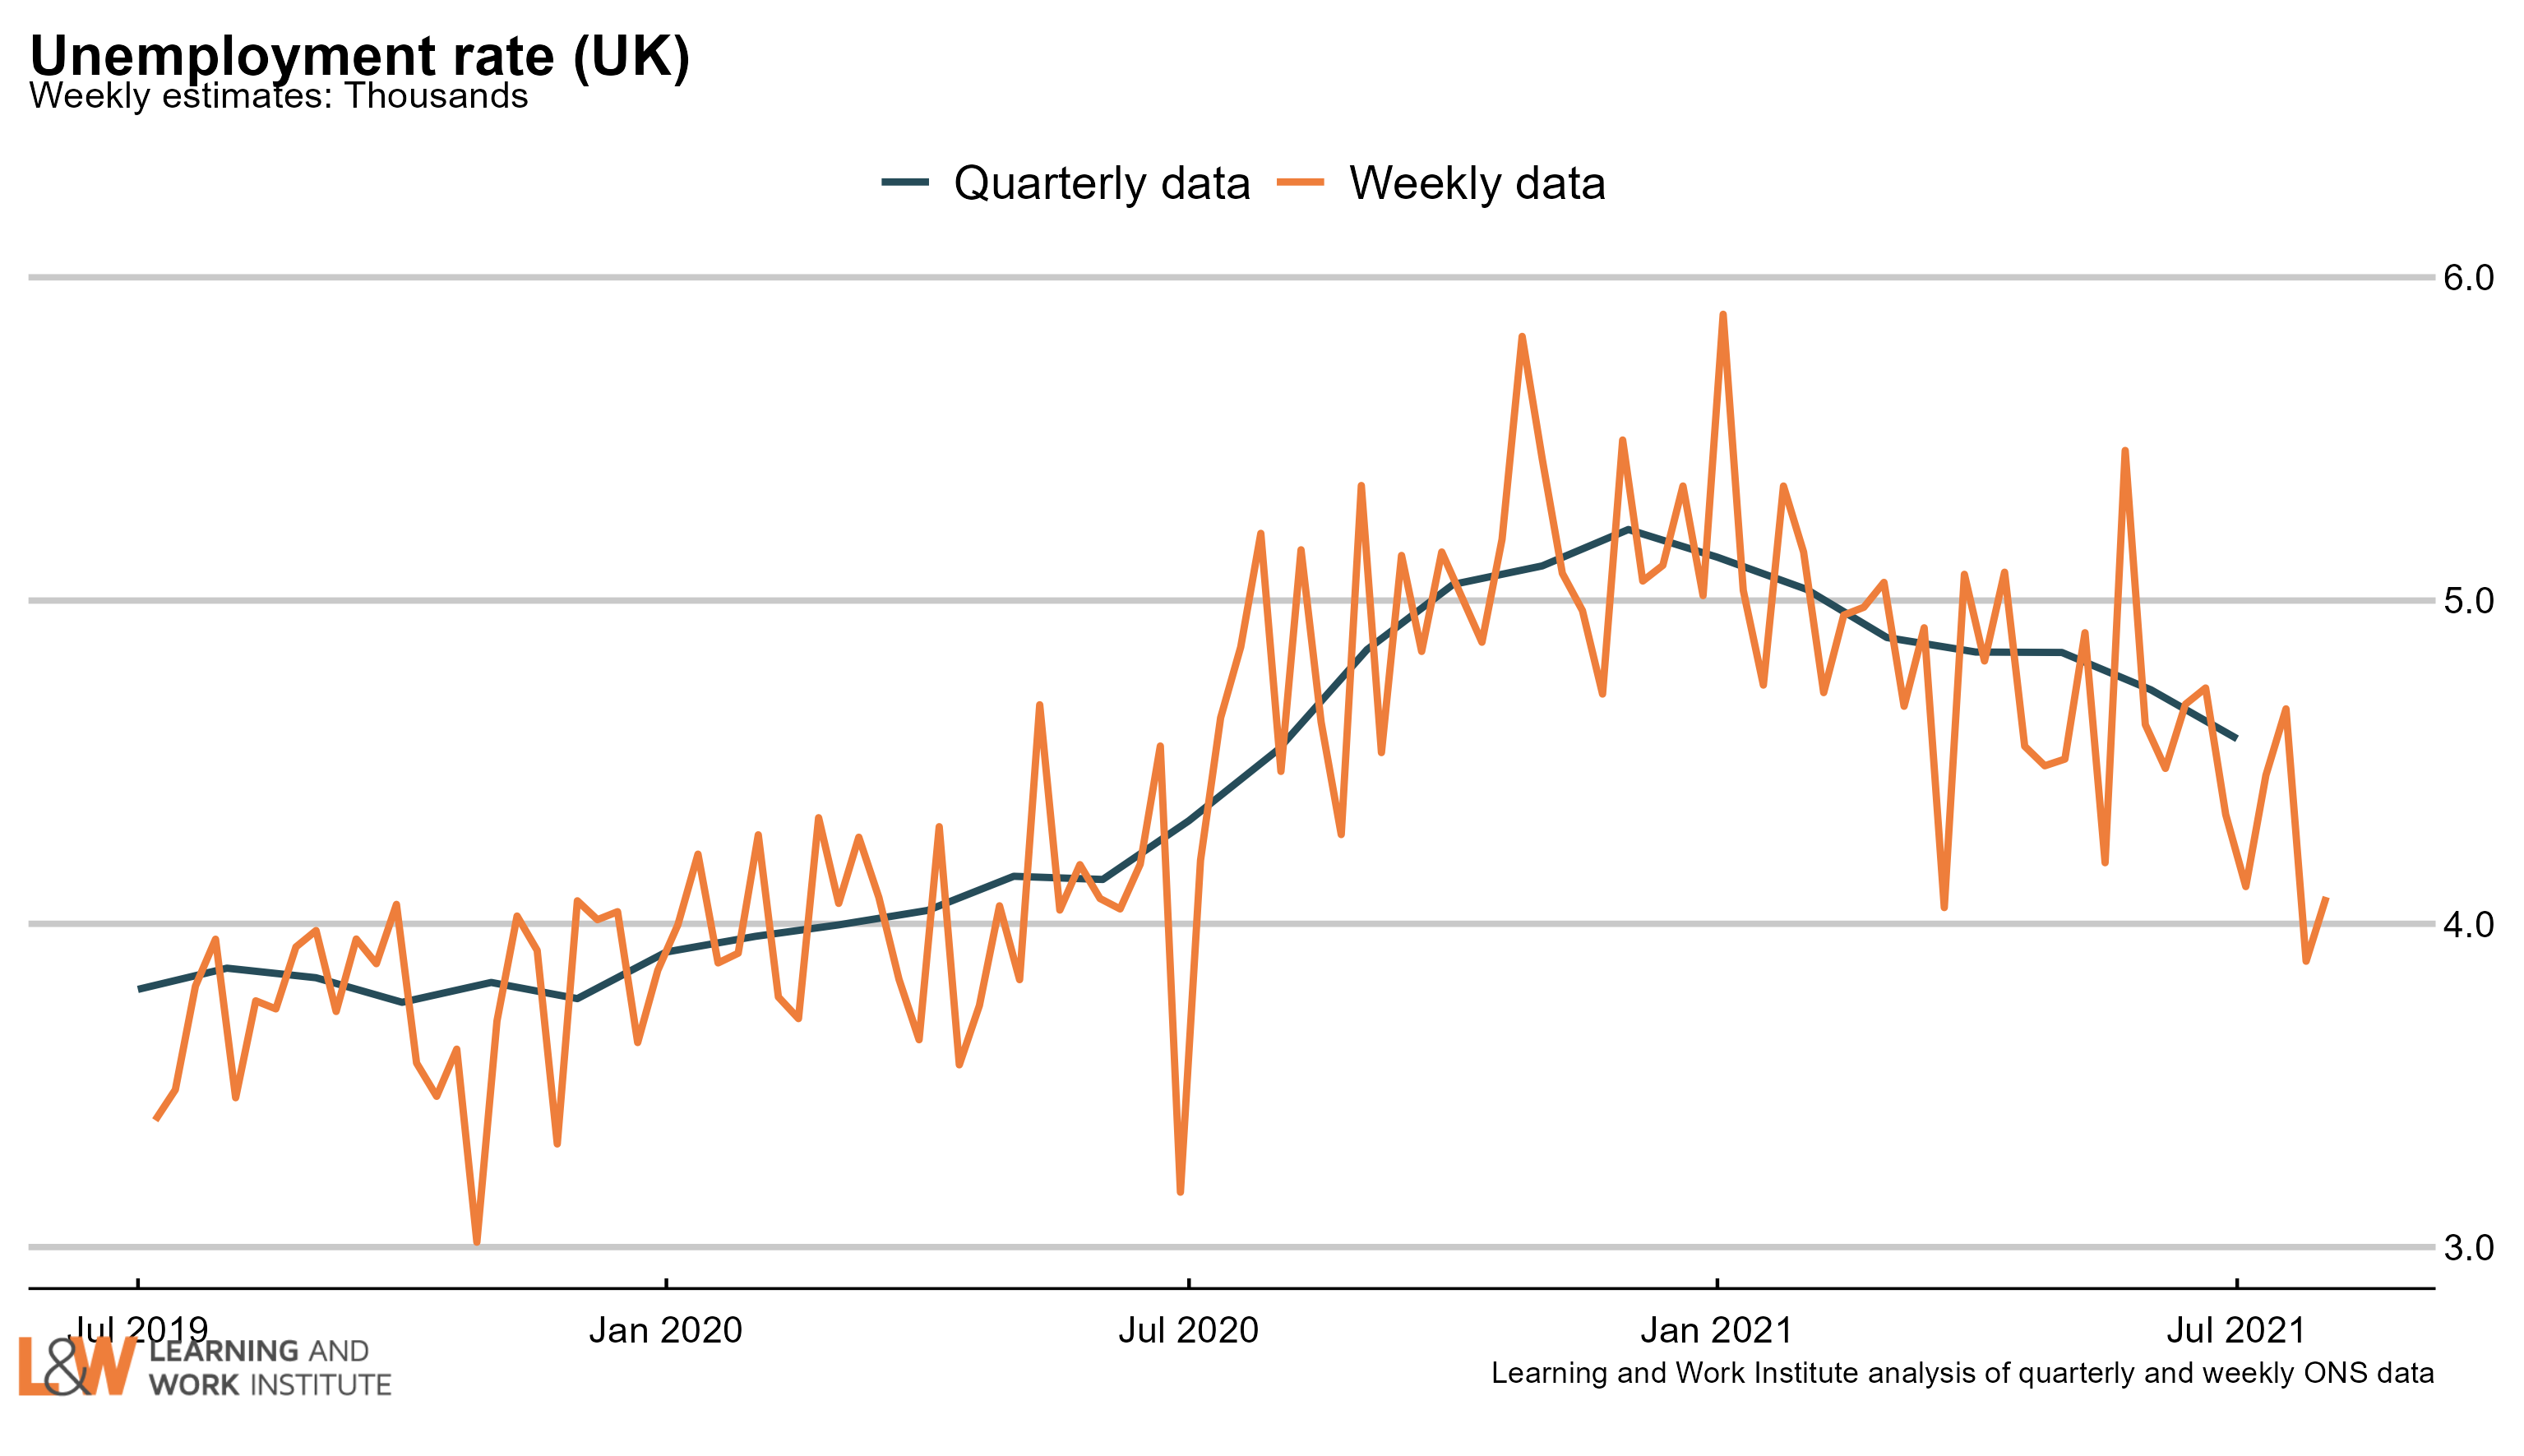
Chart 2: The claimant count and UK unemployment compared

The number of unemployed people who are claiming unemployment-related benefits is now 642,900 higher than the number of unemployed in the official measure. This difference is highly unusual - due to differences in defining unemployment the official measure is normally higher than the claimant measure. chart 2
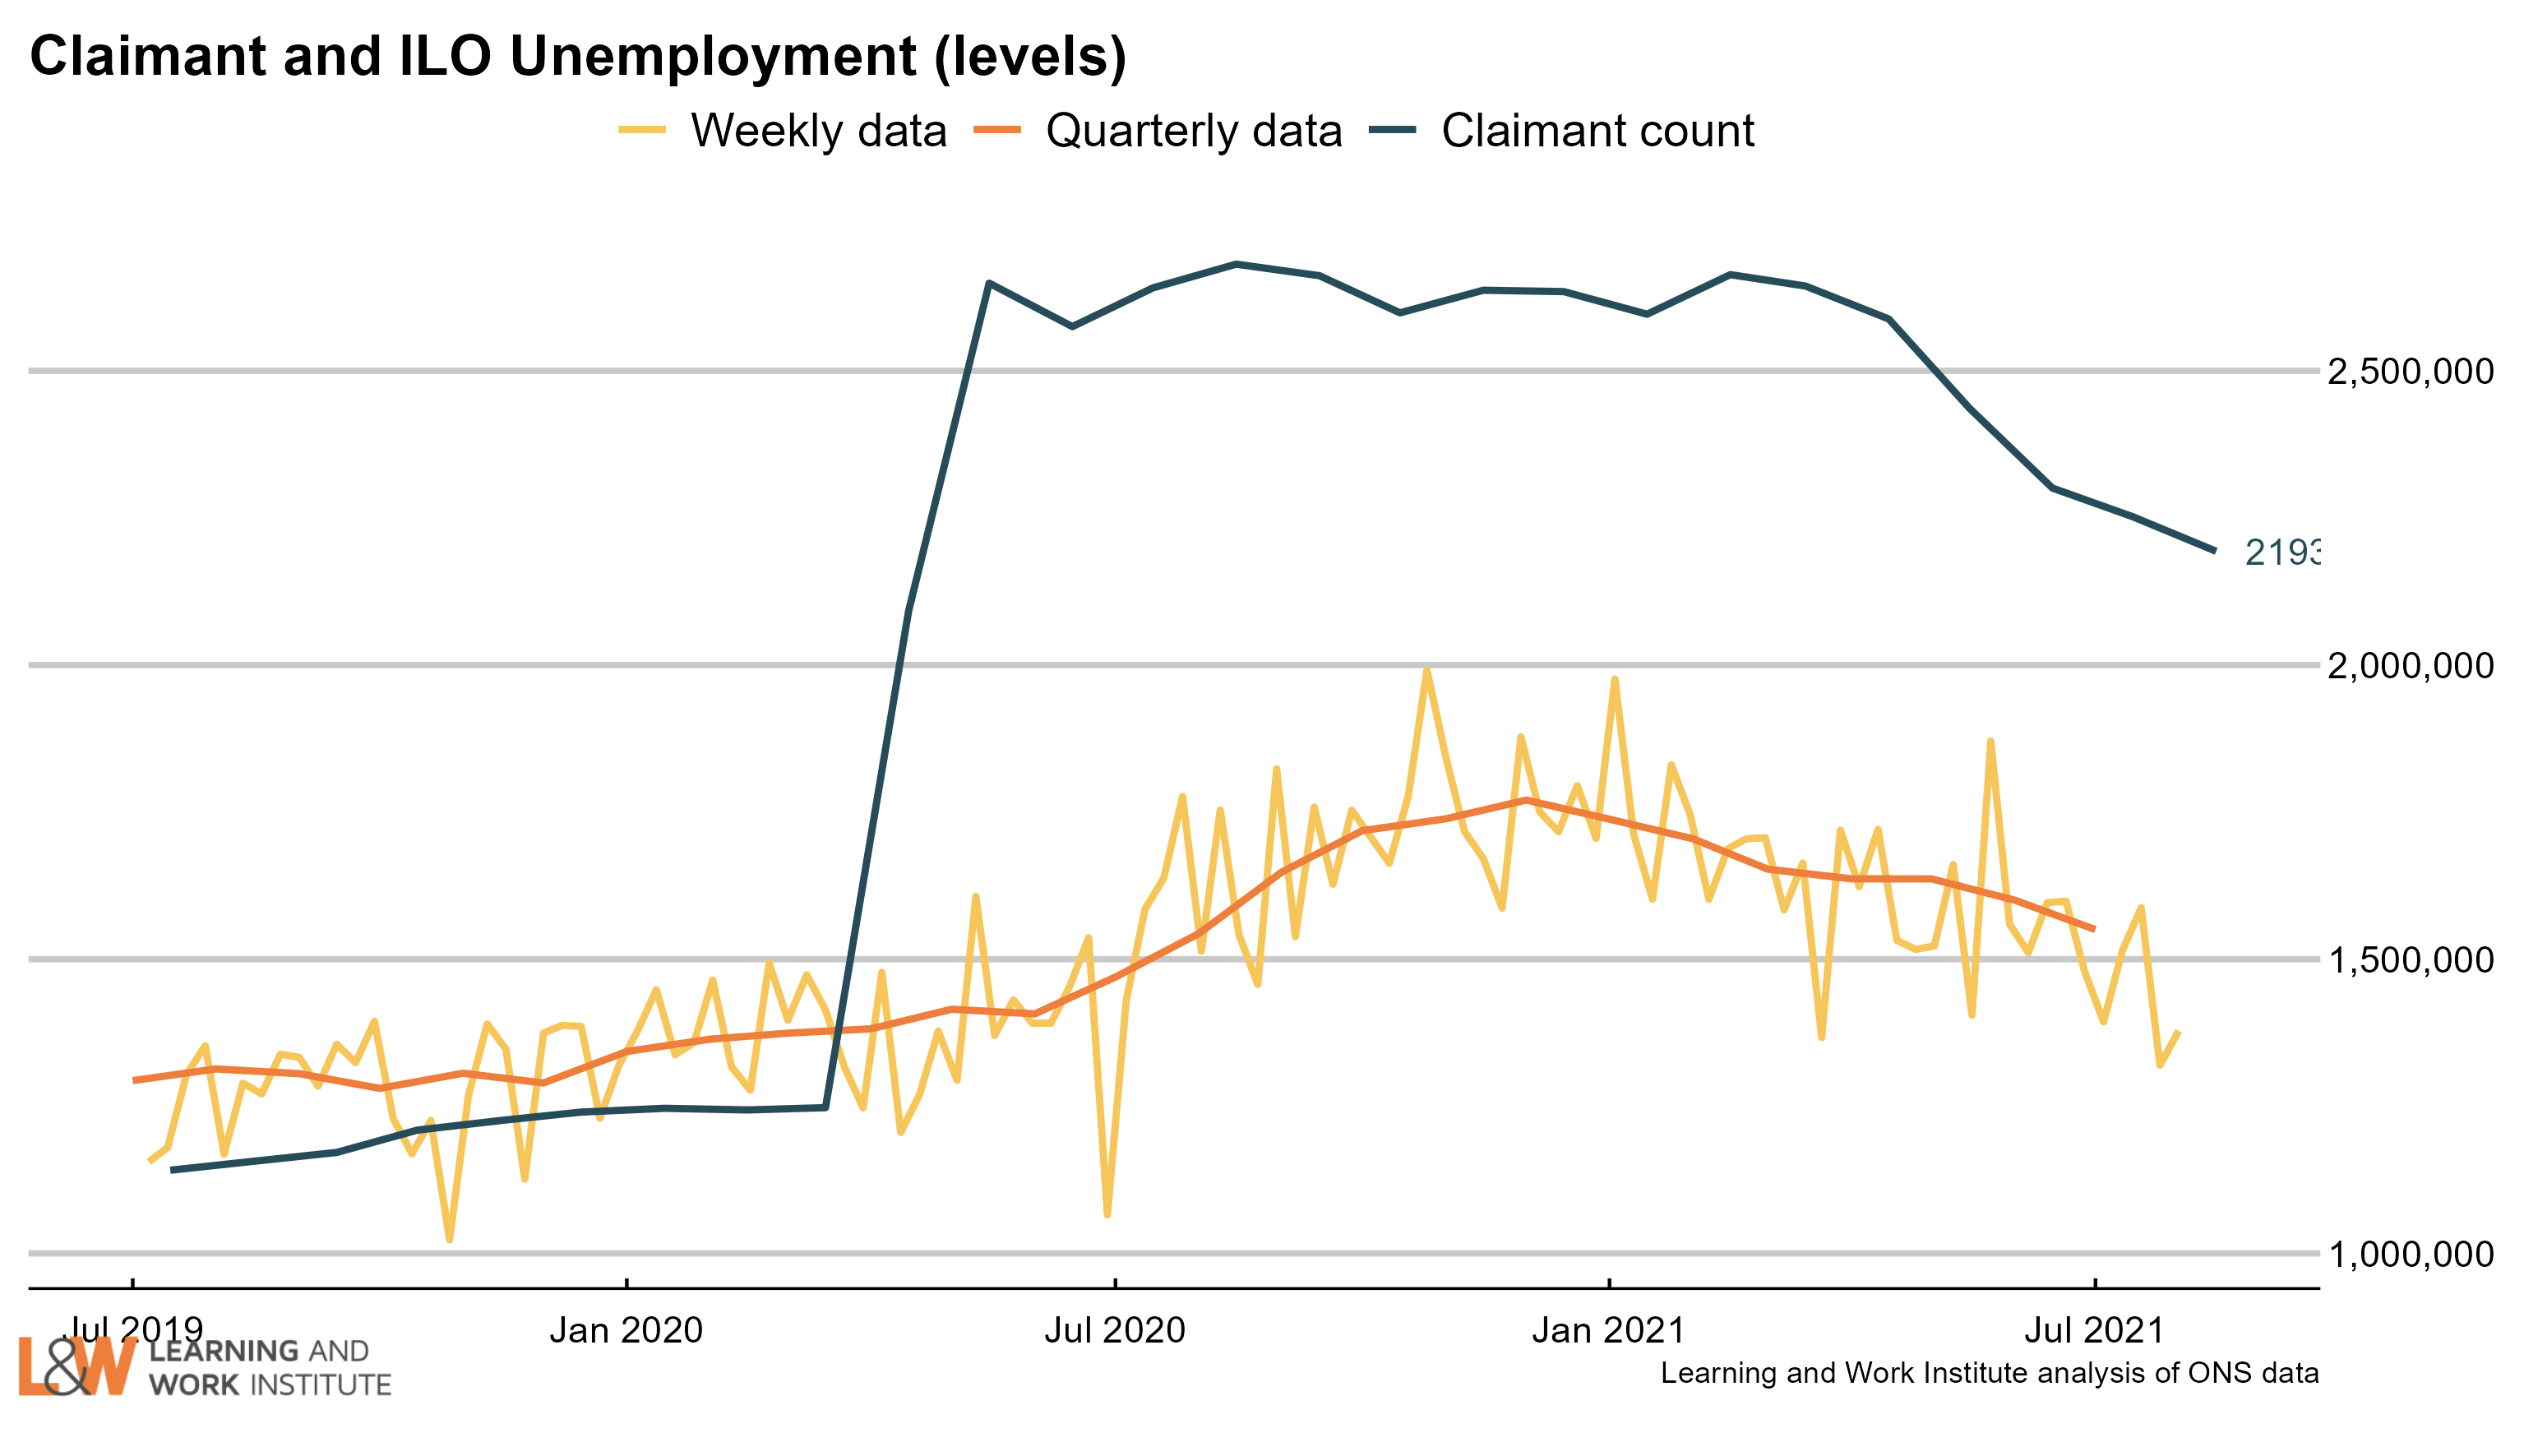
Chart 3: Youth unemployment

The number of unemployed young people declined by 5,000 since last month’s figures, to 525,000.

Meanwhile, the number of young Universal Credit or Jobseeker’s Allowance claimants is down by last month by 12,200, to 391,300. chart 7
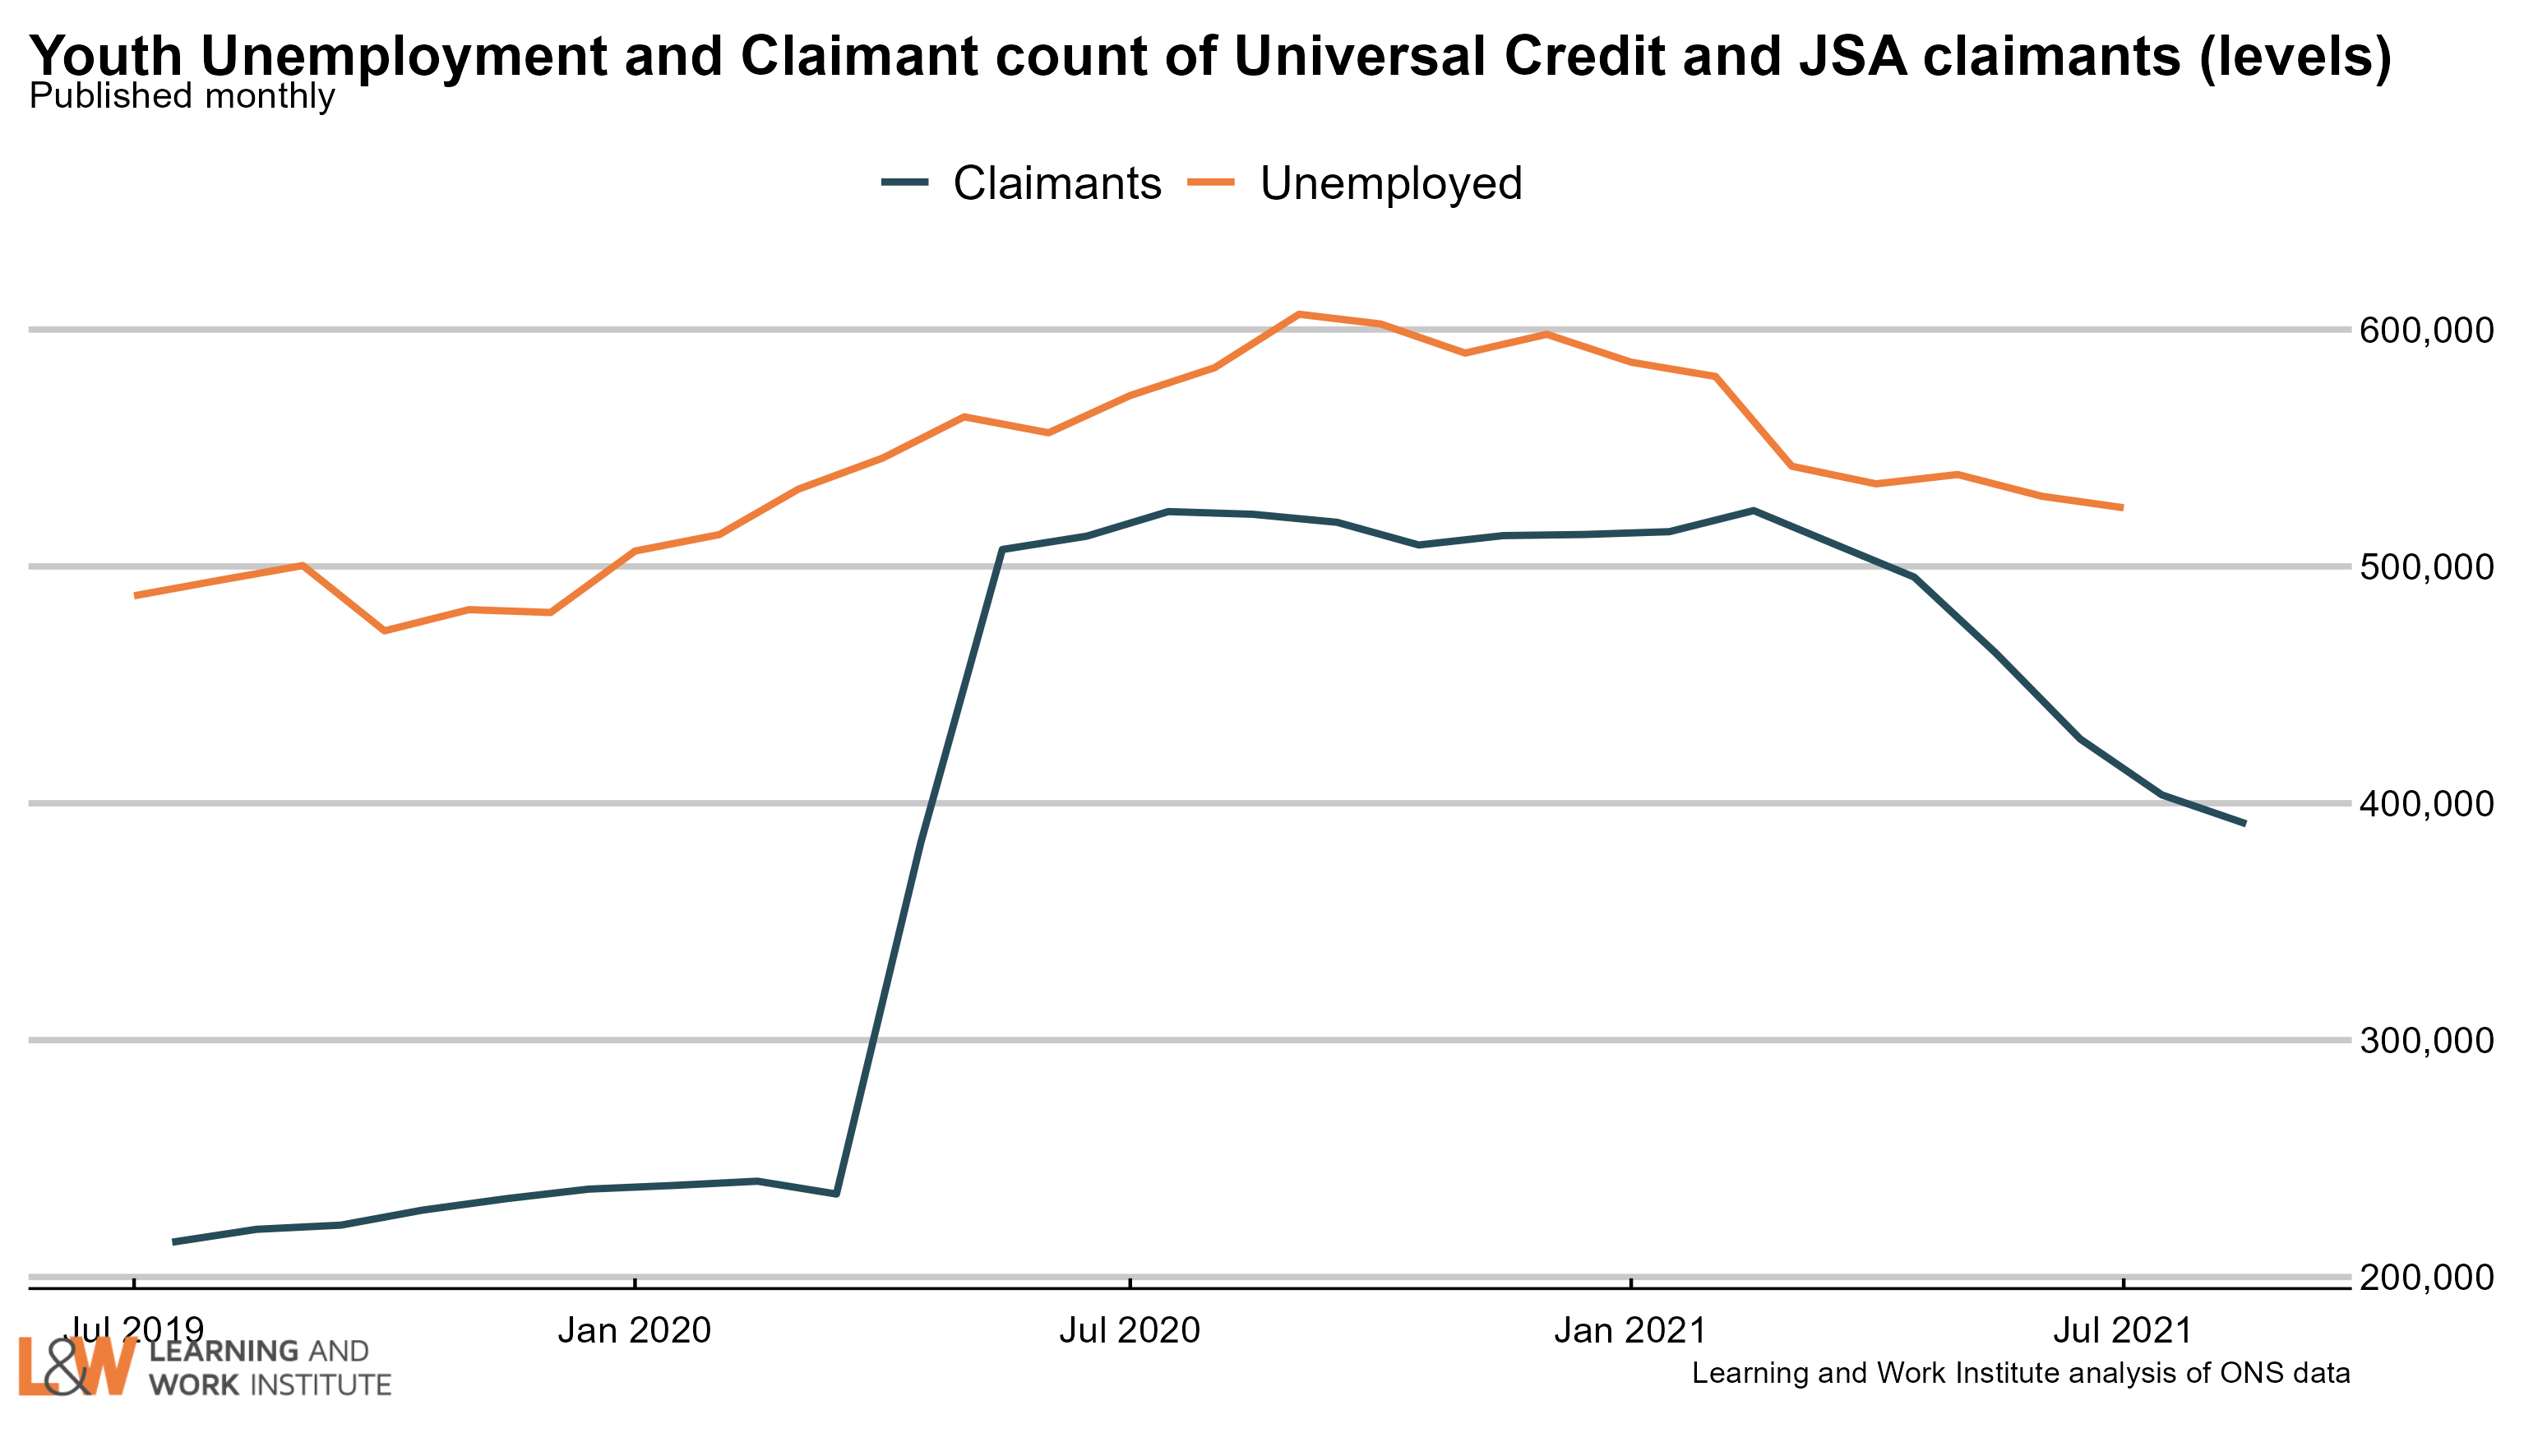
Chart 4: Young people not in employment, full-time education or training

The number of out of work young people who are not in full-time education (851,000) fell by 80,000 in the last quarter, or 8.6%. The fall was evenly divided between the unemployed and the inactive, though proportionately larger for the smaller group of the unemployed. chart 6
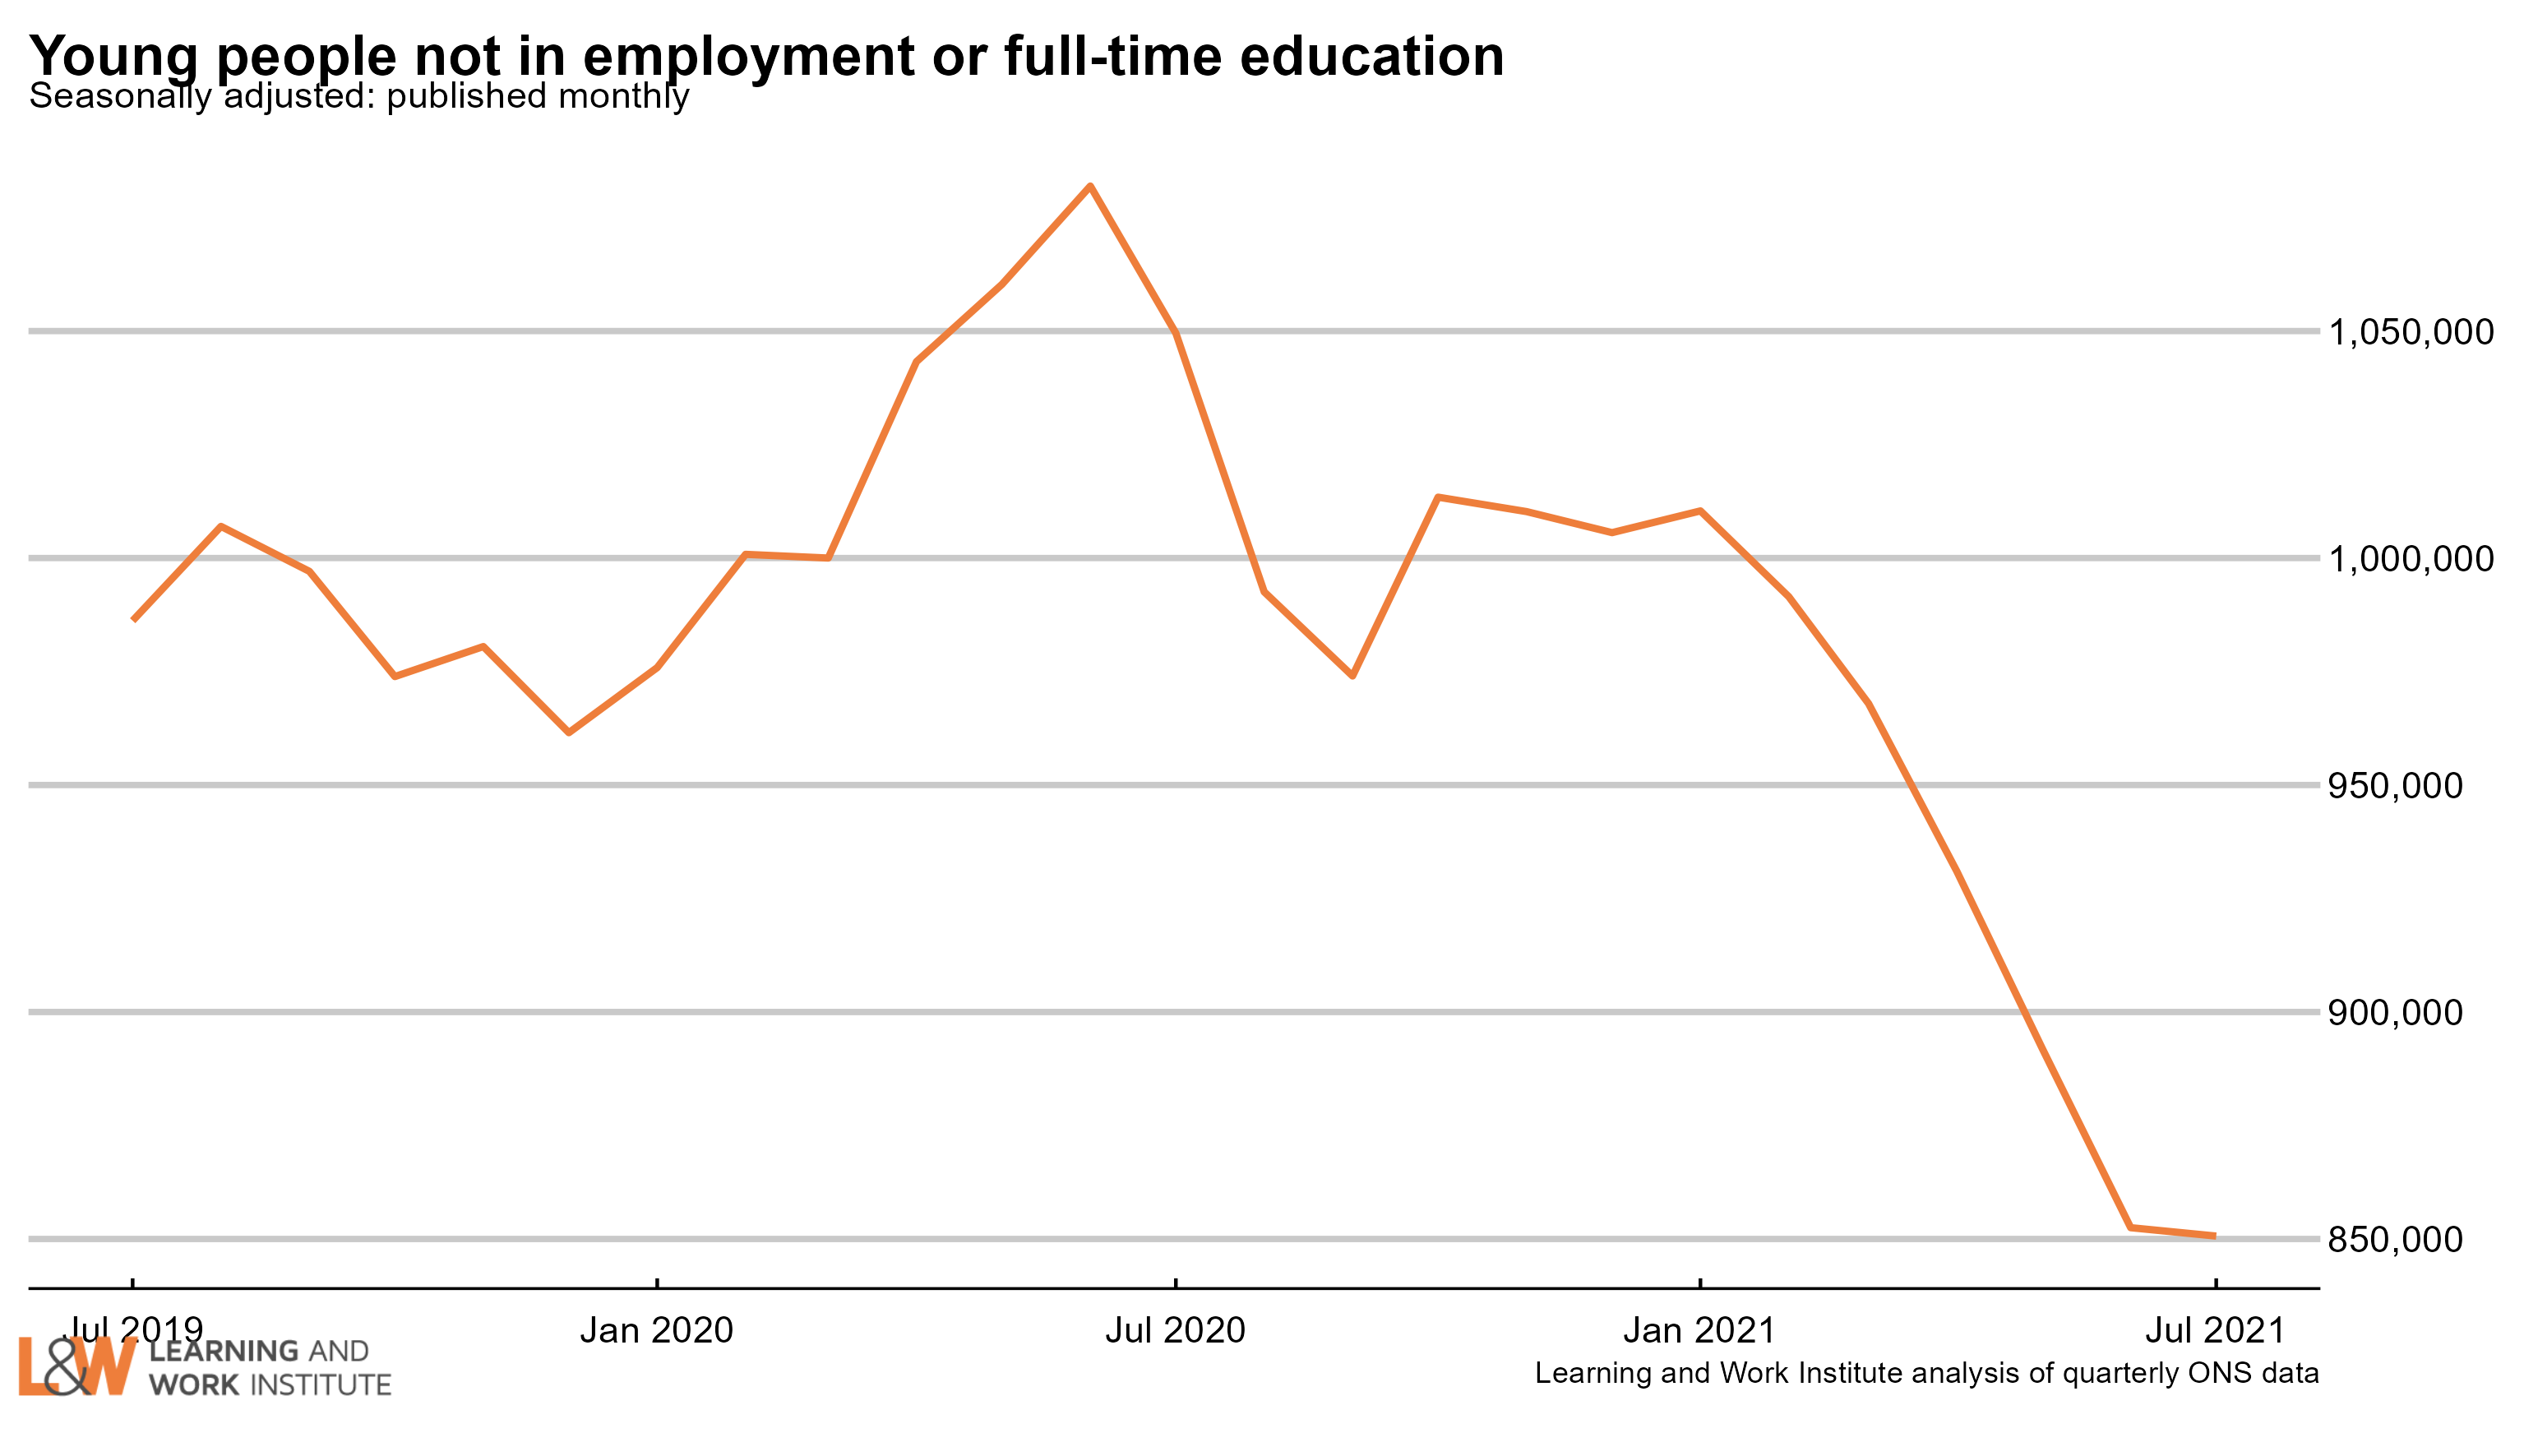
Chart 5: Youth long-term unemployment (six months and over, 18-24)

Youth long-term unemployment (which can include students) has fallen by 26,000 over the last quarter and is now 193,000

chart 3
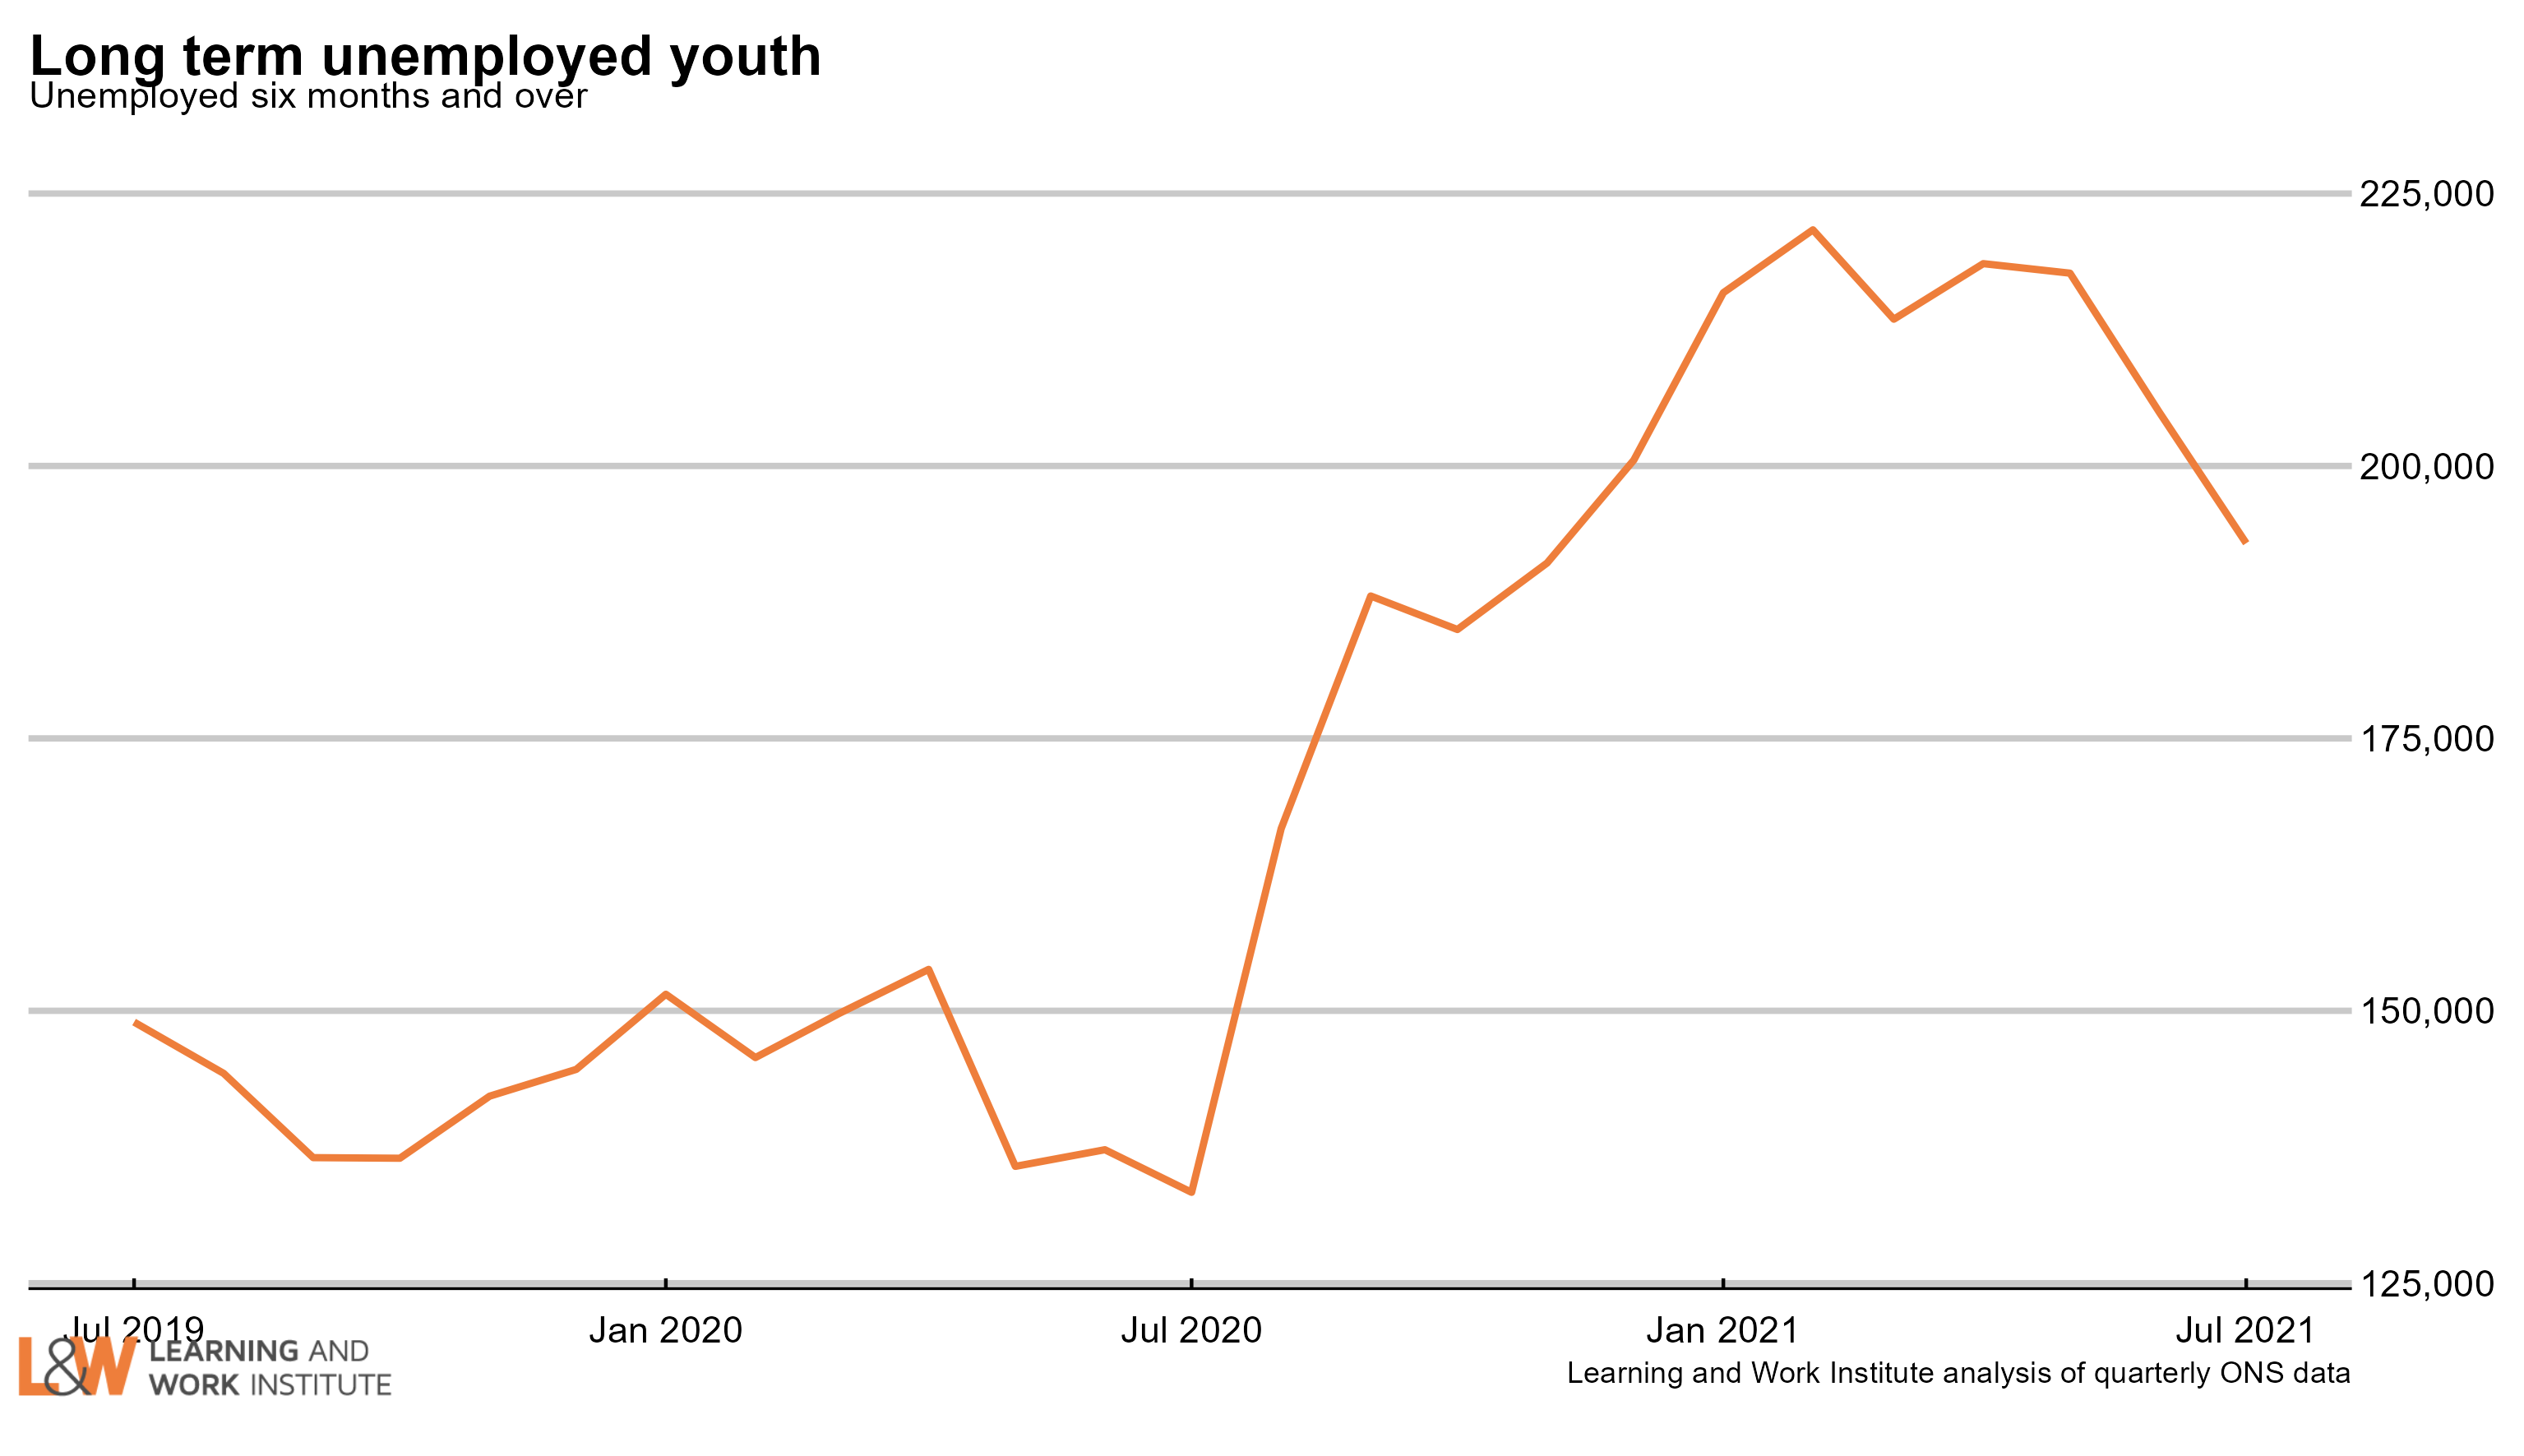
Chart 6: Adult long-term unemployment (12 months and over, 25+)

Adult long-term unemployment on the survey measure is now 347,000. This is the highest level since 2016.

chart 4
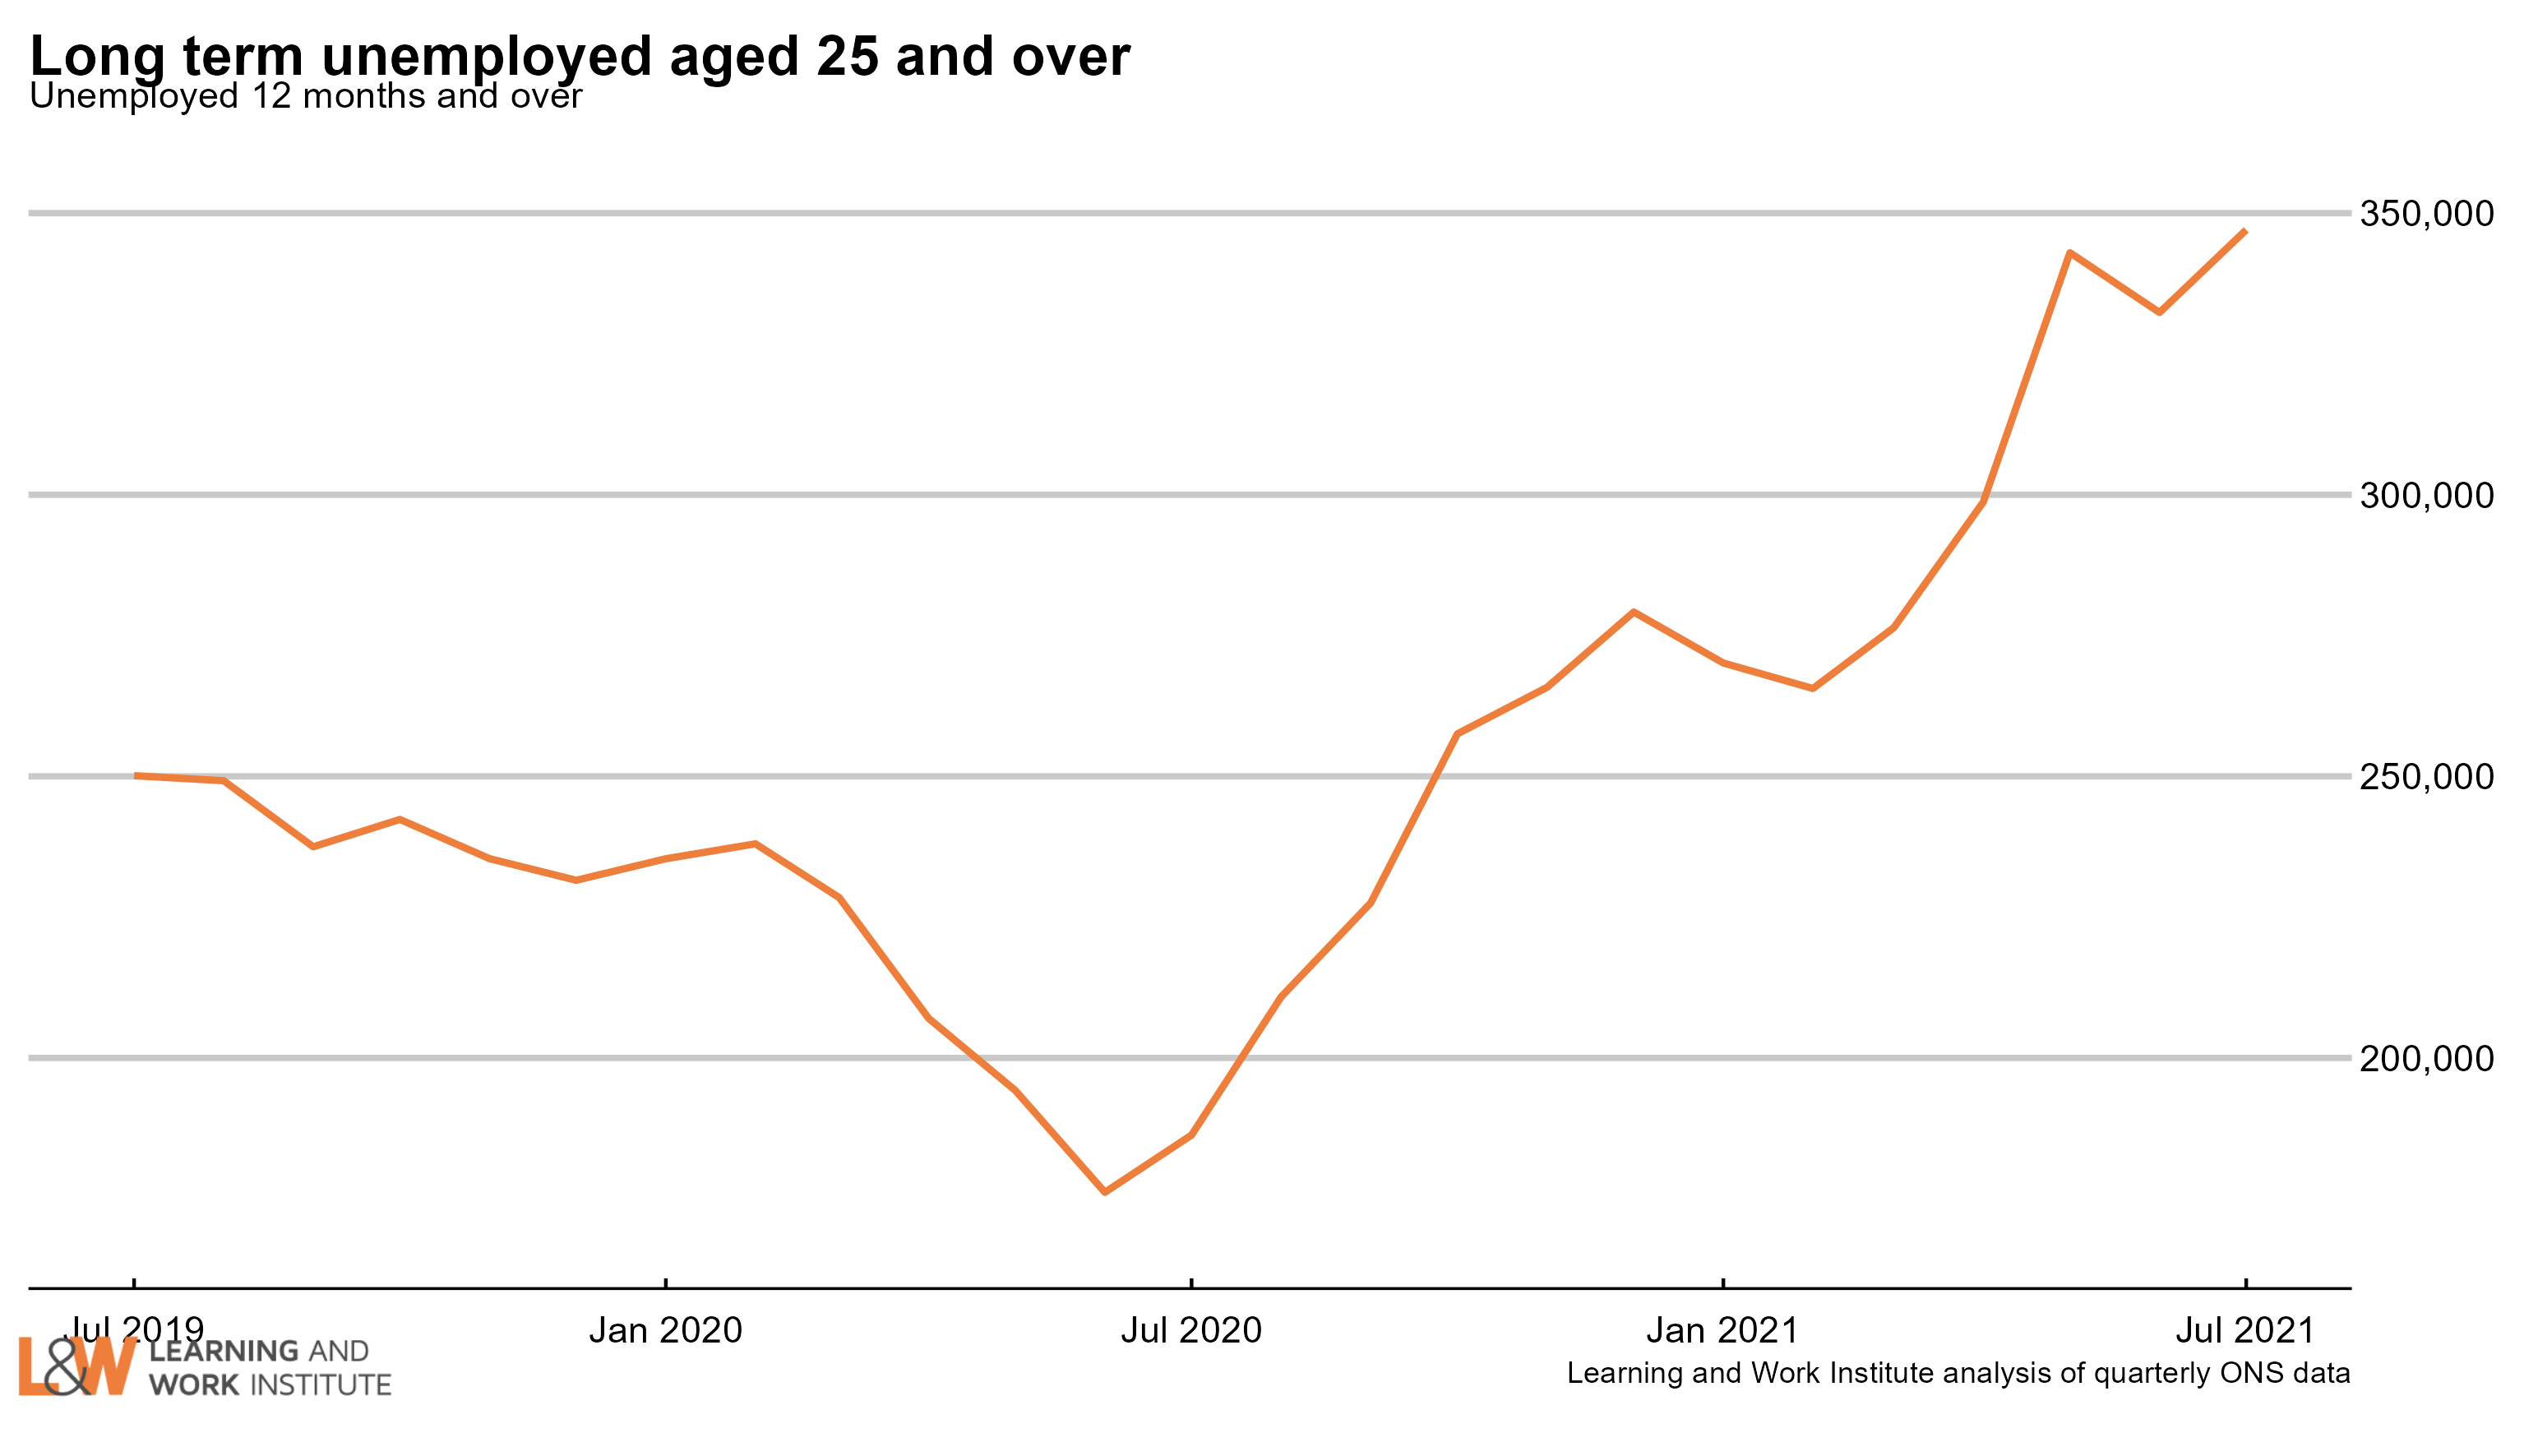
Chart 7: Unemployment rates by age

The 18 to 24 year old unemployment rate (including students) is 11.0% of the economically active – excluding one million economically inactive students from the calculation. The rate for those aged 25 to 49 is 3.5%. For those aged 50 and over it is 3.3%. The quarterly change is down 1.0 percentage points for 18 to 24 year olds, down 0.2 points for 25 to 49 year olds, and down 0.3 points for the over-50s. chart 5
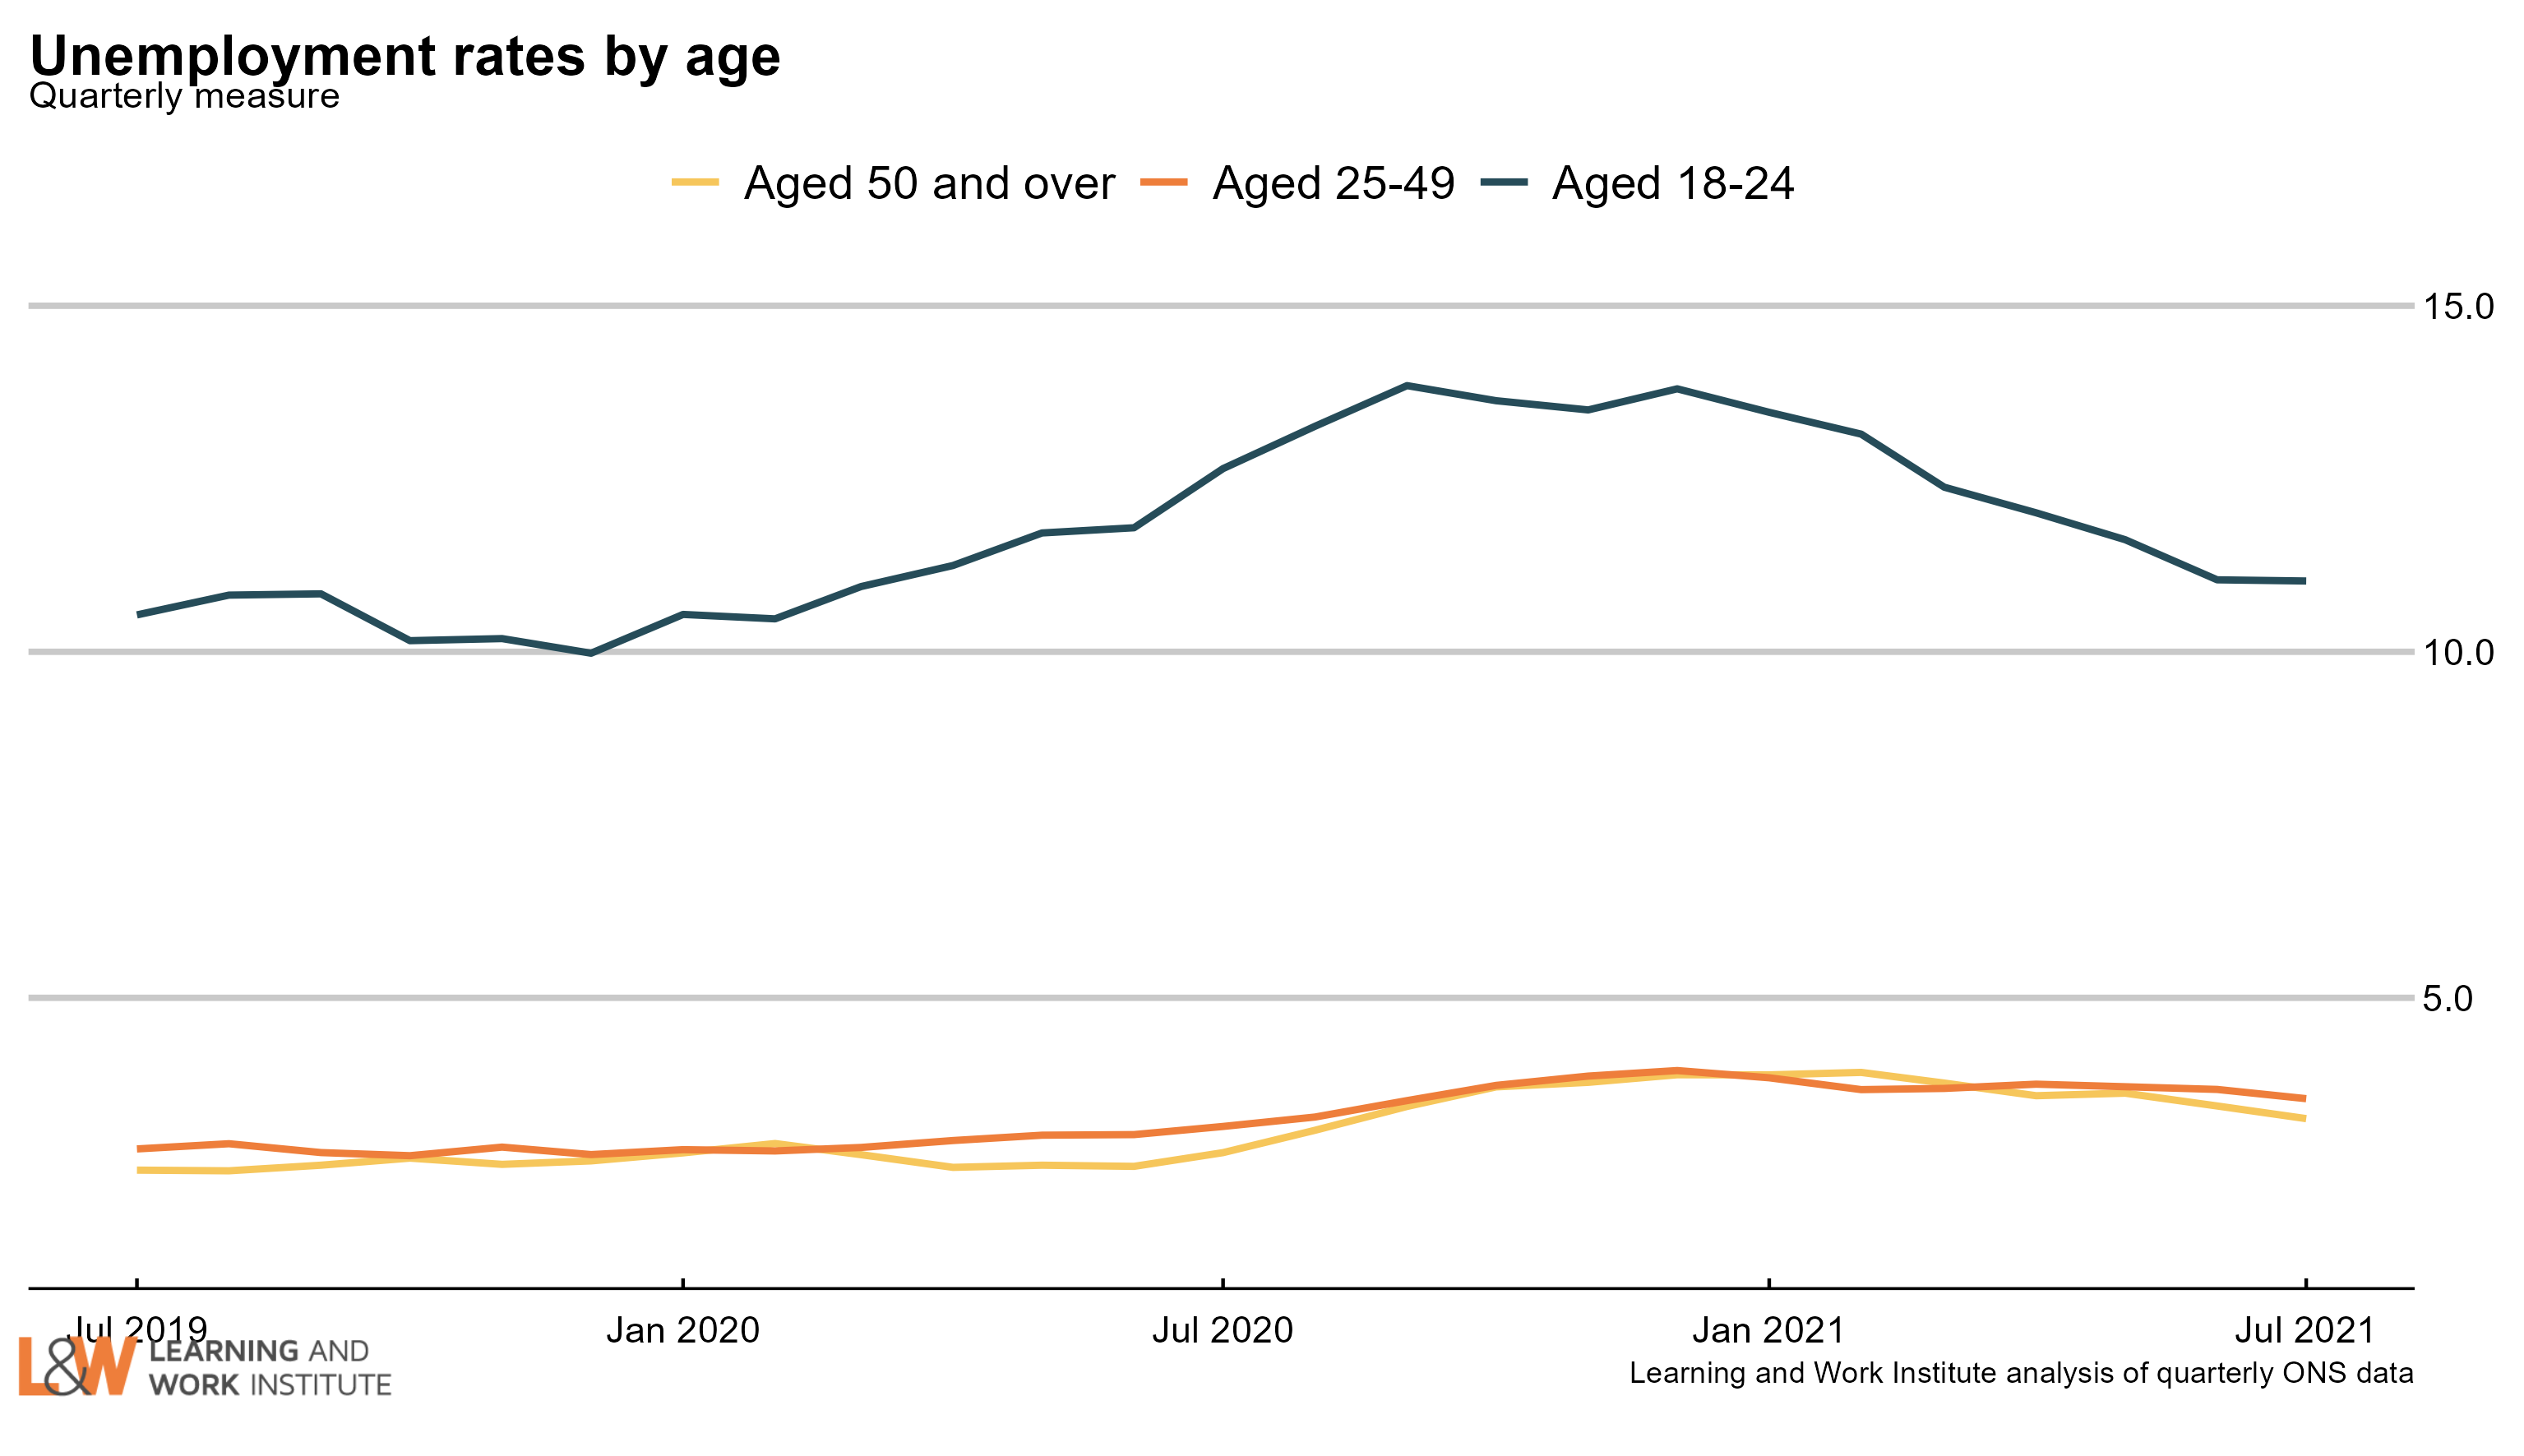
Chart 8: Unemployment rate changes by age (counting February 2020 as 100)

The 18 to 24 year old unemployment rate (including students) is 0.5 percentage points higher than in February 2020. The change for those aged 25 to 34 is up 0.8 points. The change for those aged 35 to 49 is up 0.7 points. The change for those aged 50 to 64 is up 0.4 points. The change for those aged over 65 is up 0.1 points.

chart 5

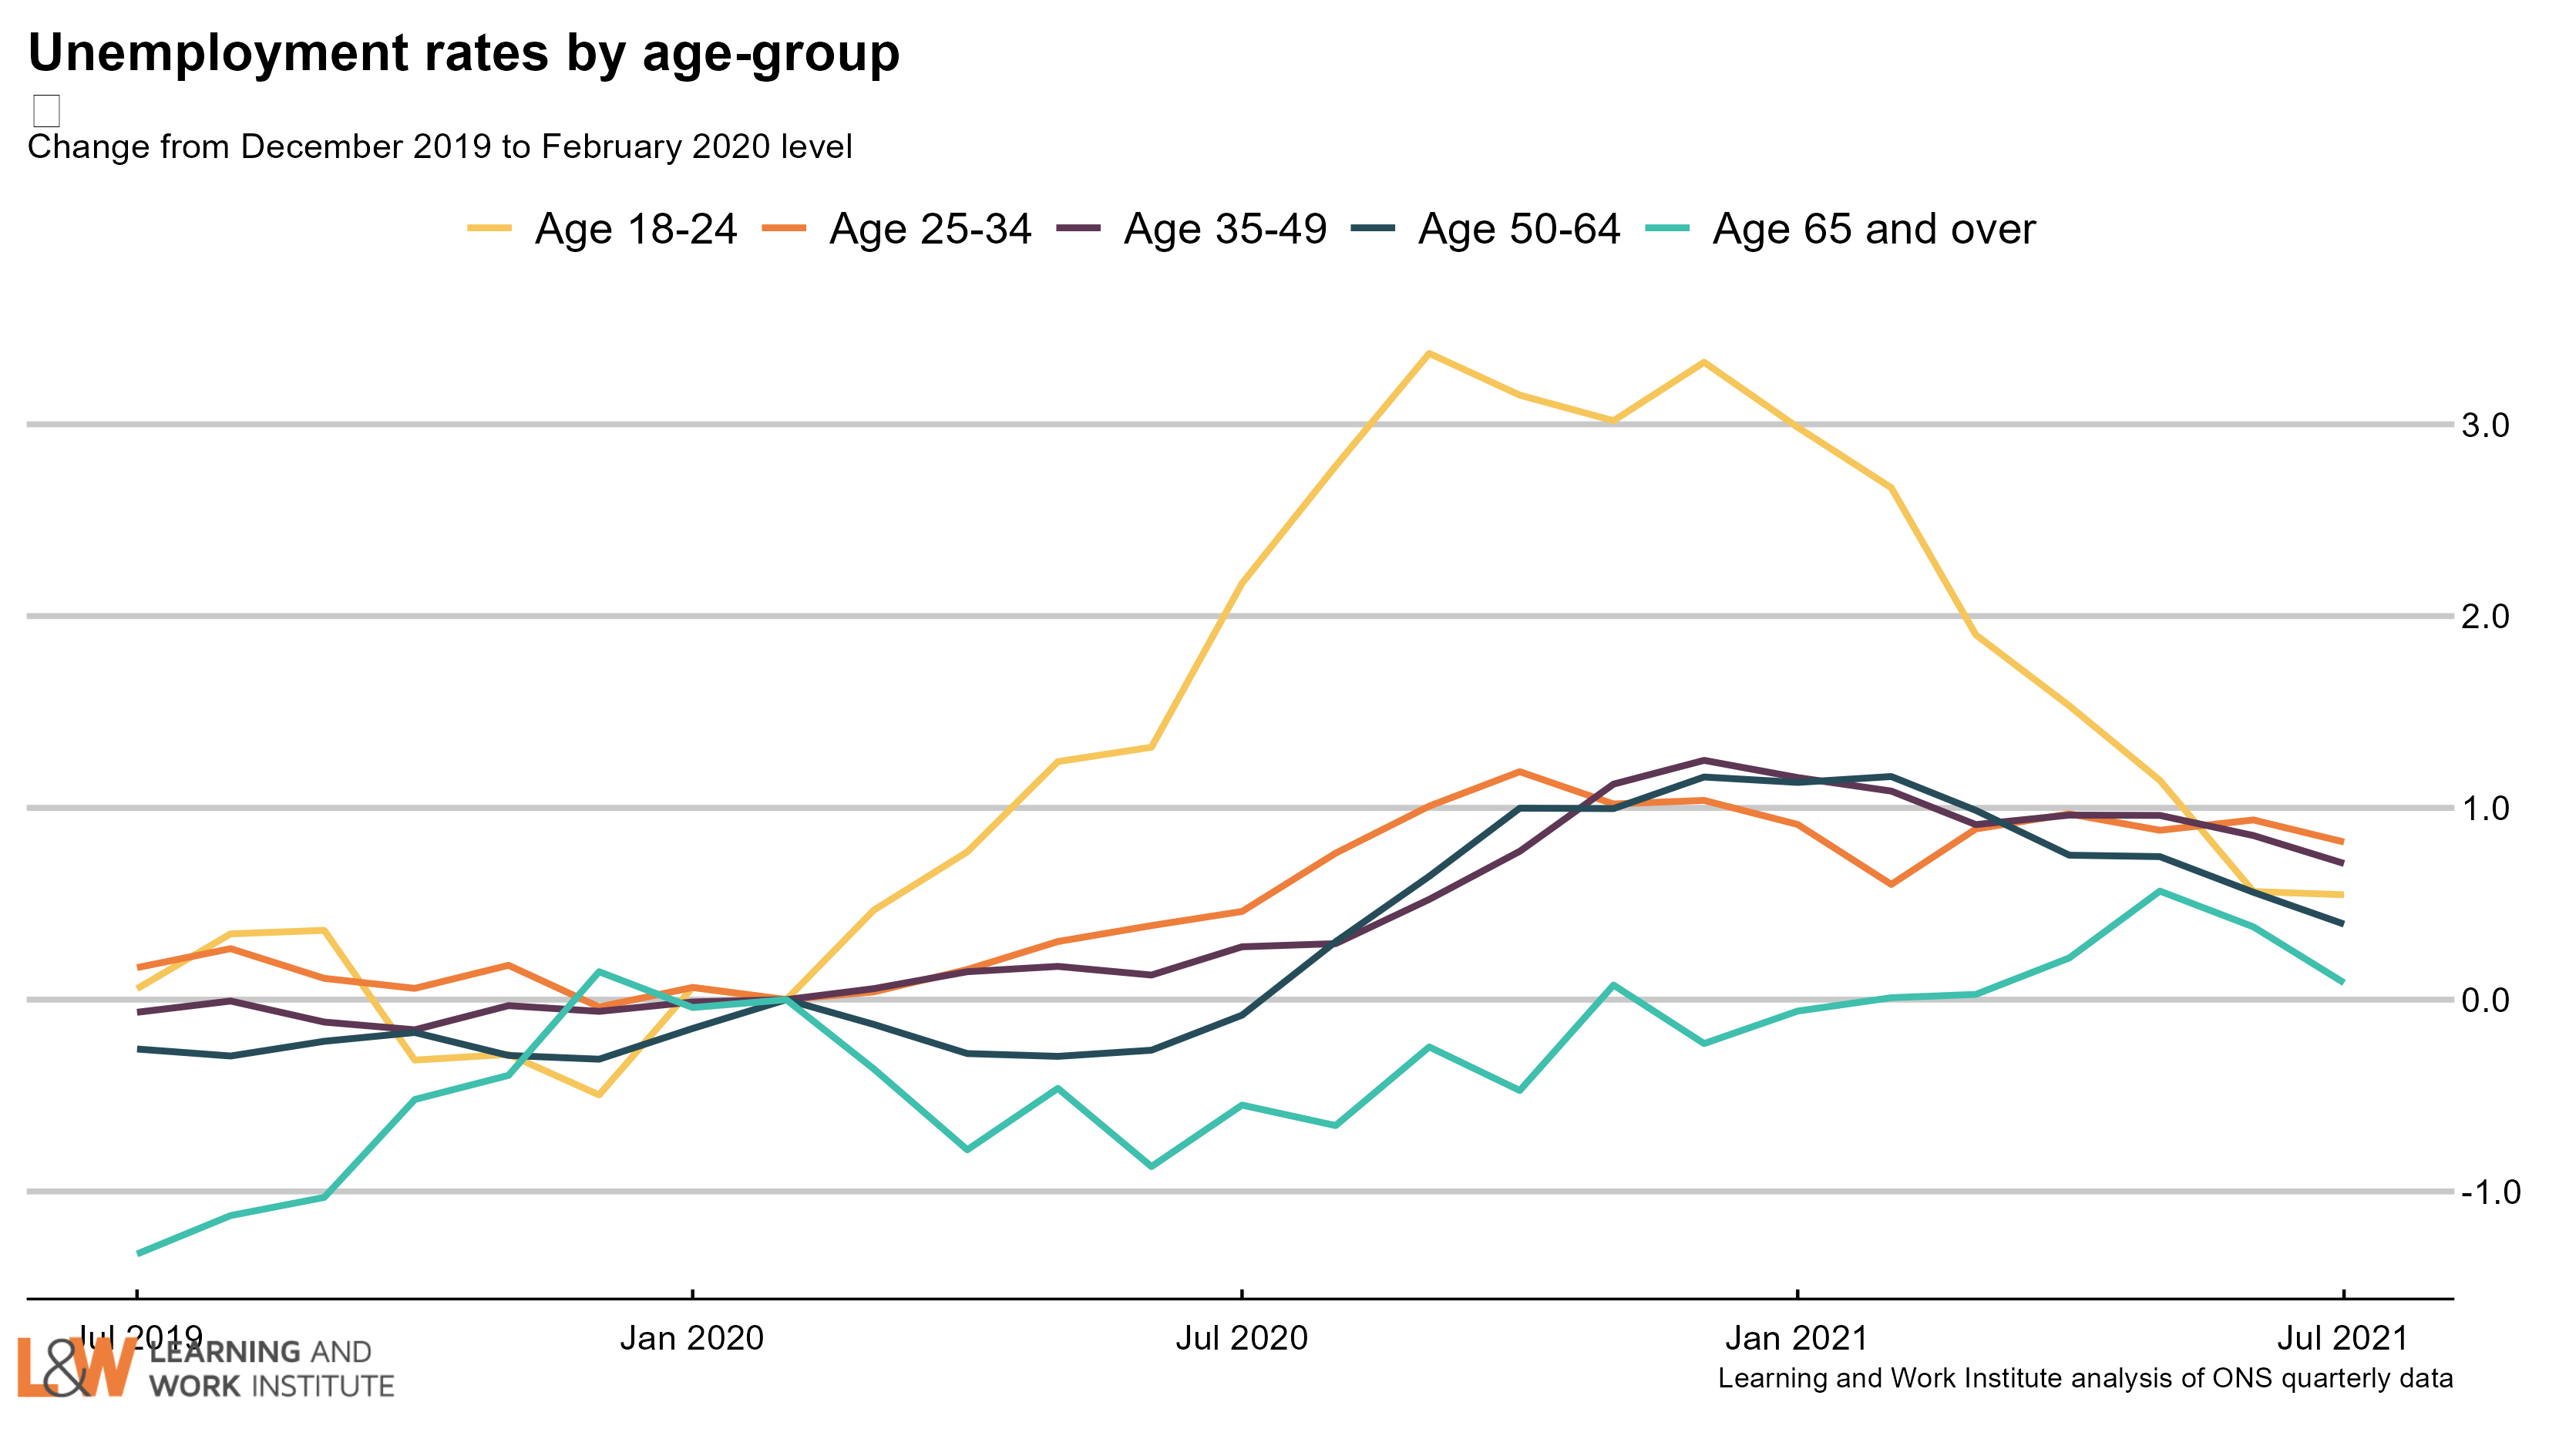
Chart 9: Vacancies – whole economy survey


Headline vacancies this month increased by 75,000 to 1,034,000. The ONS' experimental single-month vacancy figures has risen by 210,000 in the last quarter to 1,123,000. The headline ONS vacancy figure is both seasonally adjusted and a three-month average. The chart shows both series. chart 13
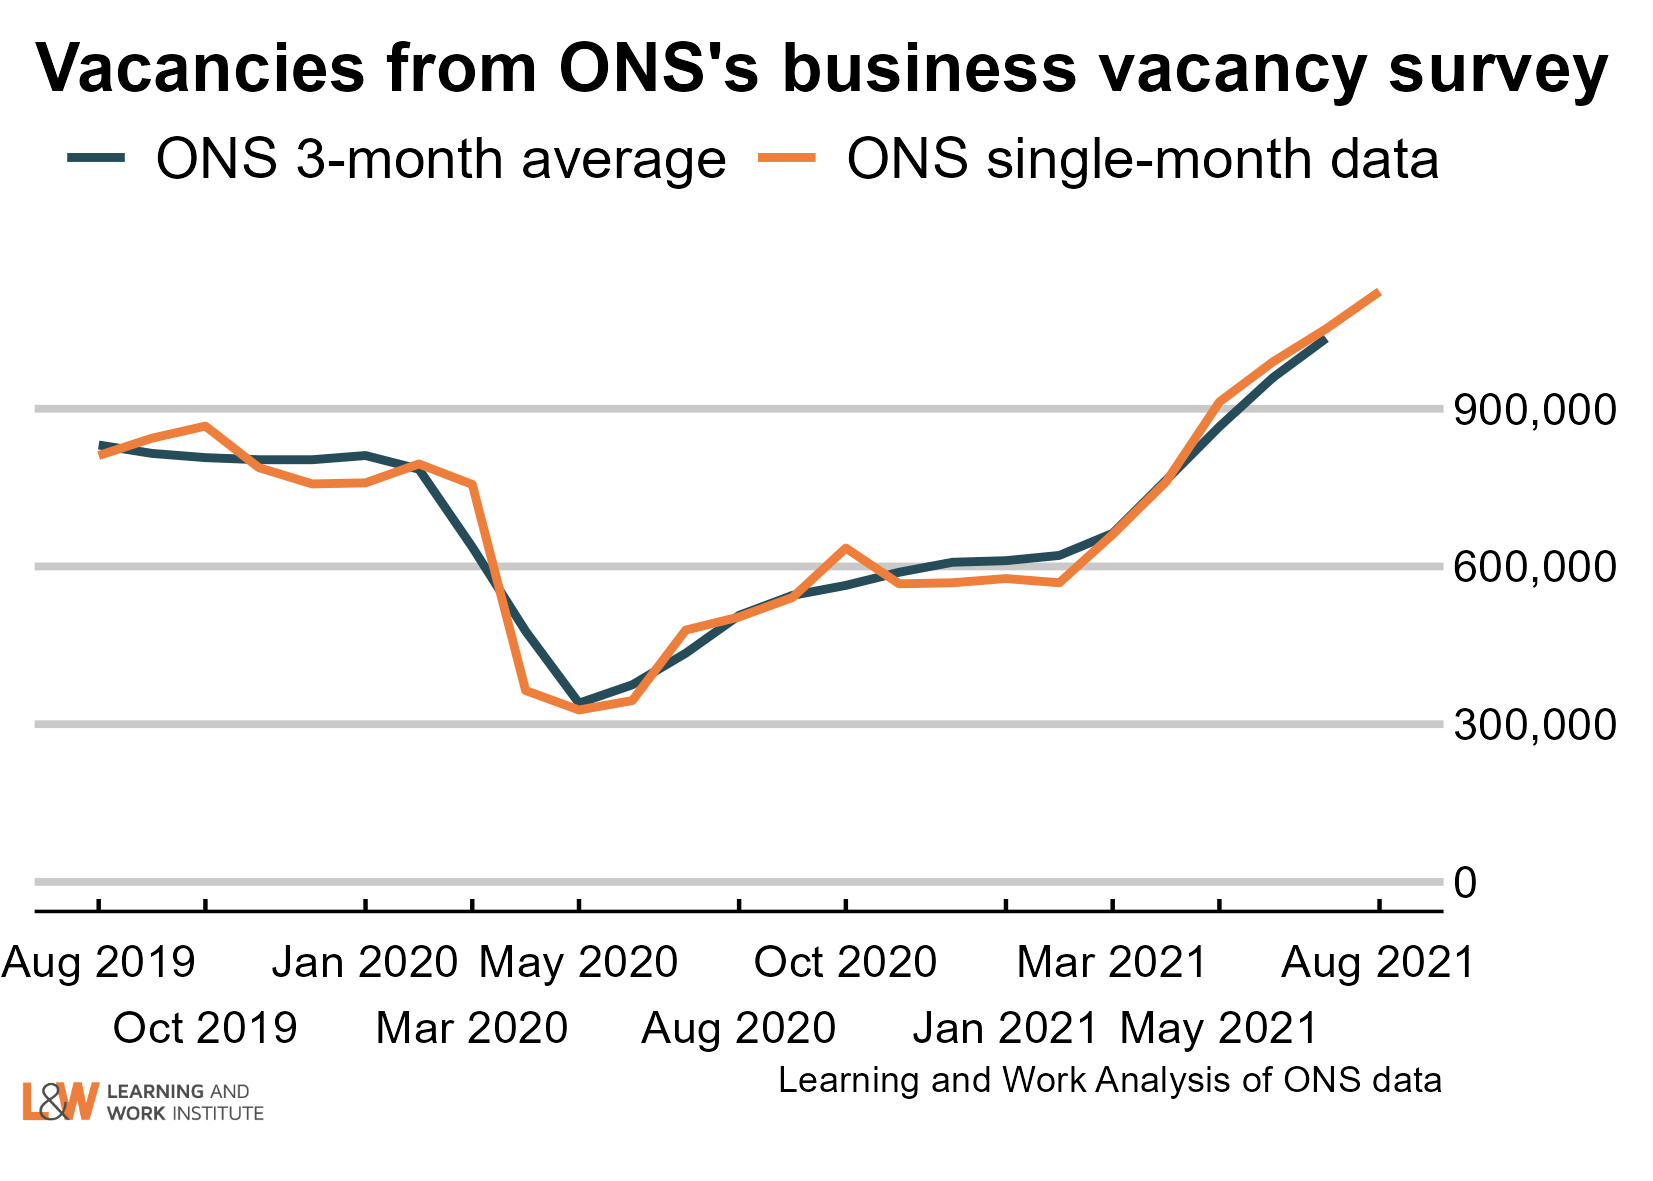
Chart 10: Experimental single month vacancies – whole economy survey change since 2019

The Office for National Statistics' experimental single month vacancy estimates include sectoral information. Here, we show the changes on the same month two years ago, before the pandemic. The data is not seasonally adjusted, so comparisons with the same month each year are better. The numbers are thousands of vacancies, under each number, and on the right, the change in thousands of vacancies. chart 13
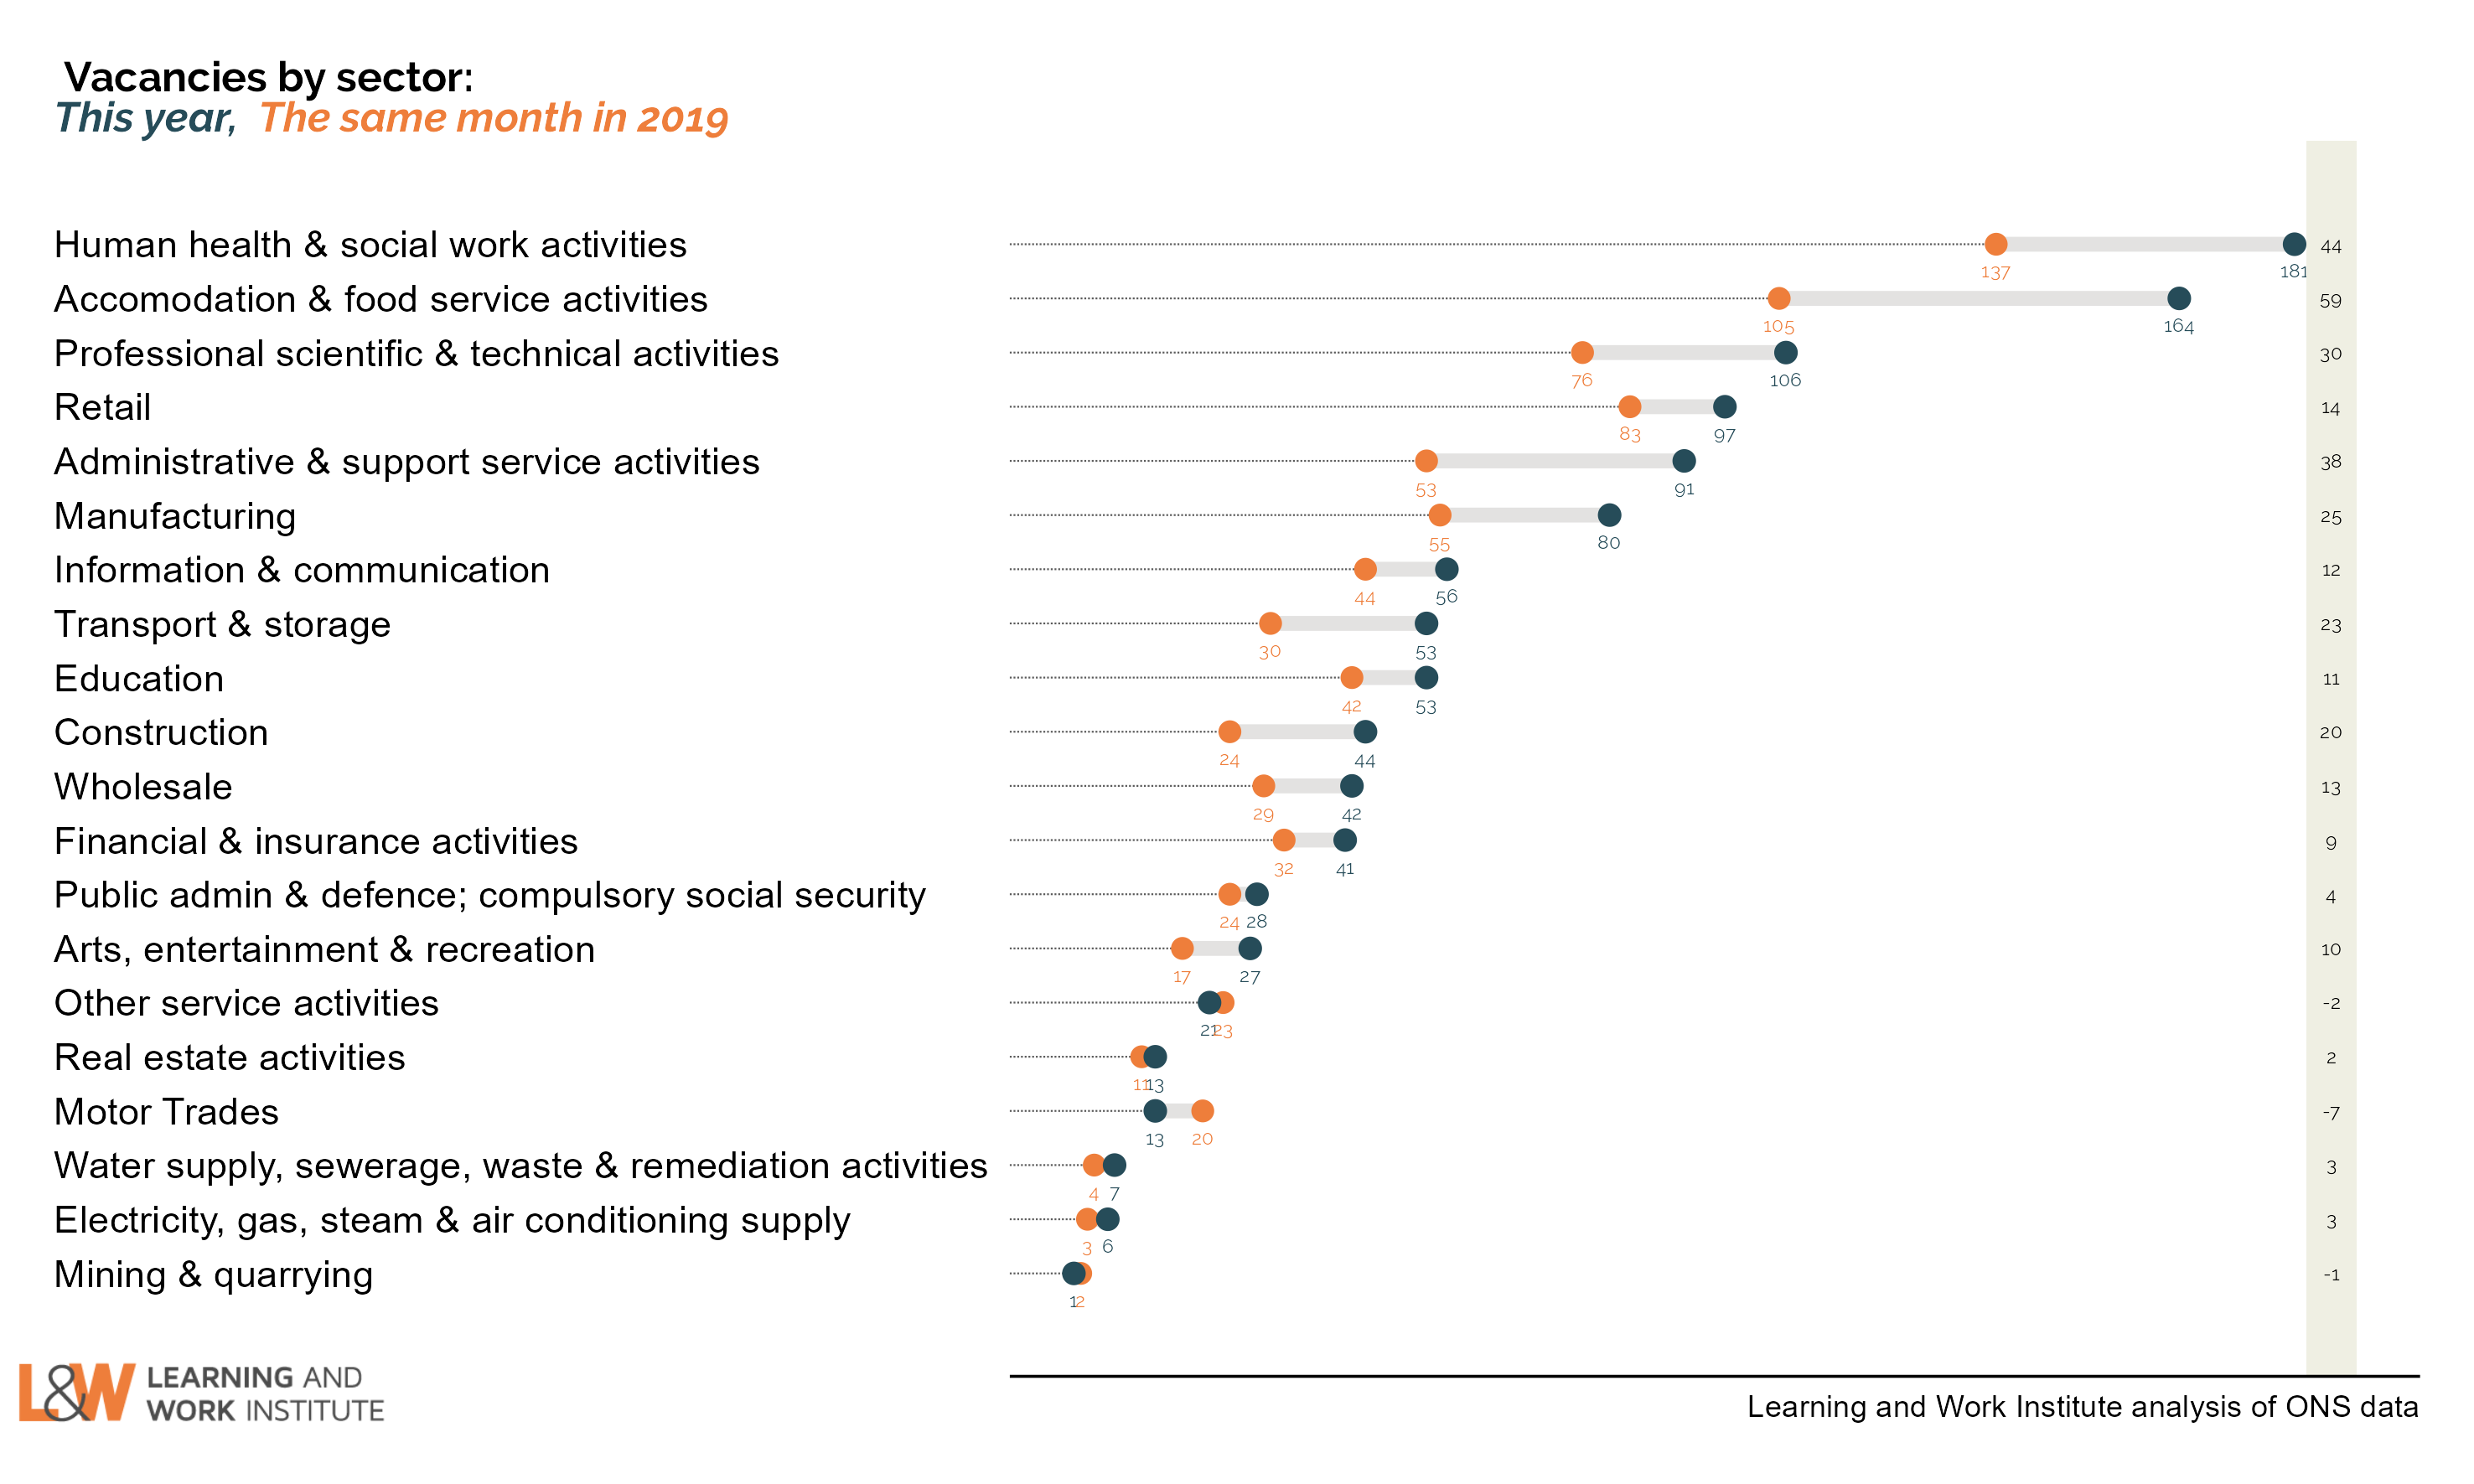
Chart 11: Unemployed people per vacancy

There are 1.6 unemployed people per vacancy. This has now reached the same level as pre-pandemic levels. chart 14
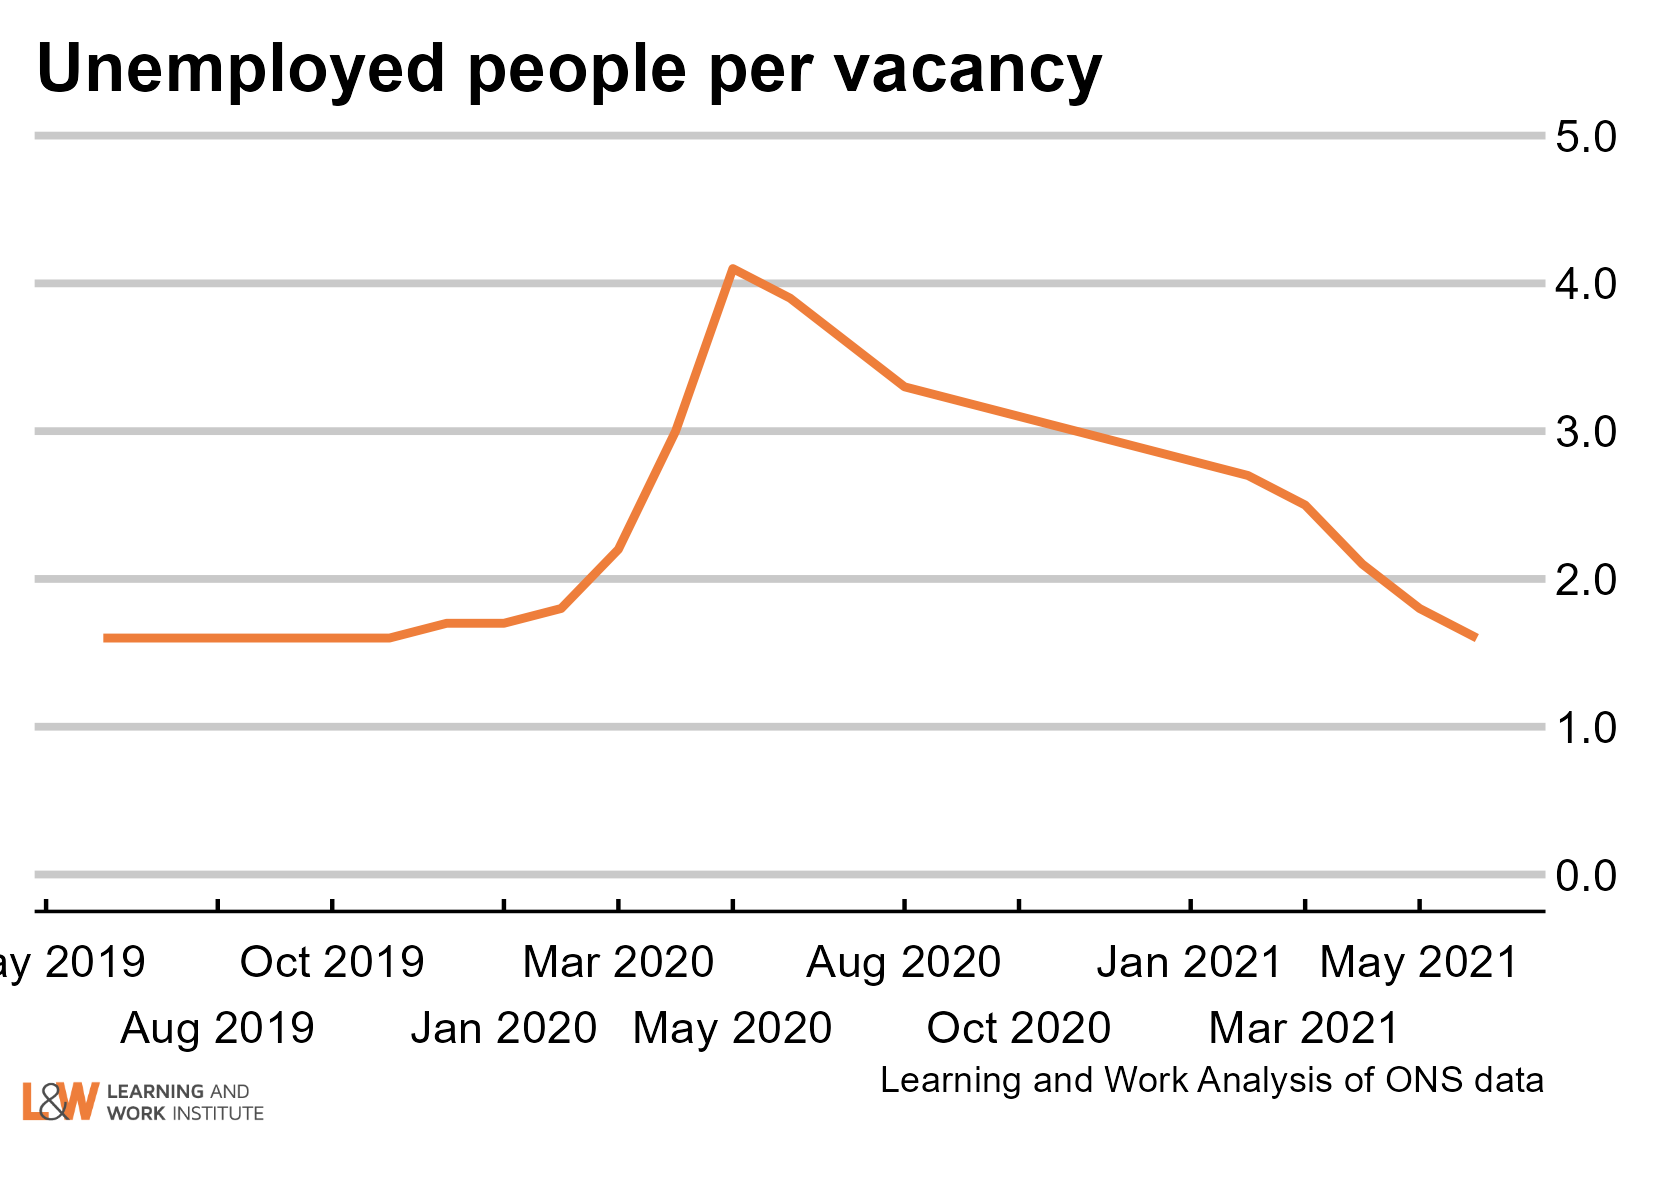
Chart 12: Online vacancies to early September from Adzuna

The online vacancies figures covering the period up to Friday, September 3, 2021 show that that vacancies remained at a very high level compared to the whole period since February 2018 (when this data starts). Overall online vacancies are up to 128% of the Feb 2020 level. They are 5% from their peak. Compared with the same week in 2018, the overall vacancy level is up 10%. chart 14
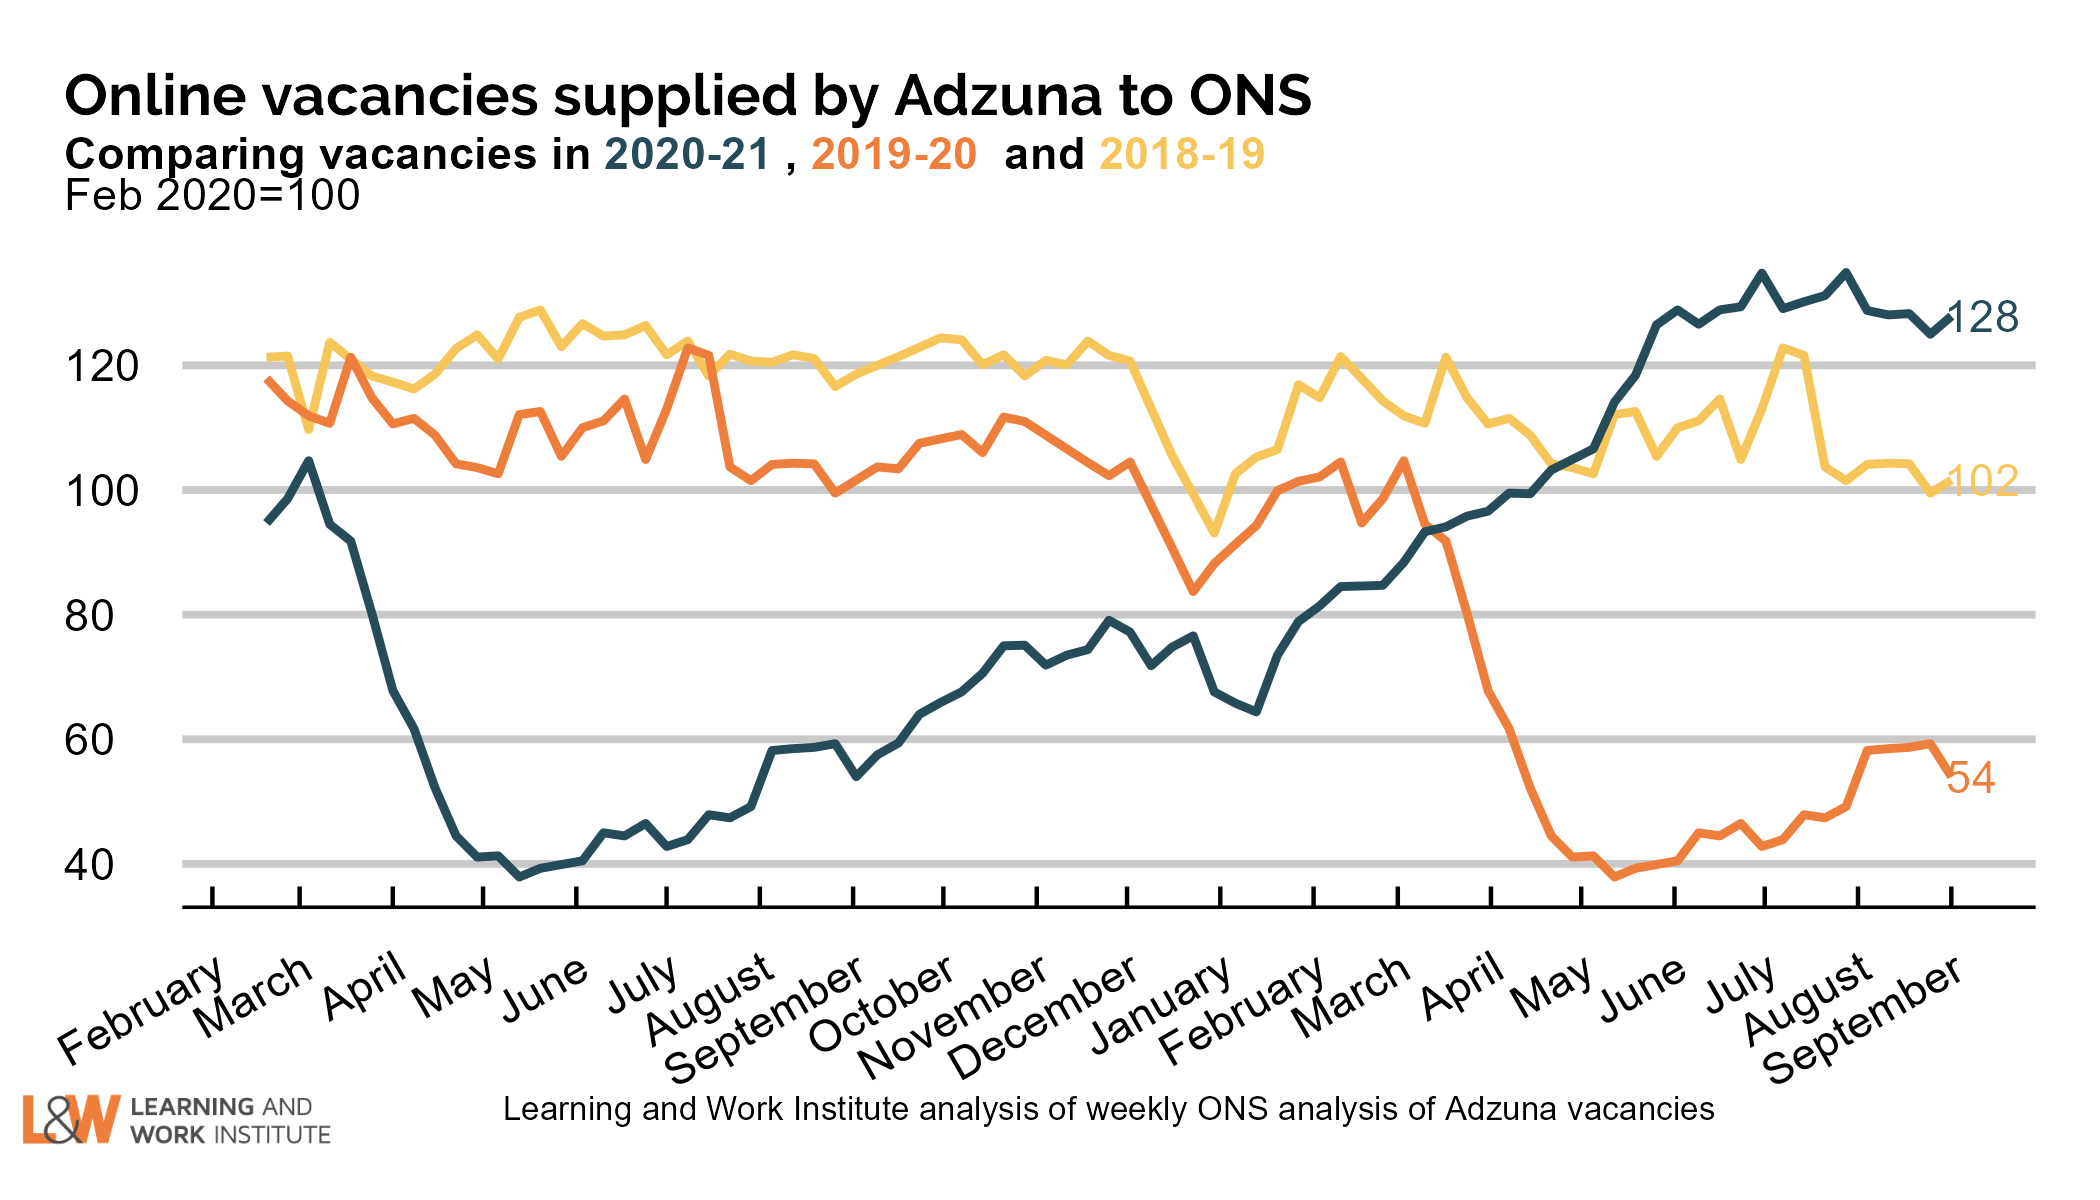
Chart 13: UK employment

Employment rose by 81,000 on the figure published last month, to 32,357,000. The chart shows both the official figures and the experimental weekly figures. The trend is likely to be upwards. chart 15
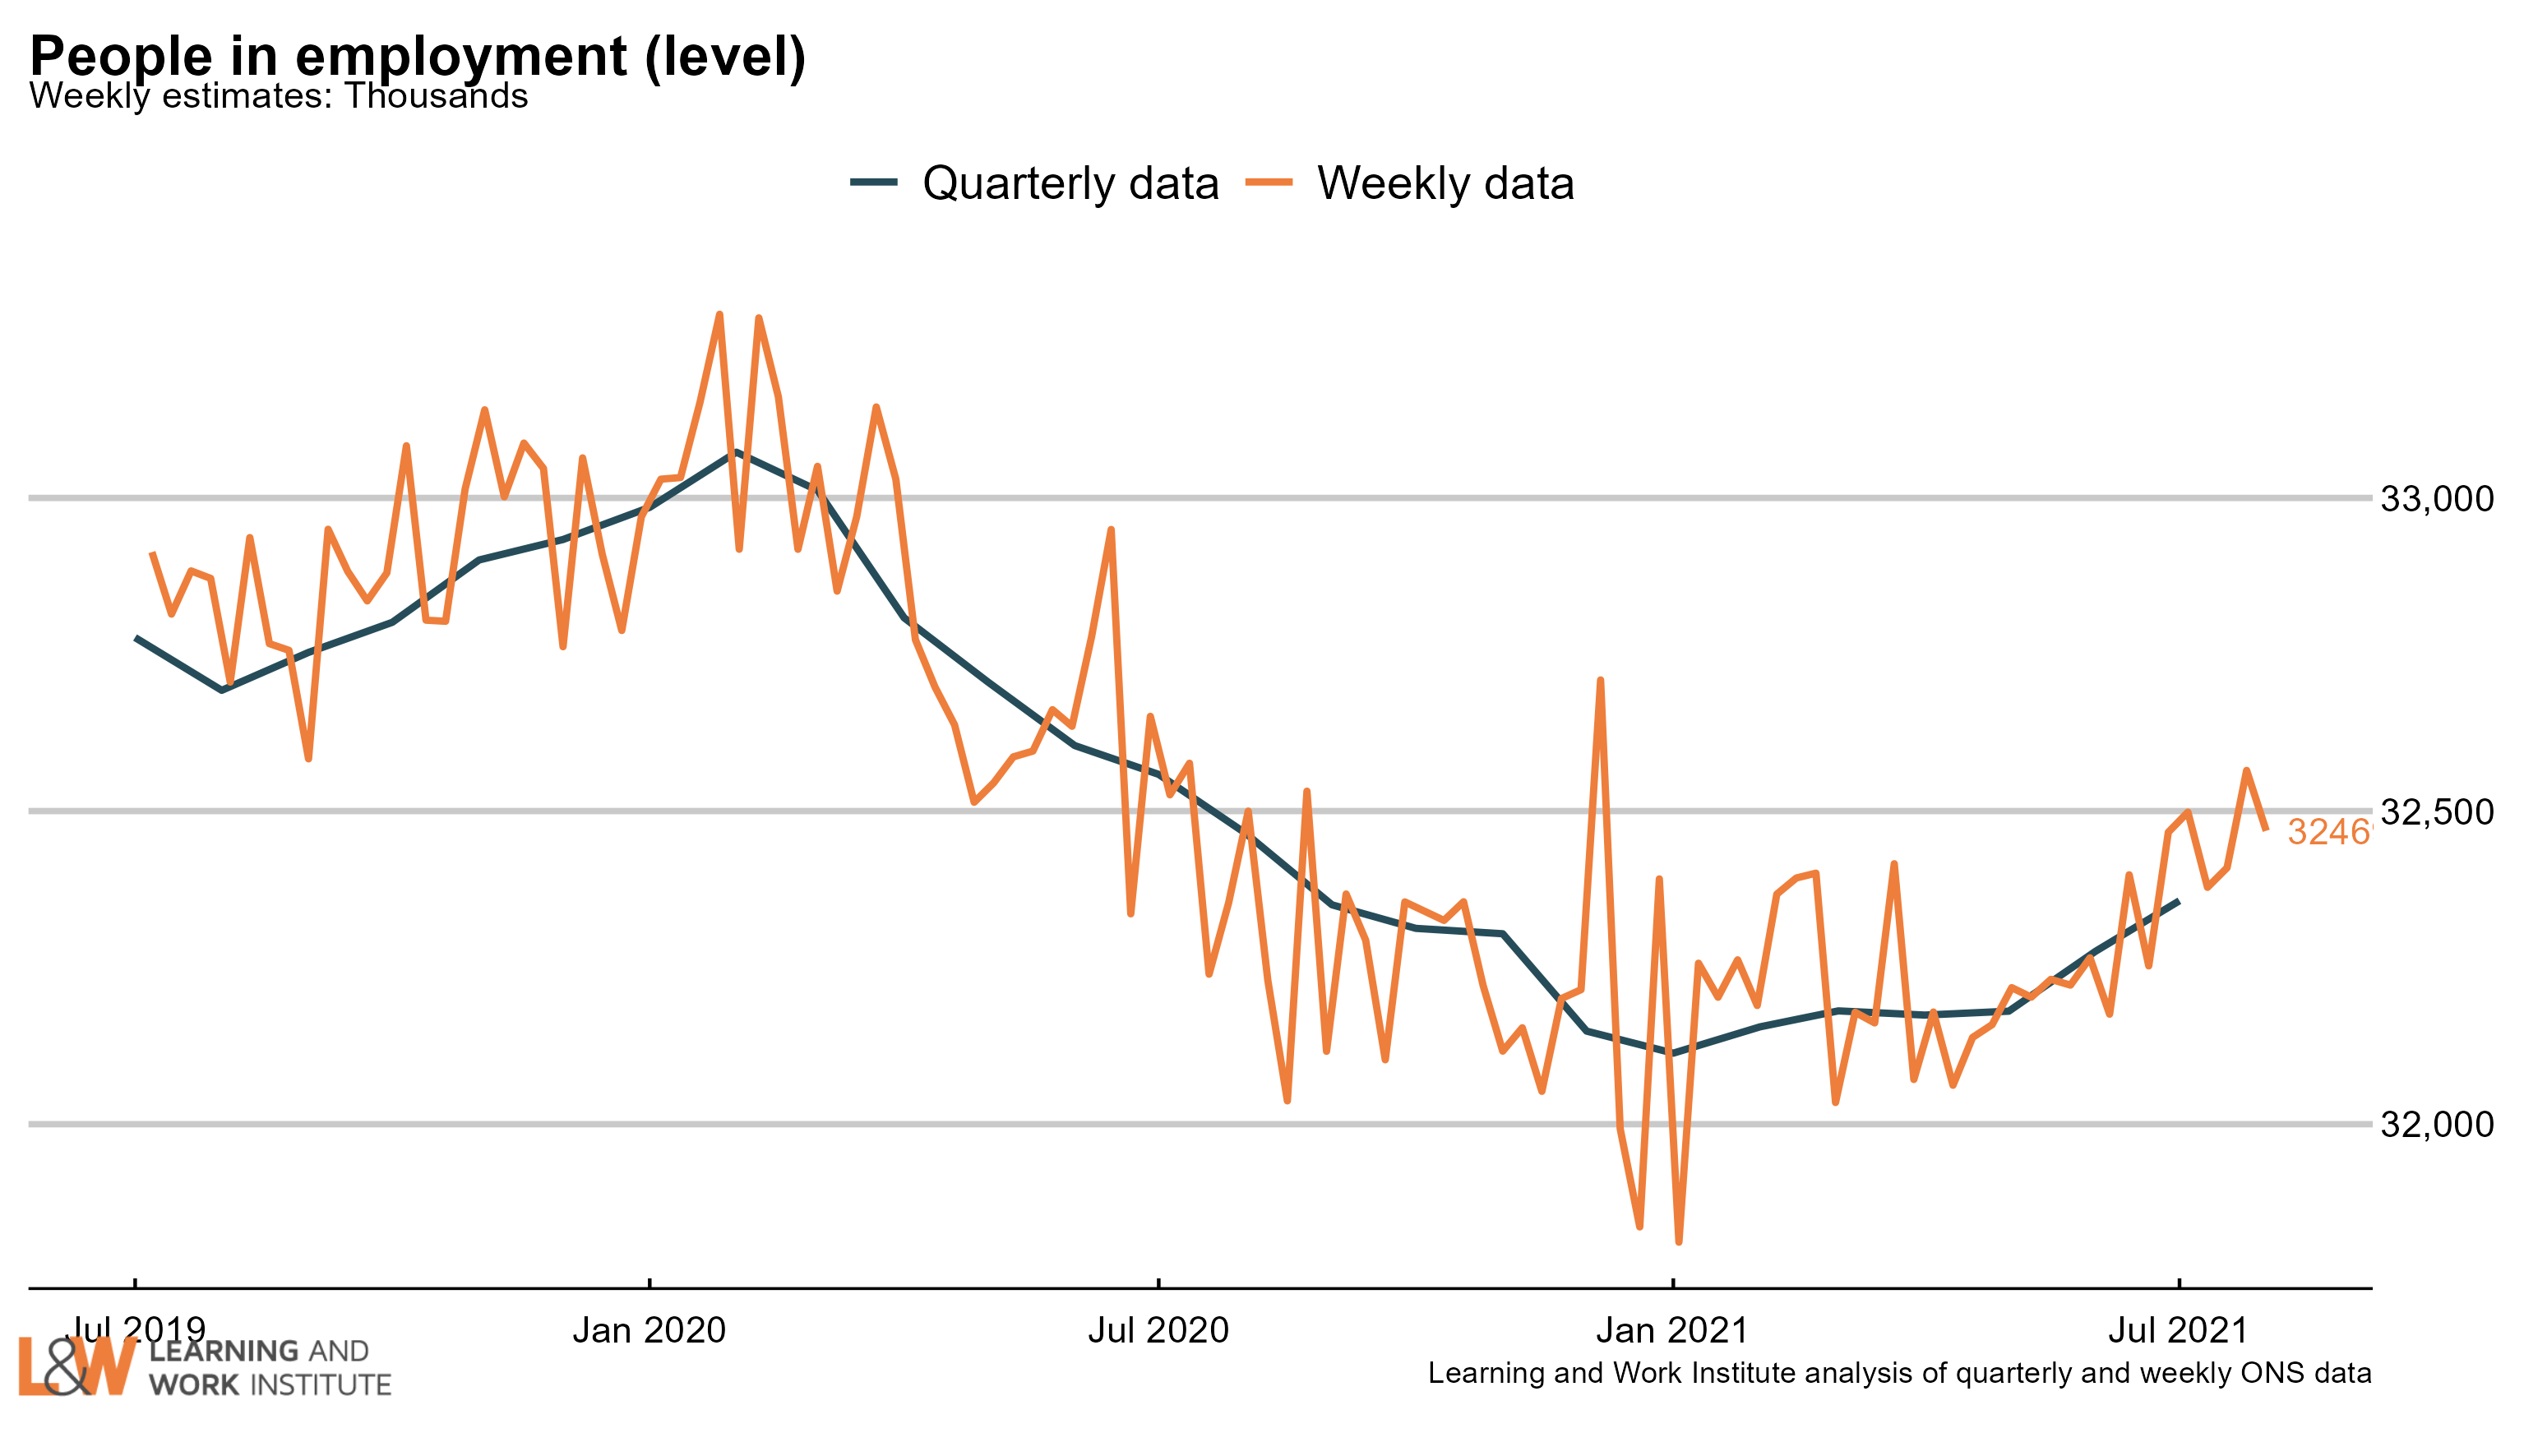
Chart 14: Employment rate in the UK

The employment rate rose by 0.5 percentage points over the quarter, to 75.2%. The chart shows both the official figures and the experimental weekly figures. The trend is likely to be upwards. The experimental weekly estimates show an employment rate of 75.5% at the end of July. chart 16
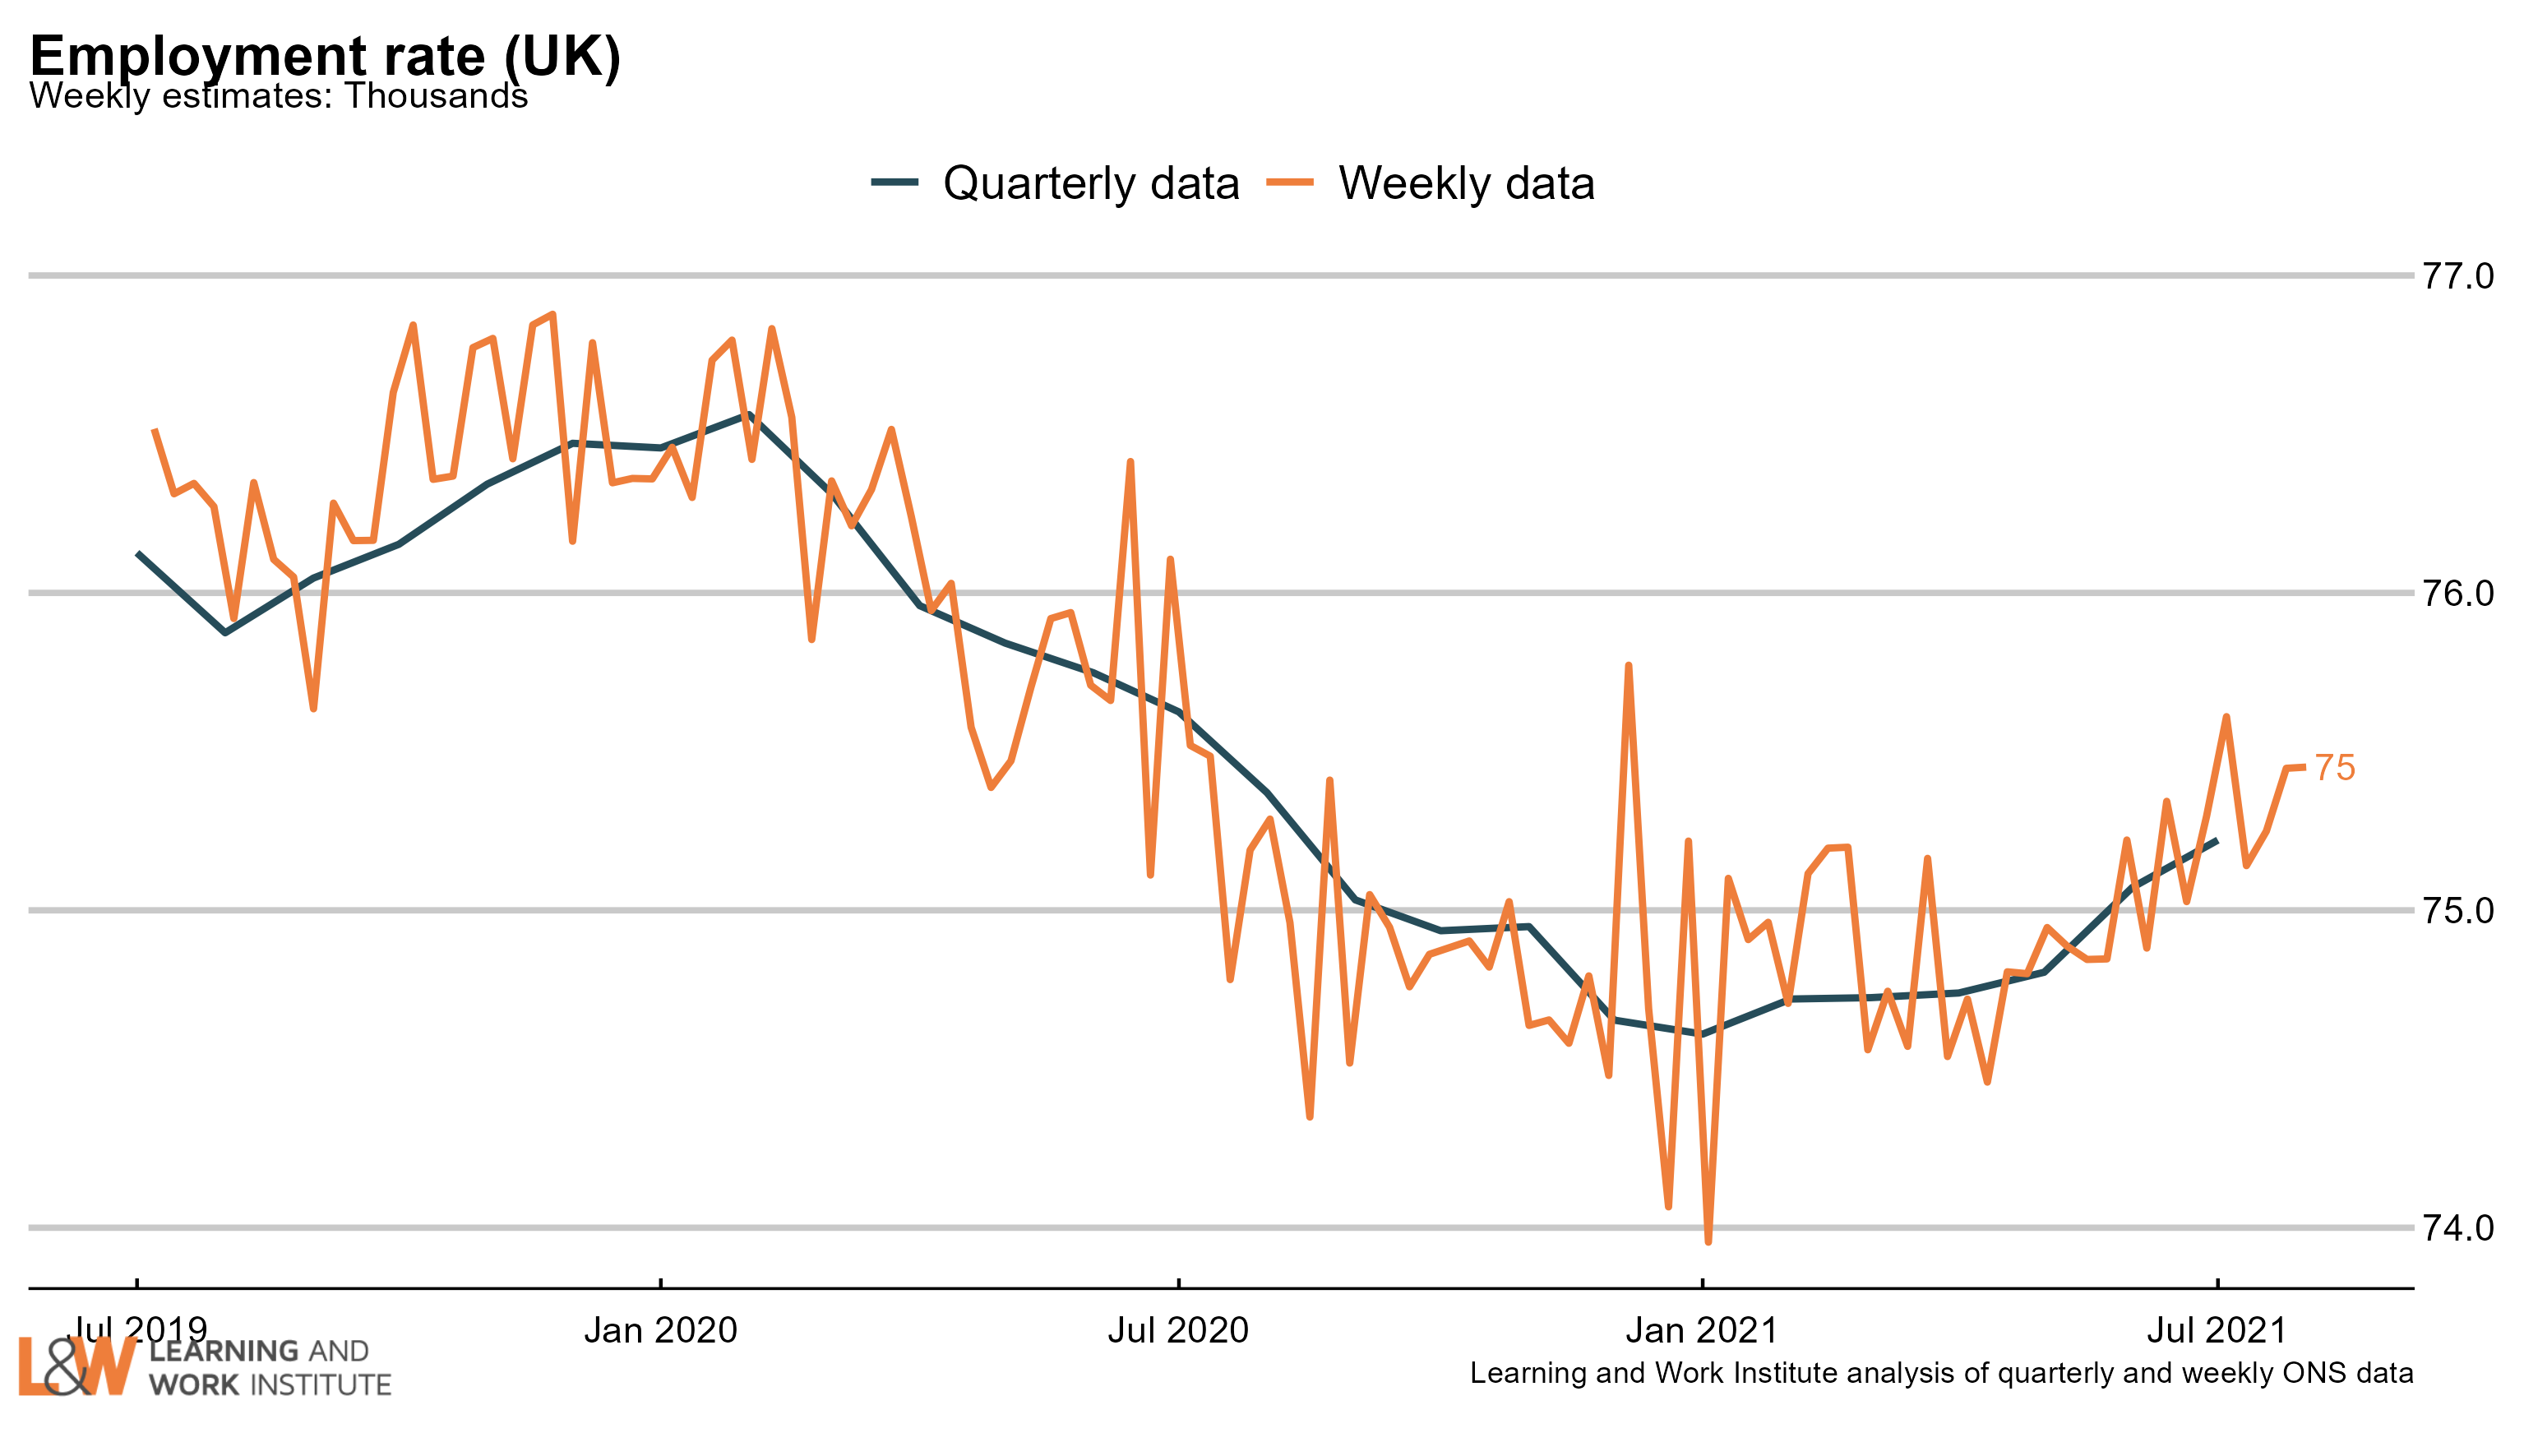
Chart 15: Economic inactivity – the long-term sick or disabled

The numbers of people who are economically inactive, - not working and not currently looking for work - who are long-term sick or disabled has been trending downwards, but this month shows a rise. There are 2.16 million working age people in this group. chart 17
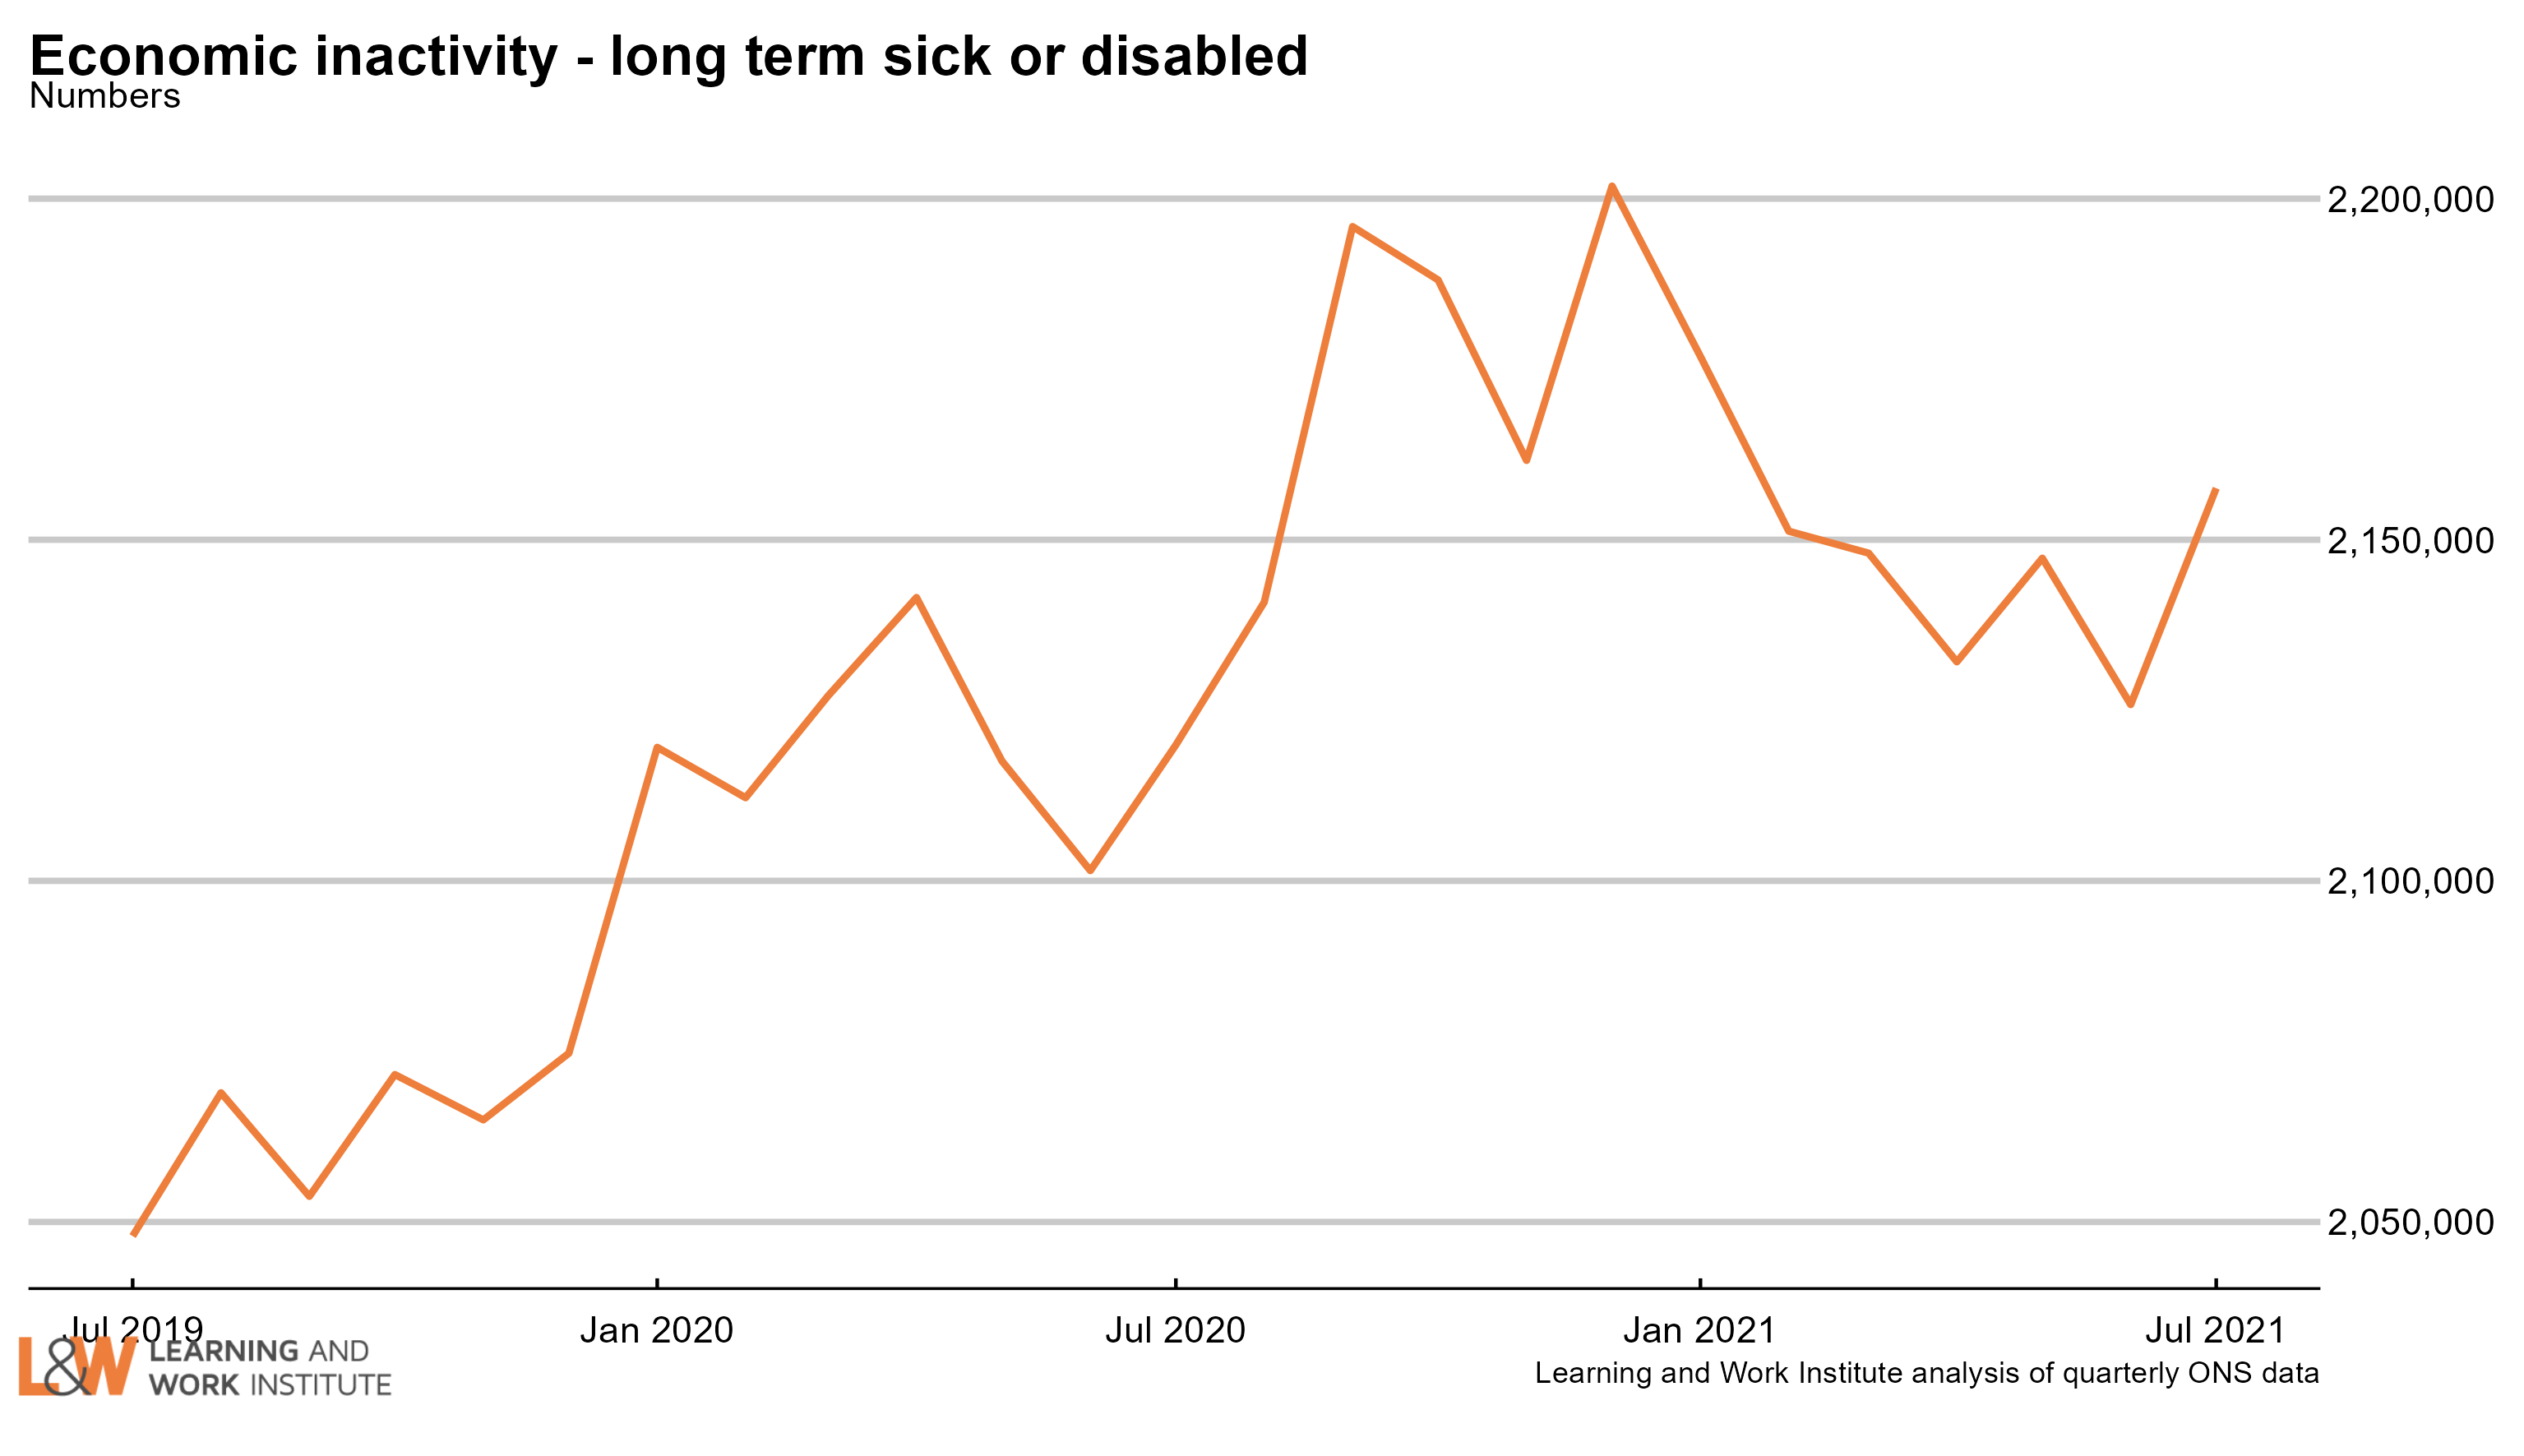
Chart 16: Economic inactivity – people looking after family

The survey figures (showing those looking after family and not doing paid work or looking for paid work) have been trending downwards, but has been flatter in recent months. chart 18
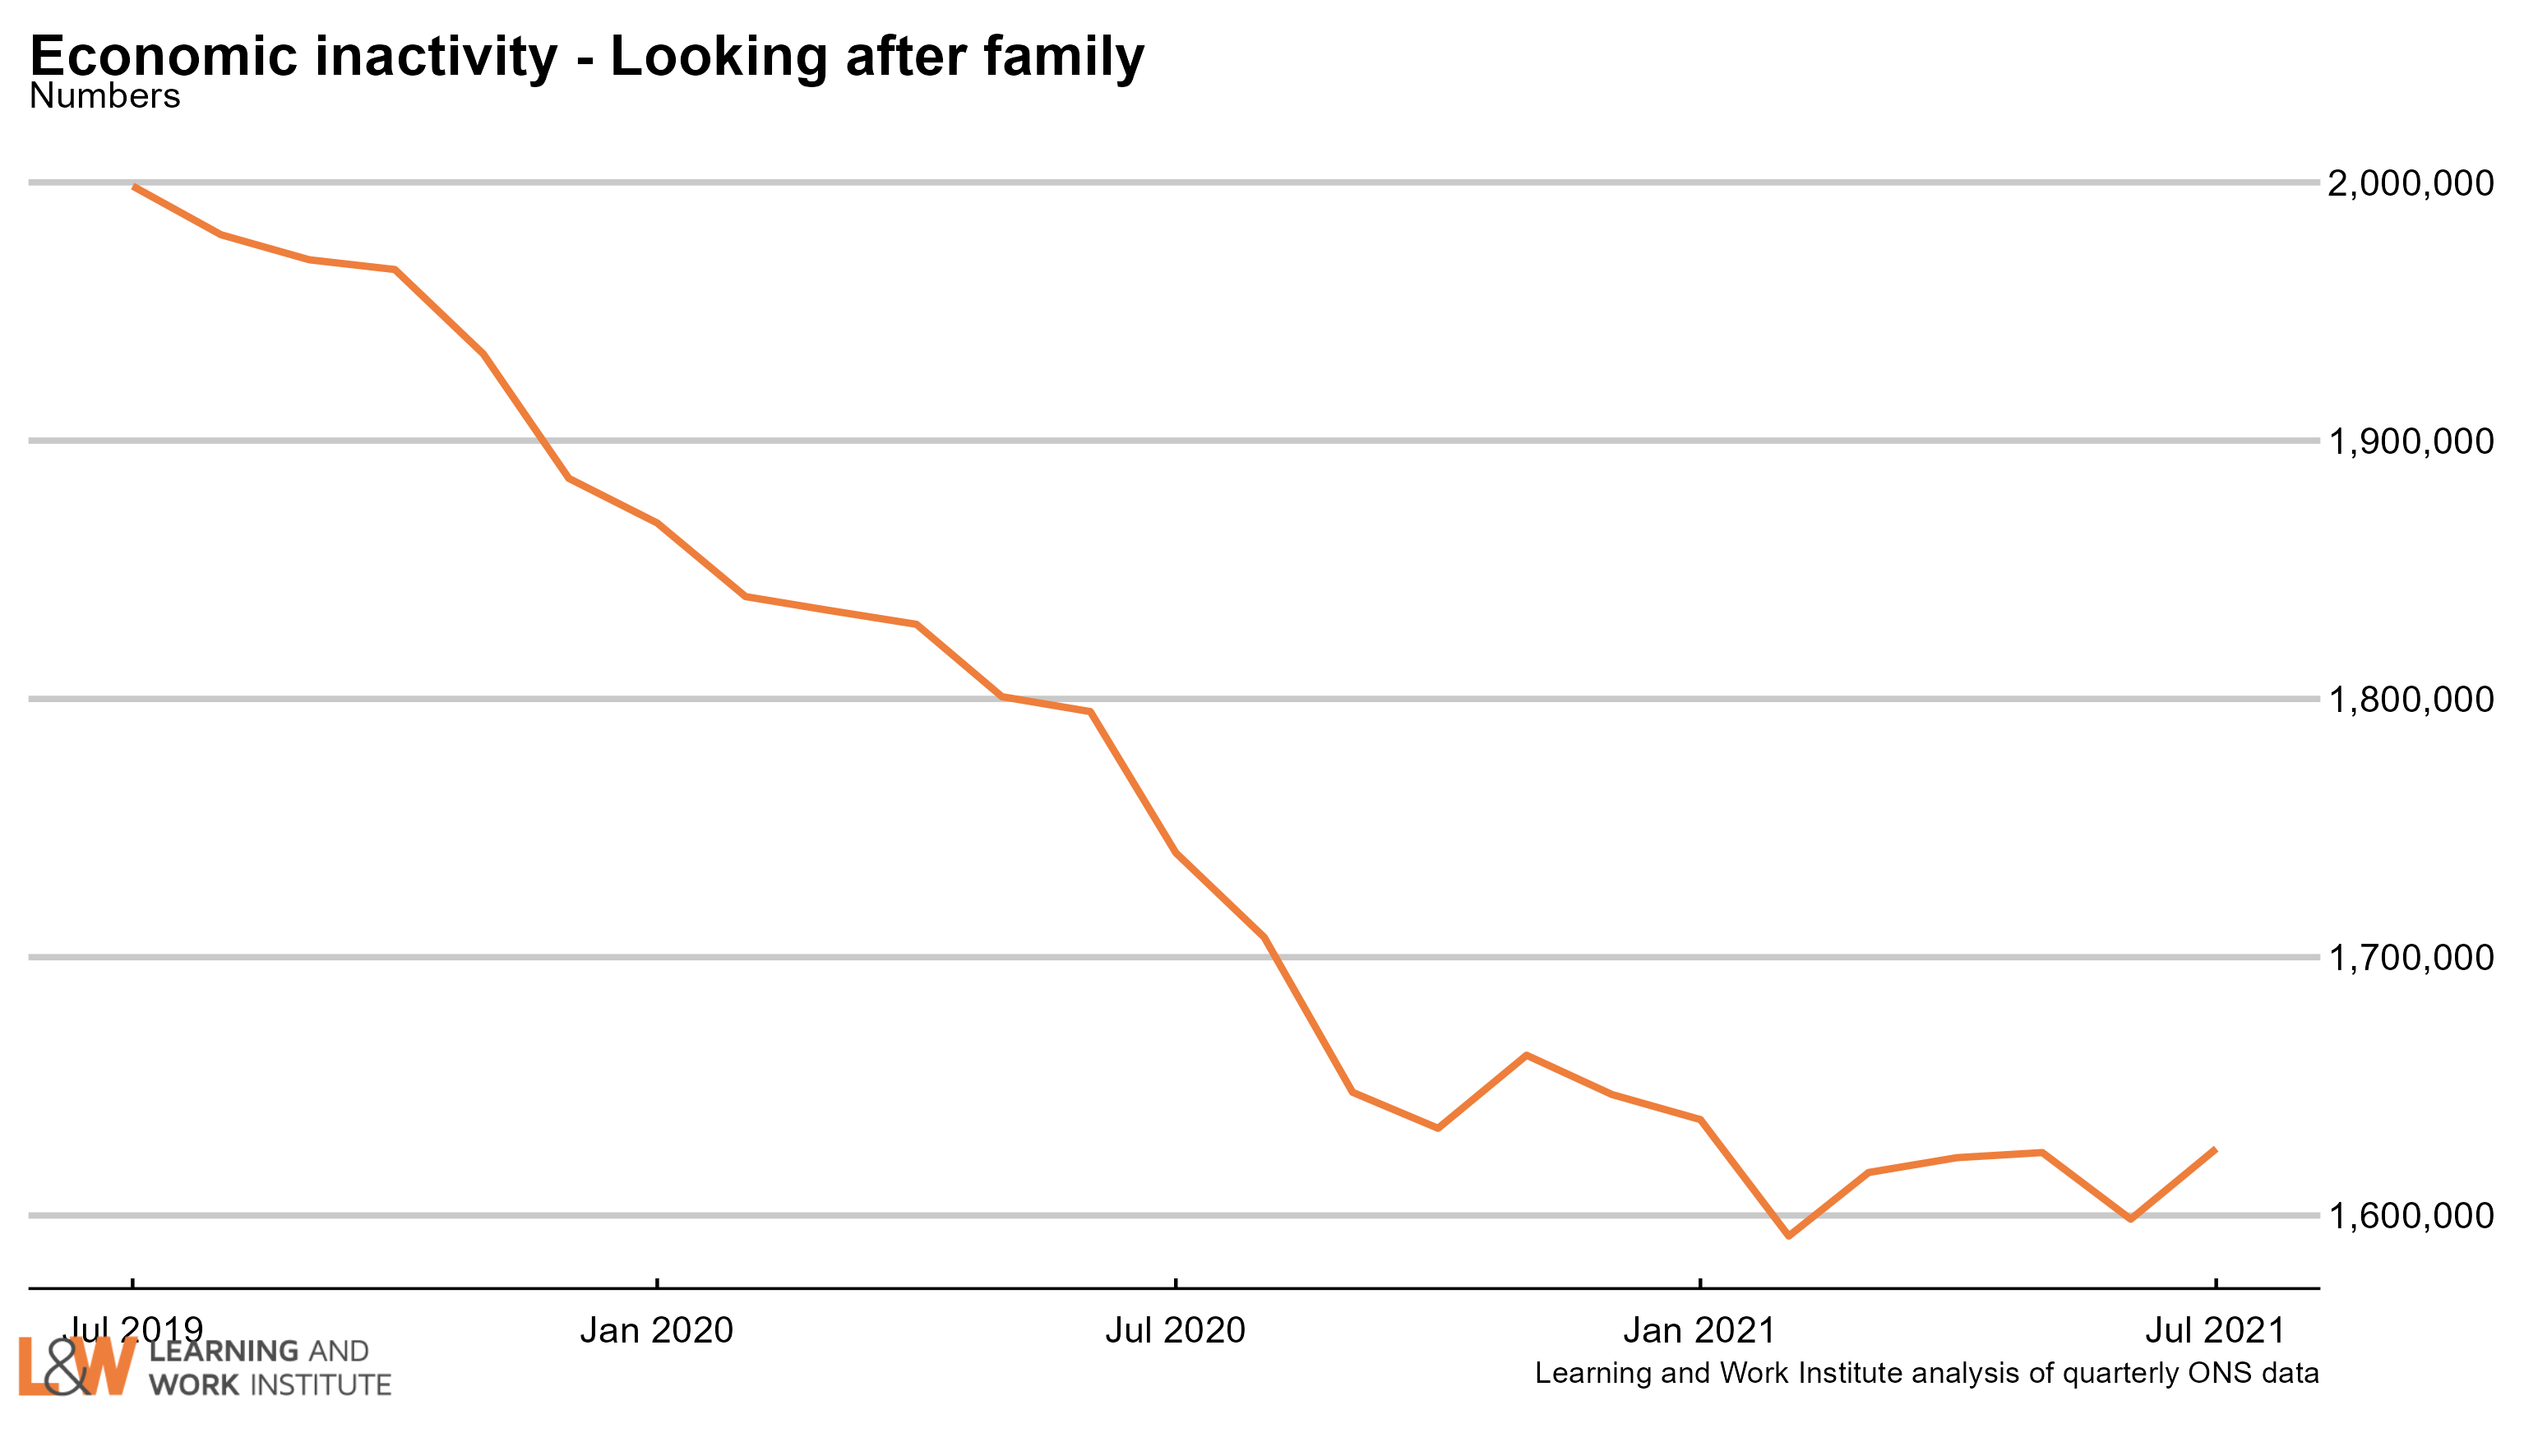
Chart 17: Economic inactivity – other inactive

In the Coronavirus period, people who were not working or looking for work due to Covid were included in this group. The number in this category increased sharply at the time, and has continued at a high level. A very high proportion of this group want to work, and this increased over the period of the pandemic.The increase over the pre-pandemic level is now 99,000. chart 18
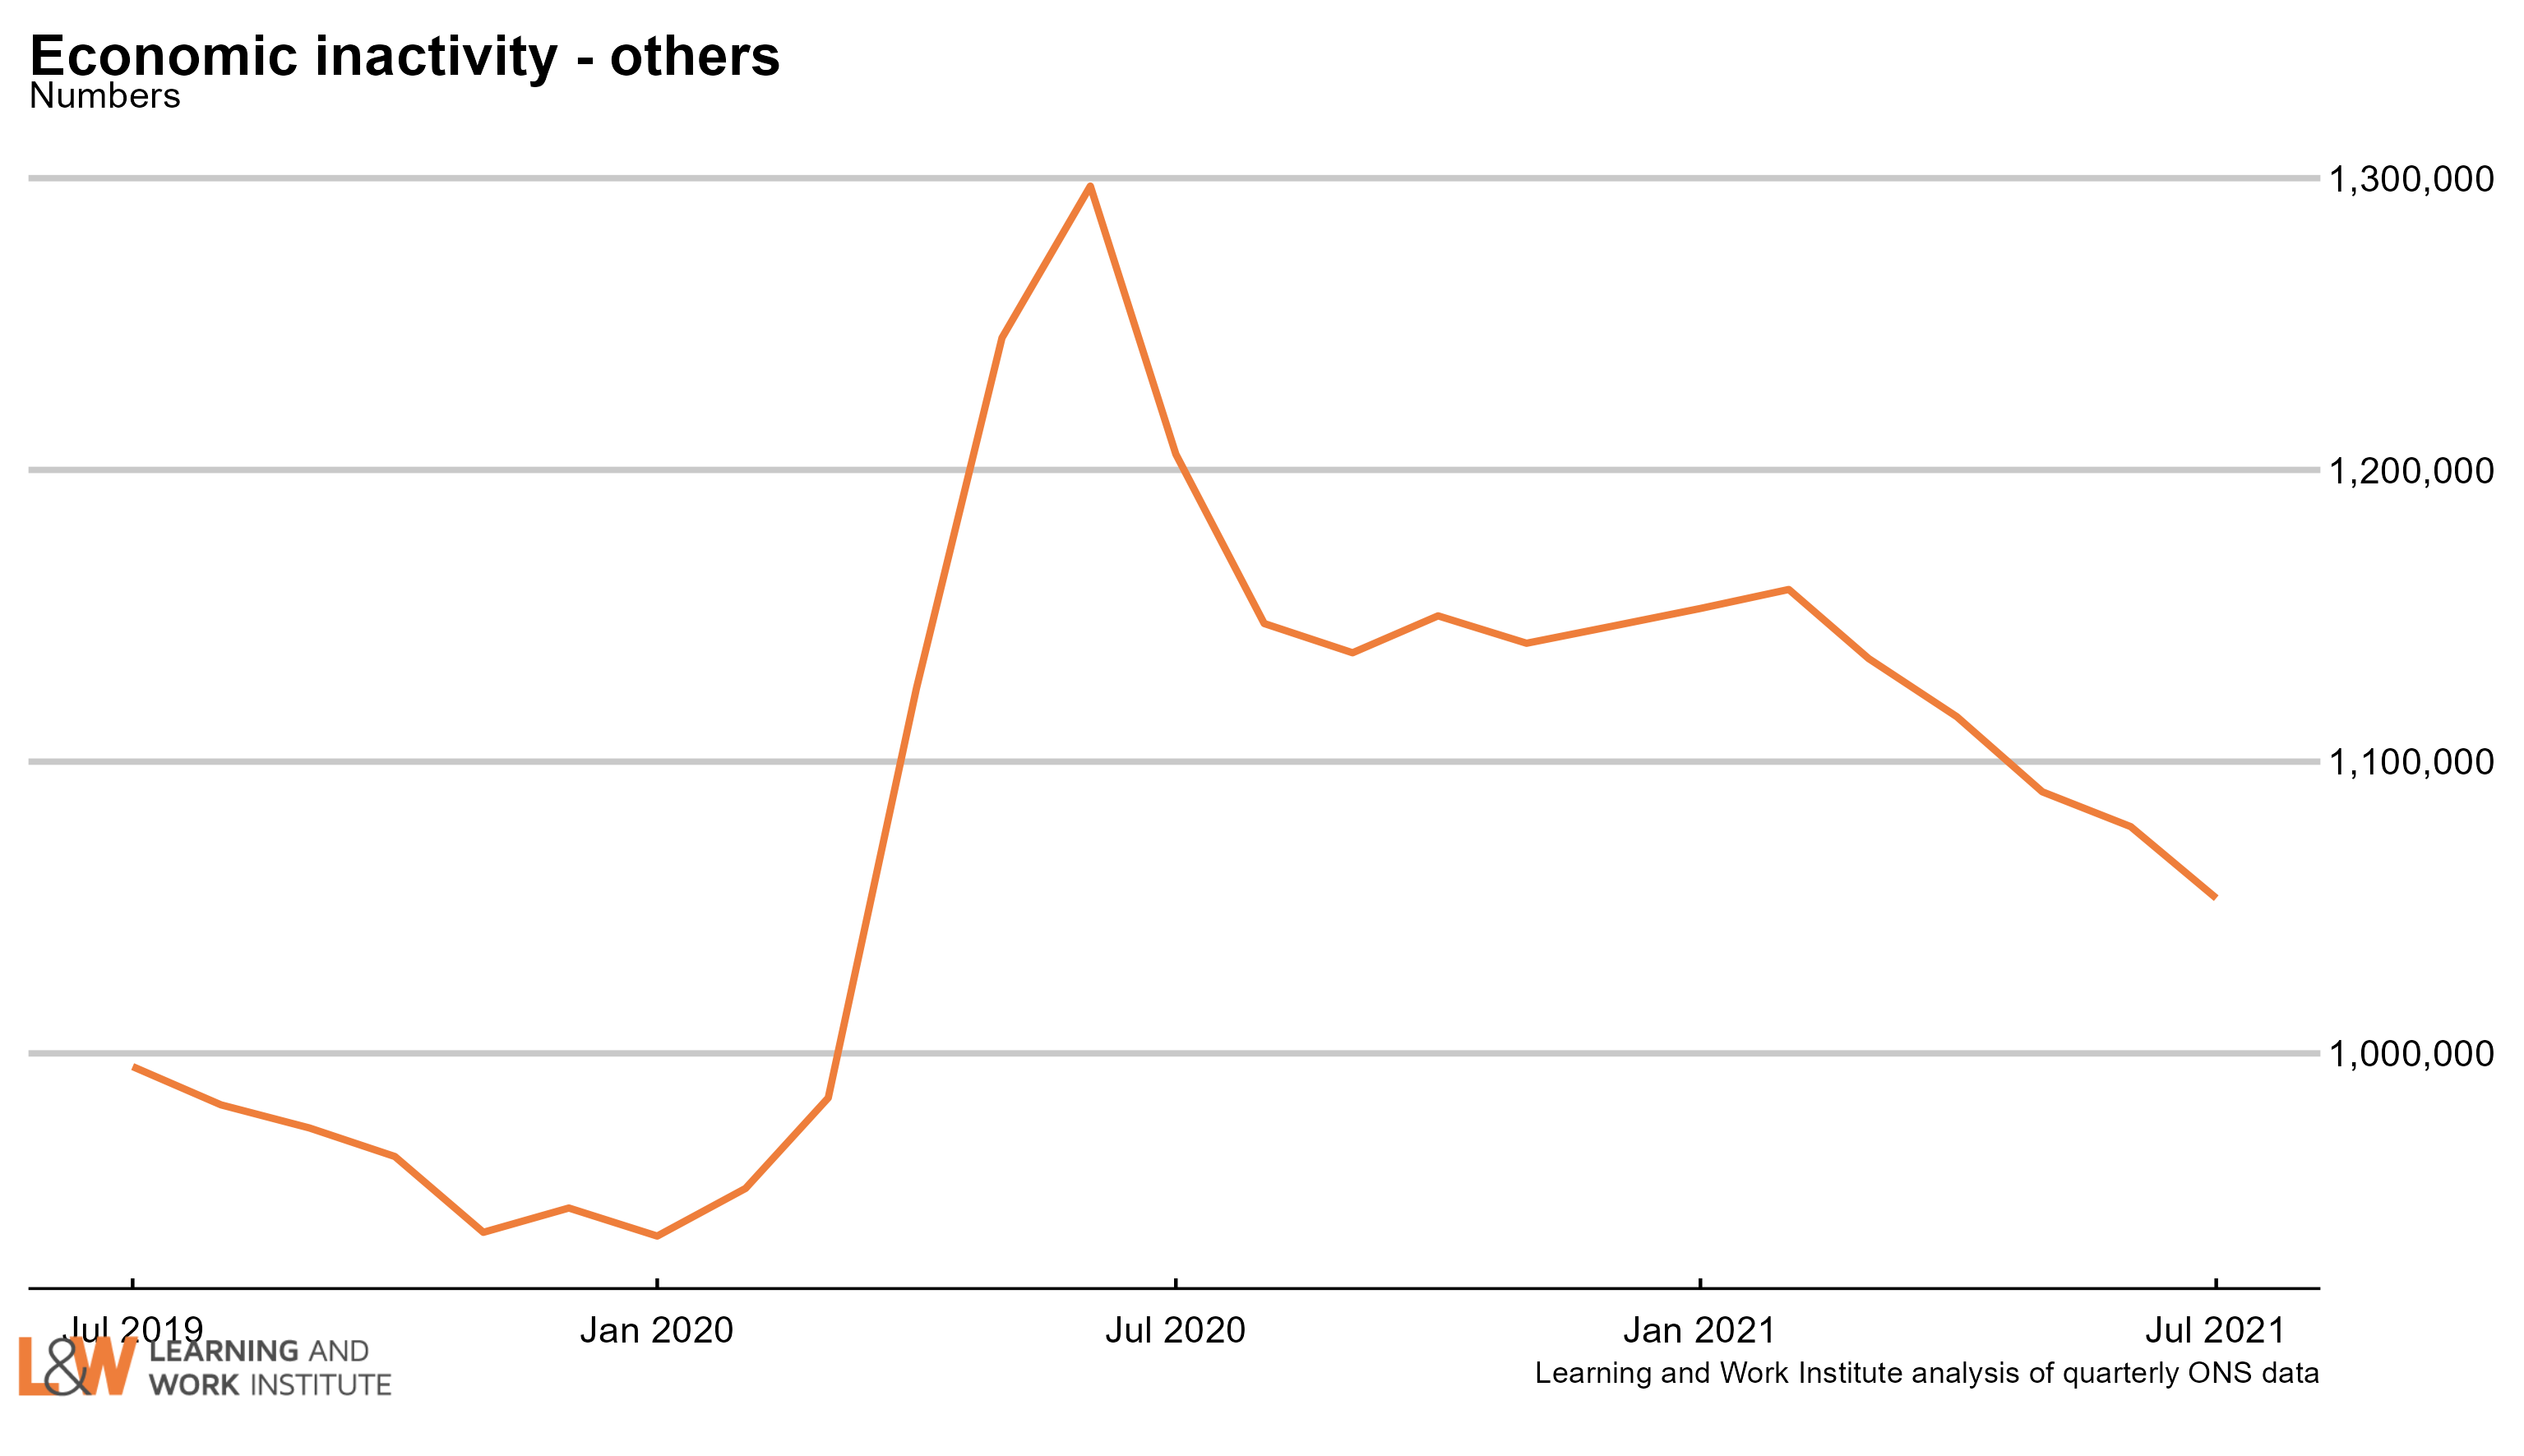
Chart 18: Employment rate two-year change in regions – May to July 2021

Compared with 2019, two regions showed a rise in the employment rate, the North East and London. The employment rate fell in 10 regions, led by the South East and the East Midlands. chart 19
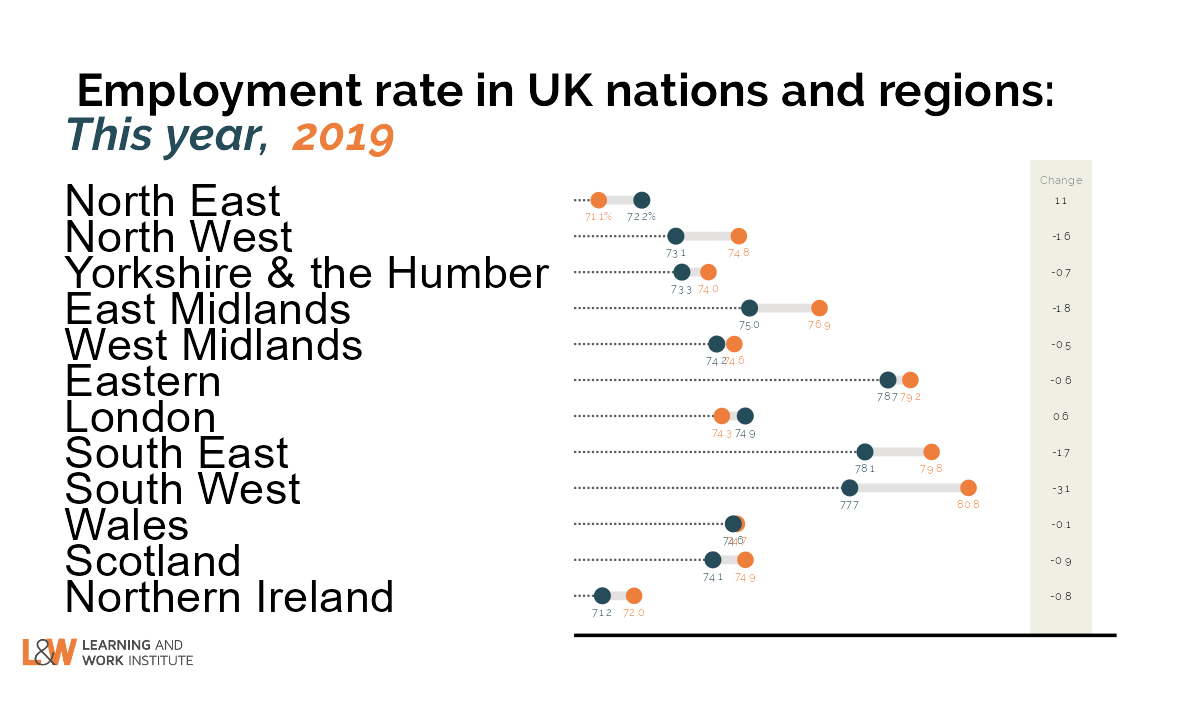
Chart 19: Unemployment rate two-year change in regions – May to July 2021

Compared with 2019, eleven regions showed a rise in the unemployment rate, led by London and the South East. The unemployment rate fell in one region, the East Midlands. chart 20
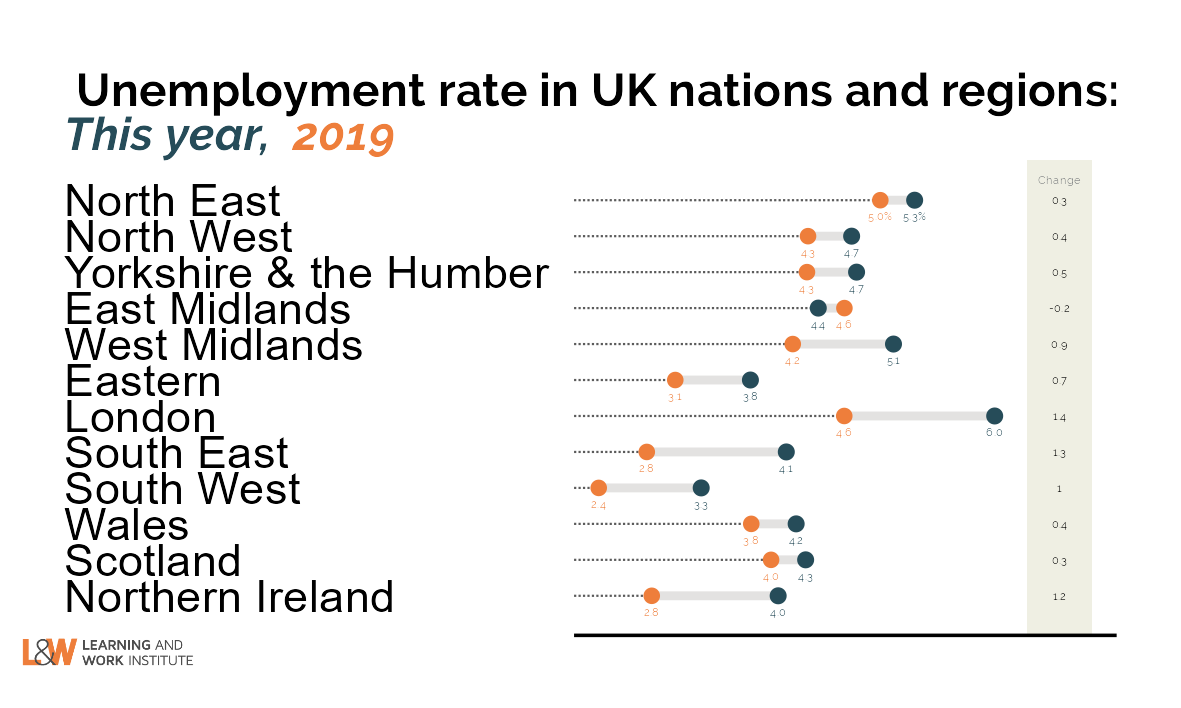
Chart 20: Inactivity rate two-year change in regions – May to July 2021

Compared with 2019, seven regions showed a rise in the inactivity rate, led by the South West and the East Midlands. The inactivity rate fell in 5 regions, led by London and the North East. chart 21 -->

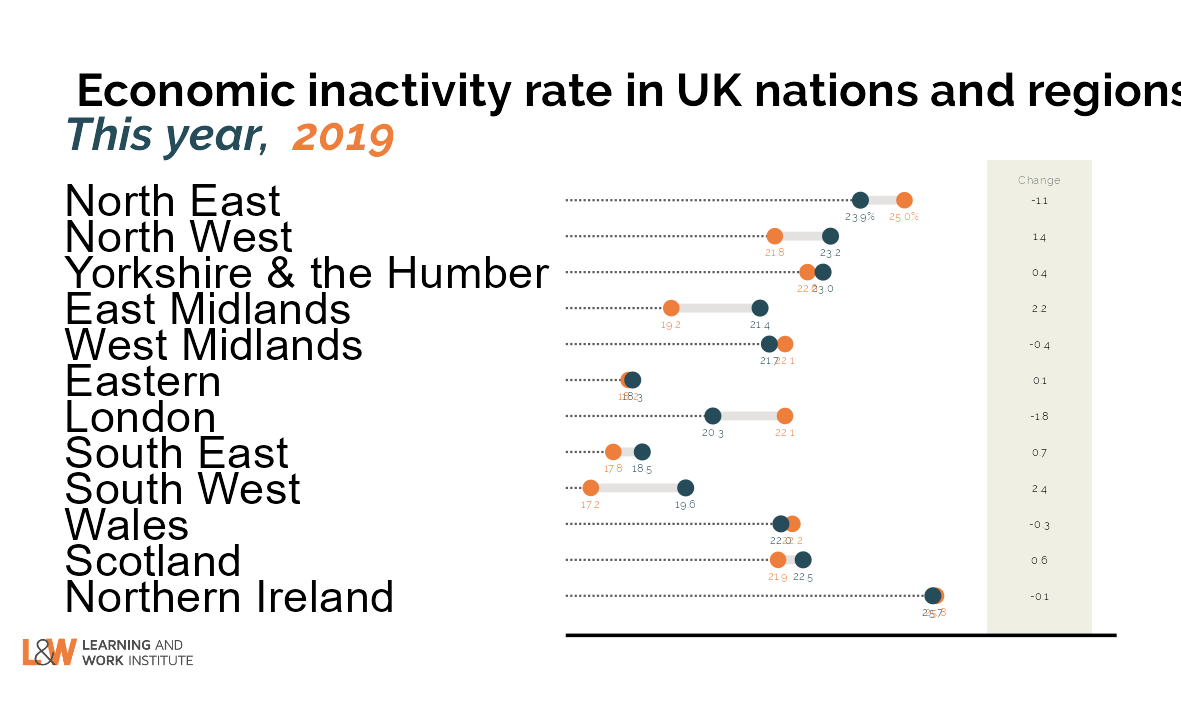
This newsletter is produced by Learning and Work Institute and keeps readers up to date on a wide range of learning and work issues.

If you have any questions, contact Paul Bivand
© 2020 Learning and Work Institute. All rights reserved.
Click here to unsubscribe | Click here to see a web copy of this email


Email Marketing by ActiveCampaign