 |
|
| Making learning and work count Labour market LIVE from Learning and Work Institute 16 May 2023
Stephen Evans, Chief Executive at the Learning and Work Institute, said: |
|
| Chart 1: UK unemployment (ILO) The latest unemployment rate increased by 0.1 percentage points to 3.9%. 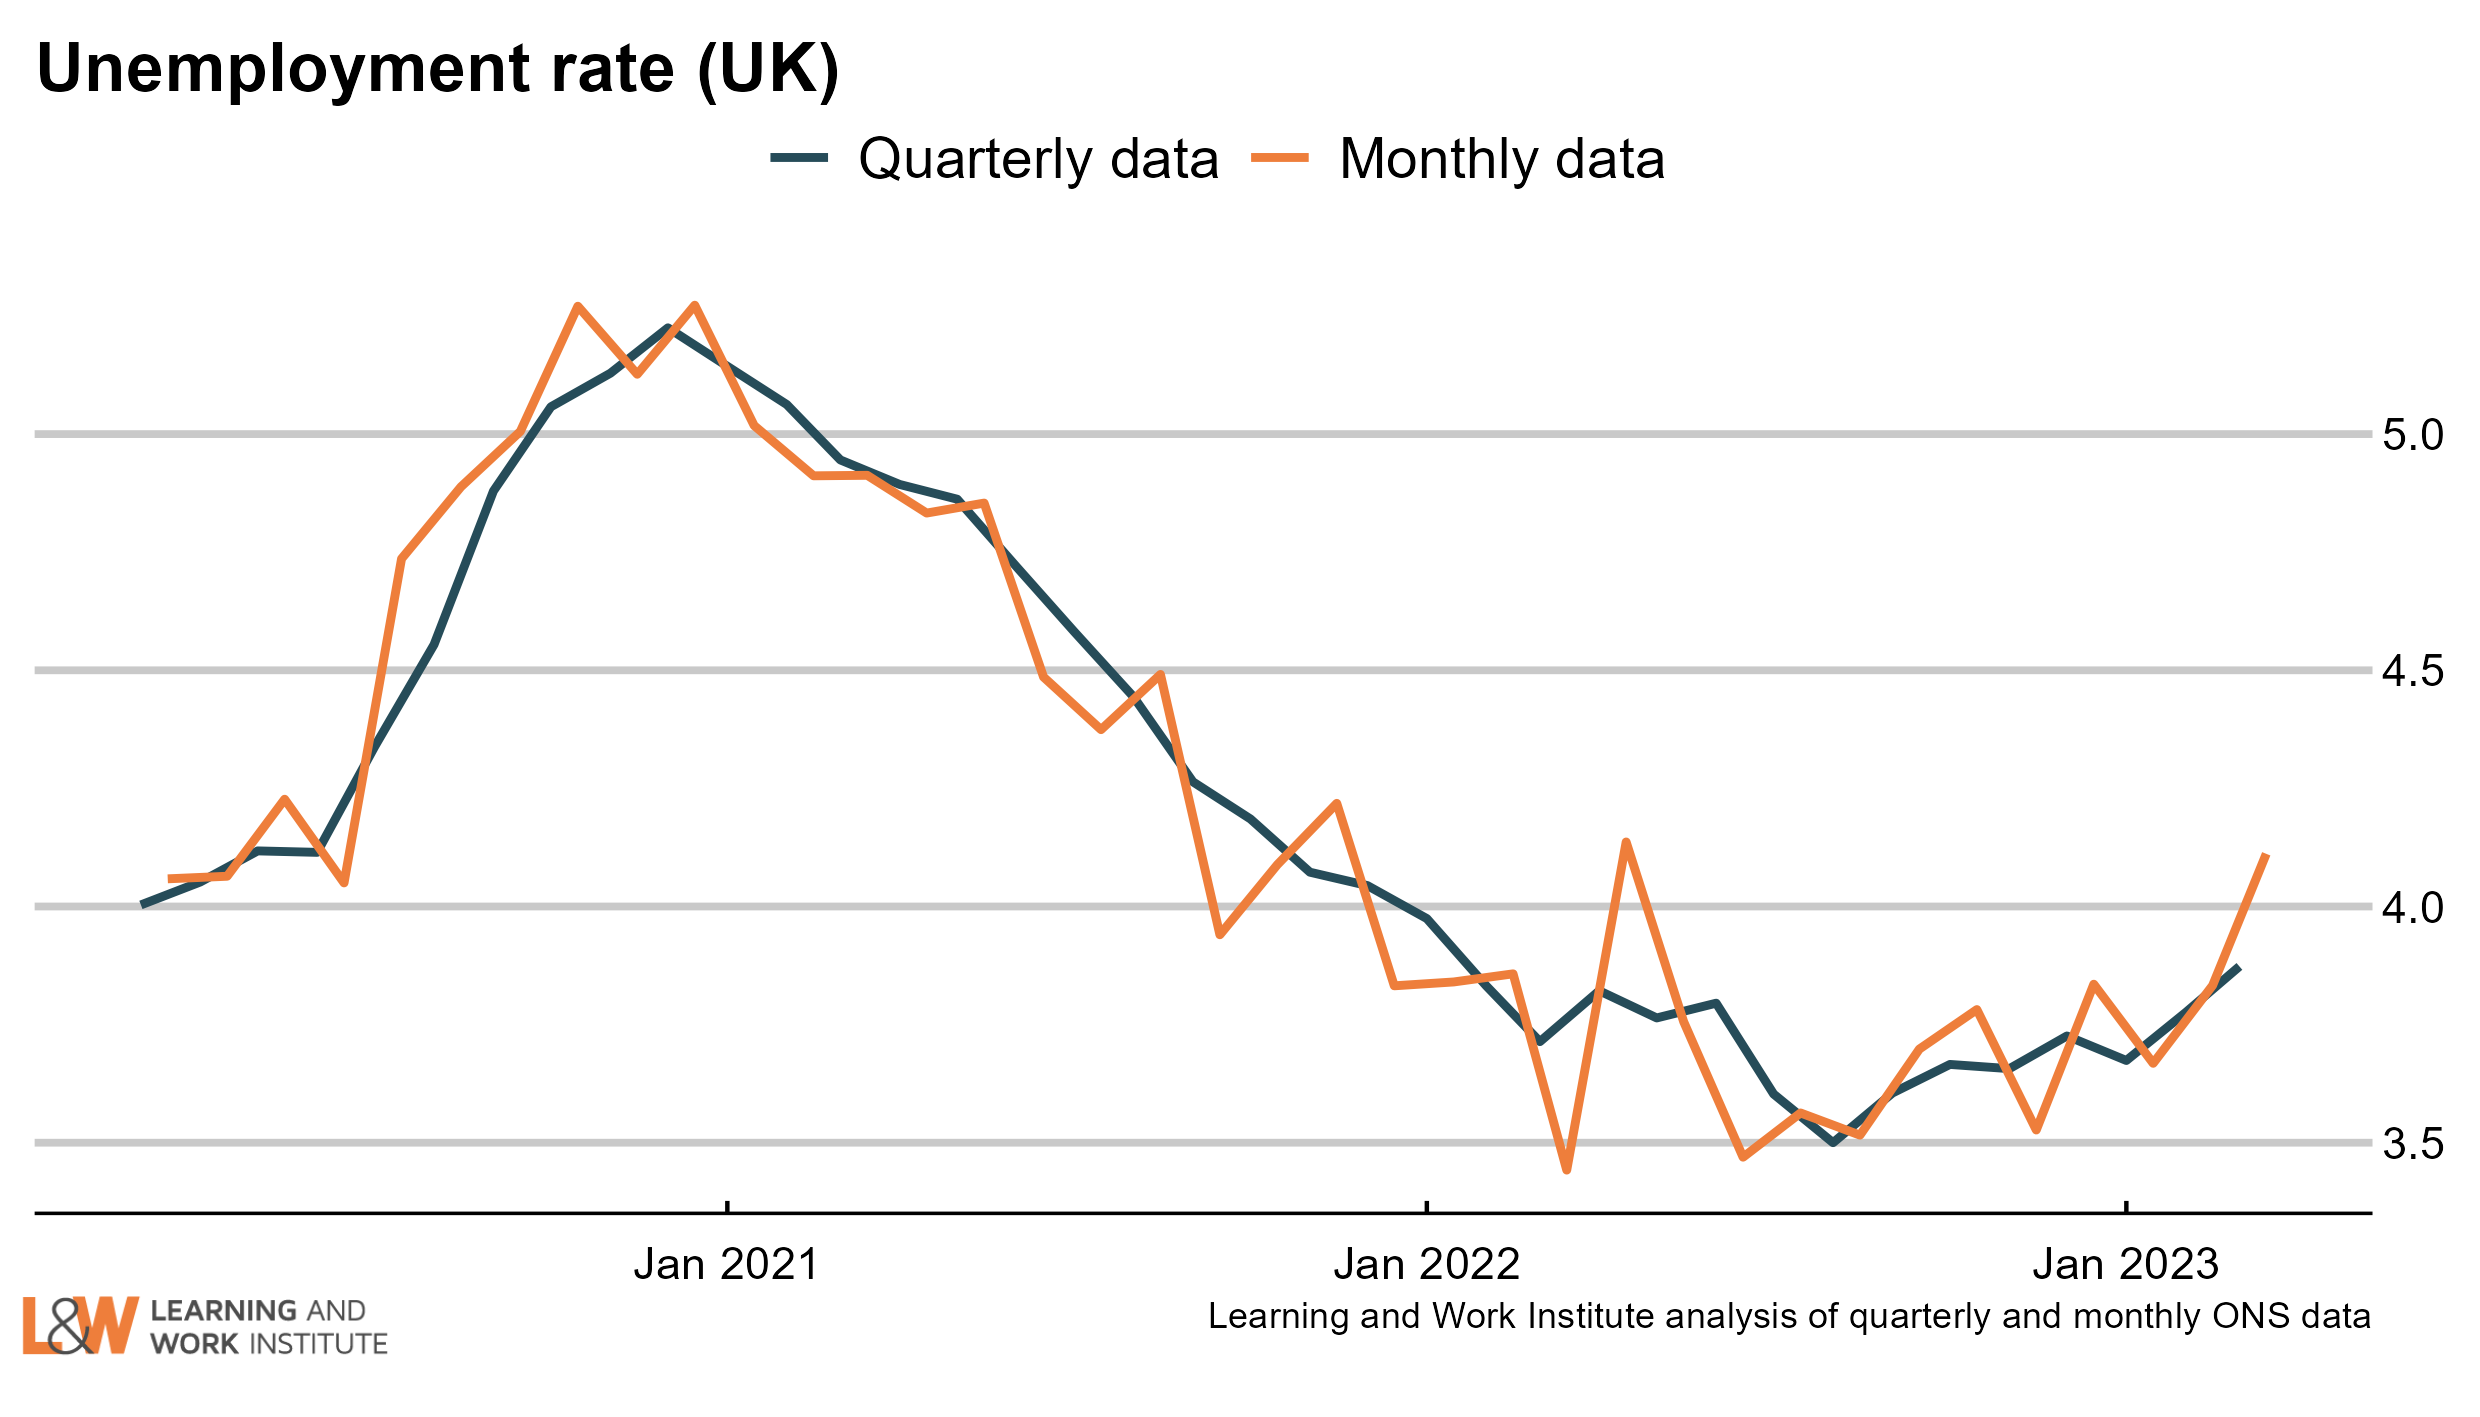 |
|
| Chart 2: The claimant count and UK unemployment compared The number of unemployed people who are claiming unemployment-related benefits is now 243,000 higher than the number of unemployed in the official measure. 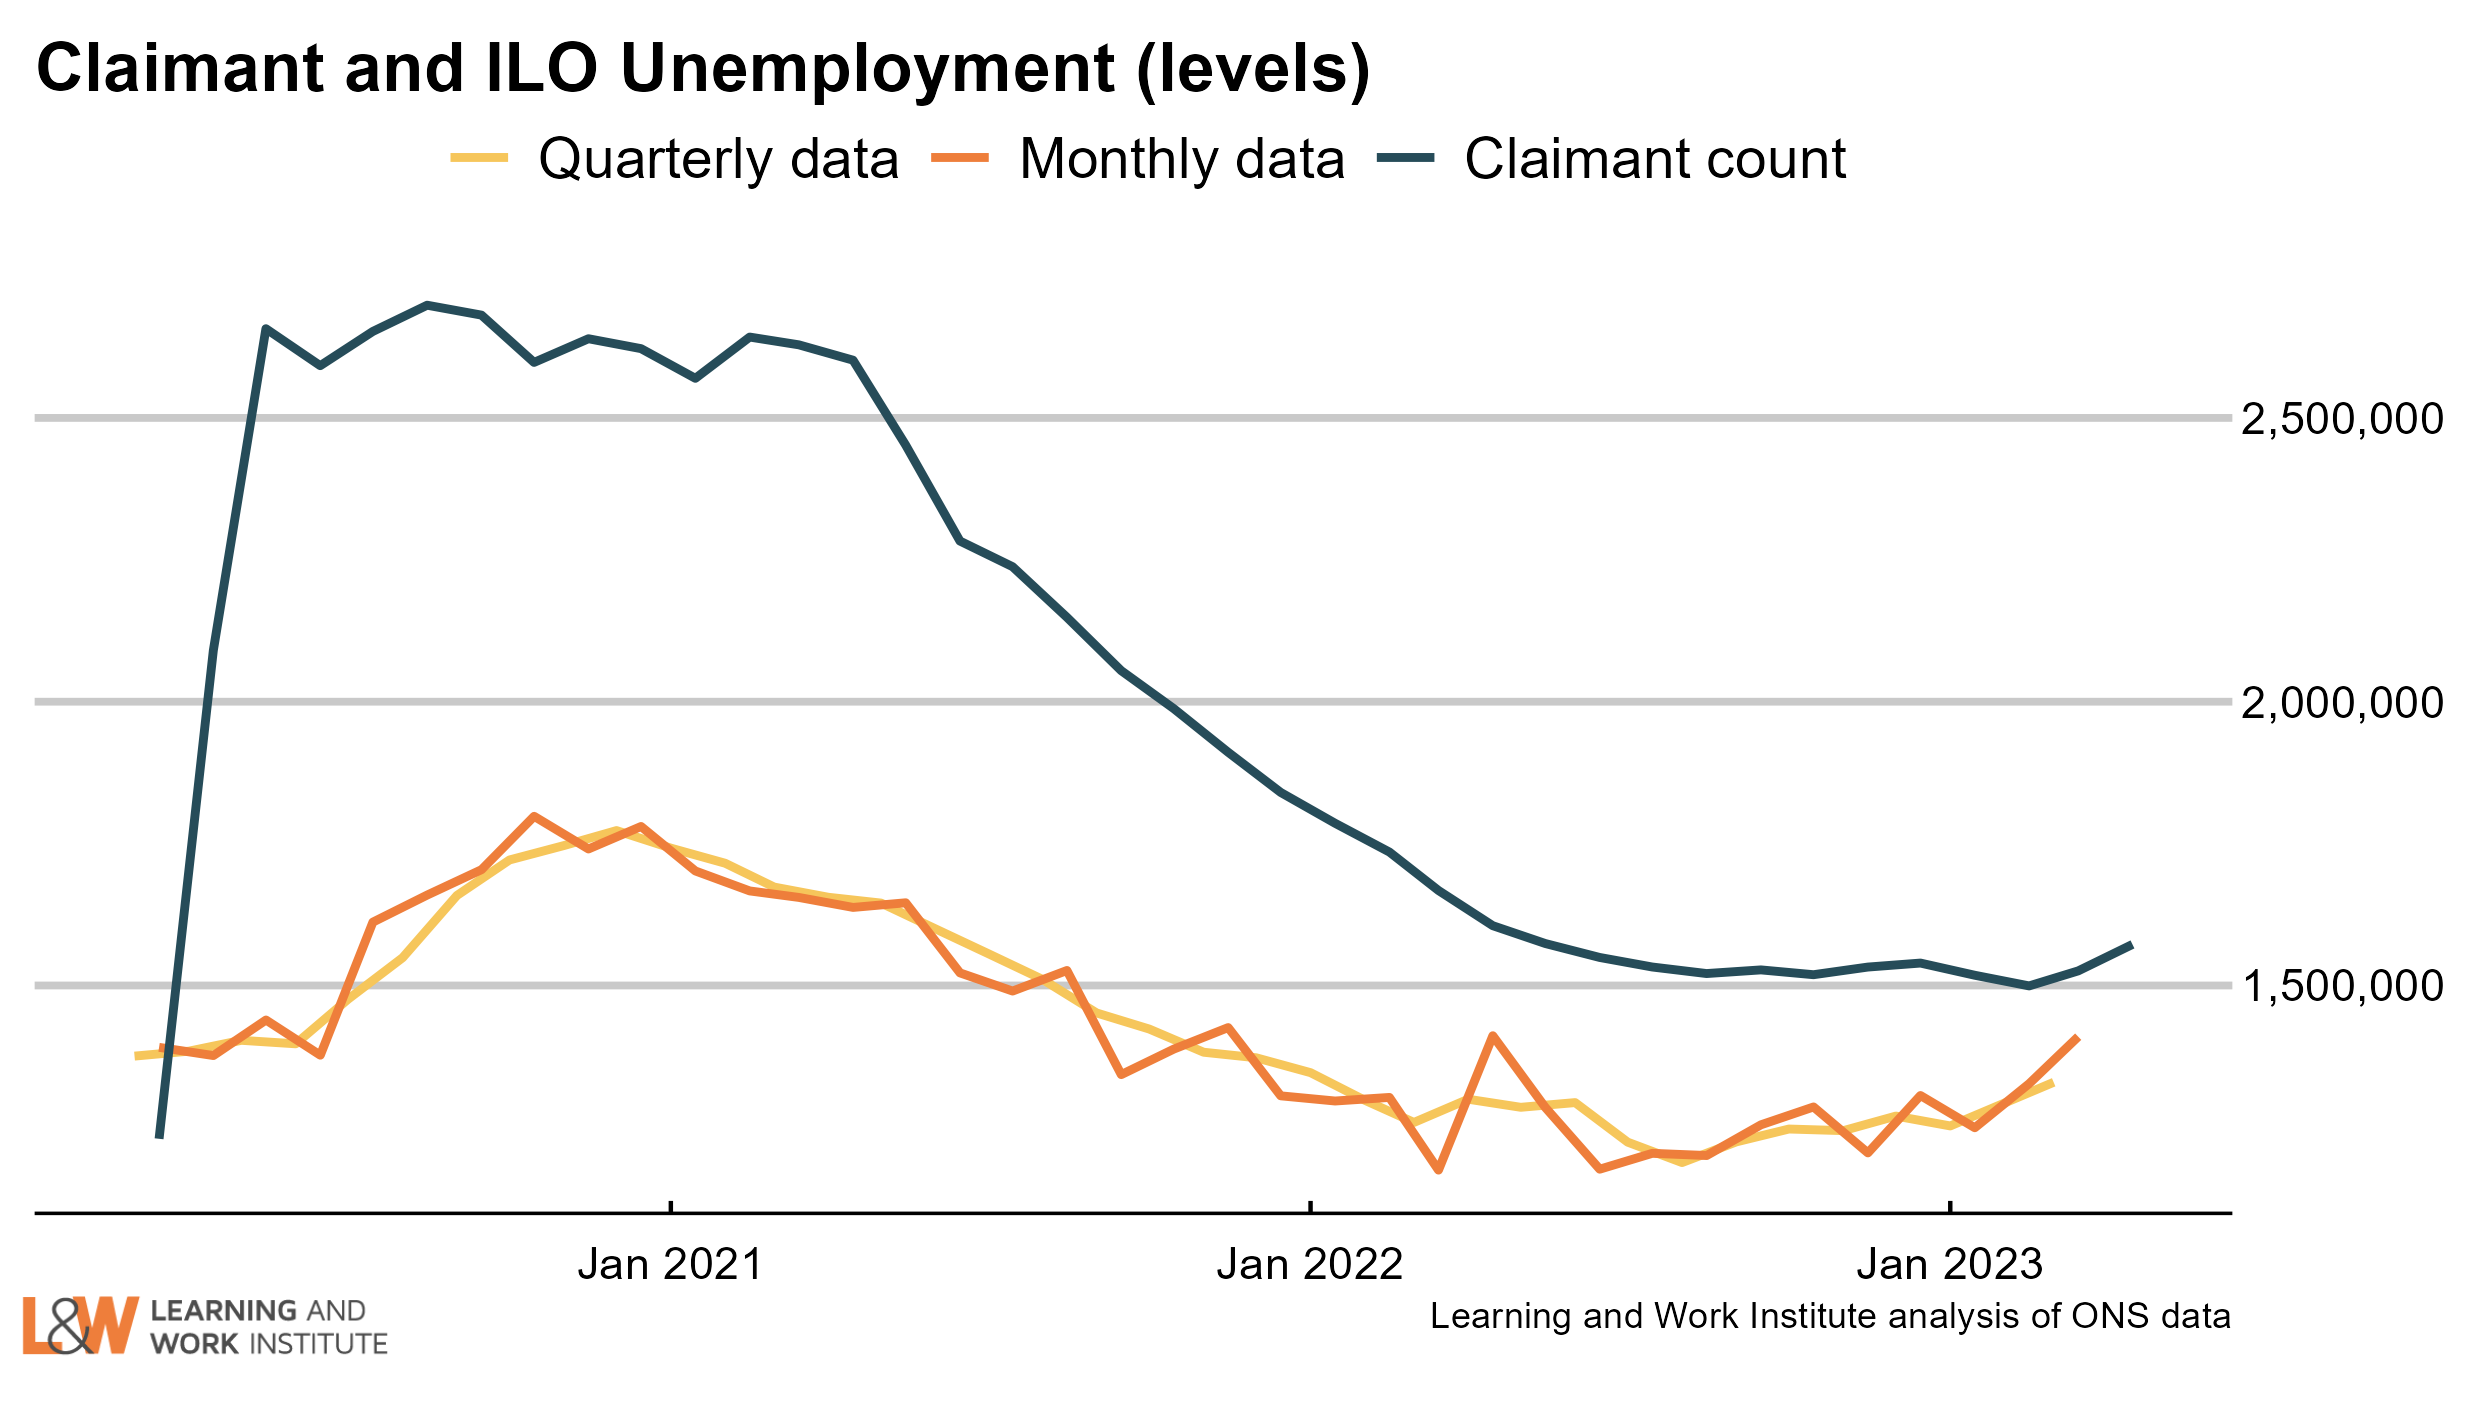 |
|
| Chart 3: Youth unemployment The number of unemployed young people (aged 16-24) has risen by 23,000 since last month’s figures, to 482,000. Meanwhile, the number of young Universal Credit or Jobseeker’s Allowance claimants (aged 18-24) last month has risen by 5,700, to 270,700. 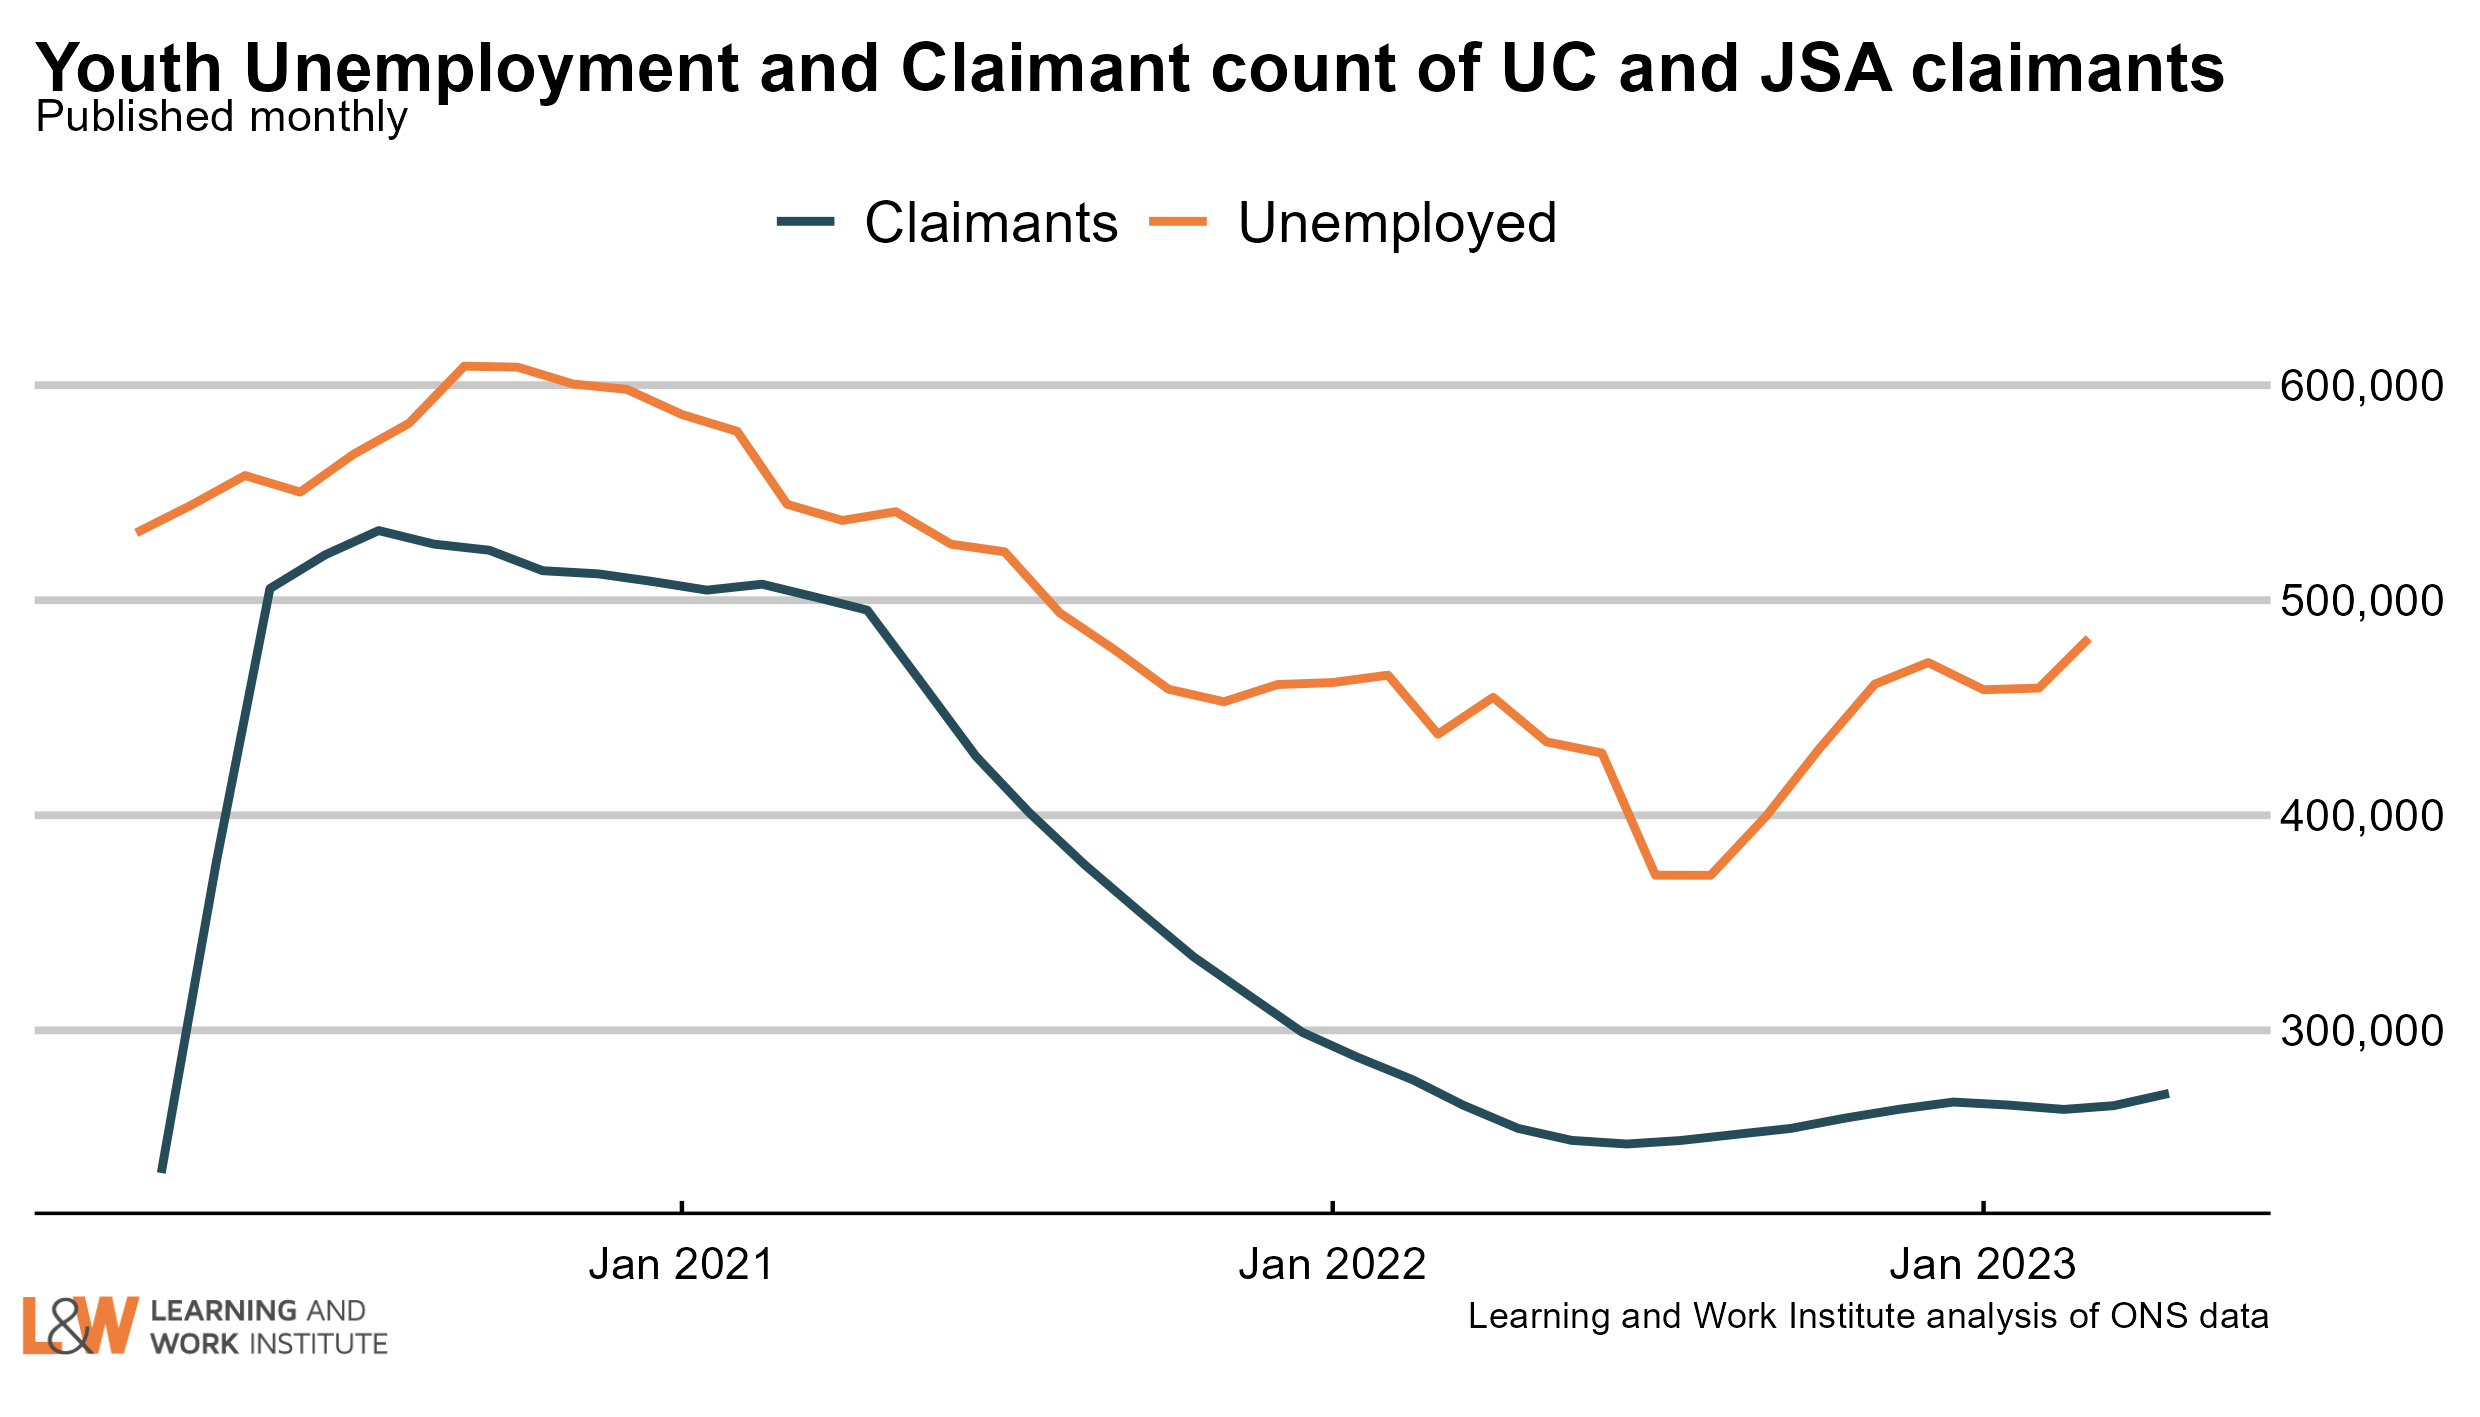 |
|
| Chart 4: Young people not in employment, full-time education or training The number of young people not in employment, full-time education or training (983,000) fell by 18,000 in the last quarter. 66% of young people not in full-time education or employment are economically inactive, rather than unemployed. To be counted as unemployed, people need to be both actively seeking work and available to start. People out of work who do not meet these criteria are counted as economically inactive. 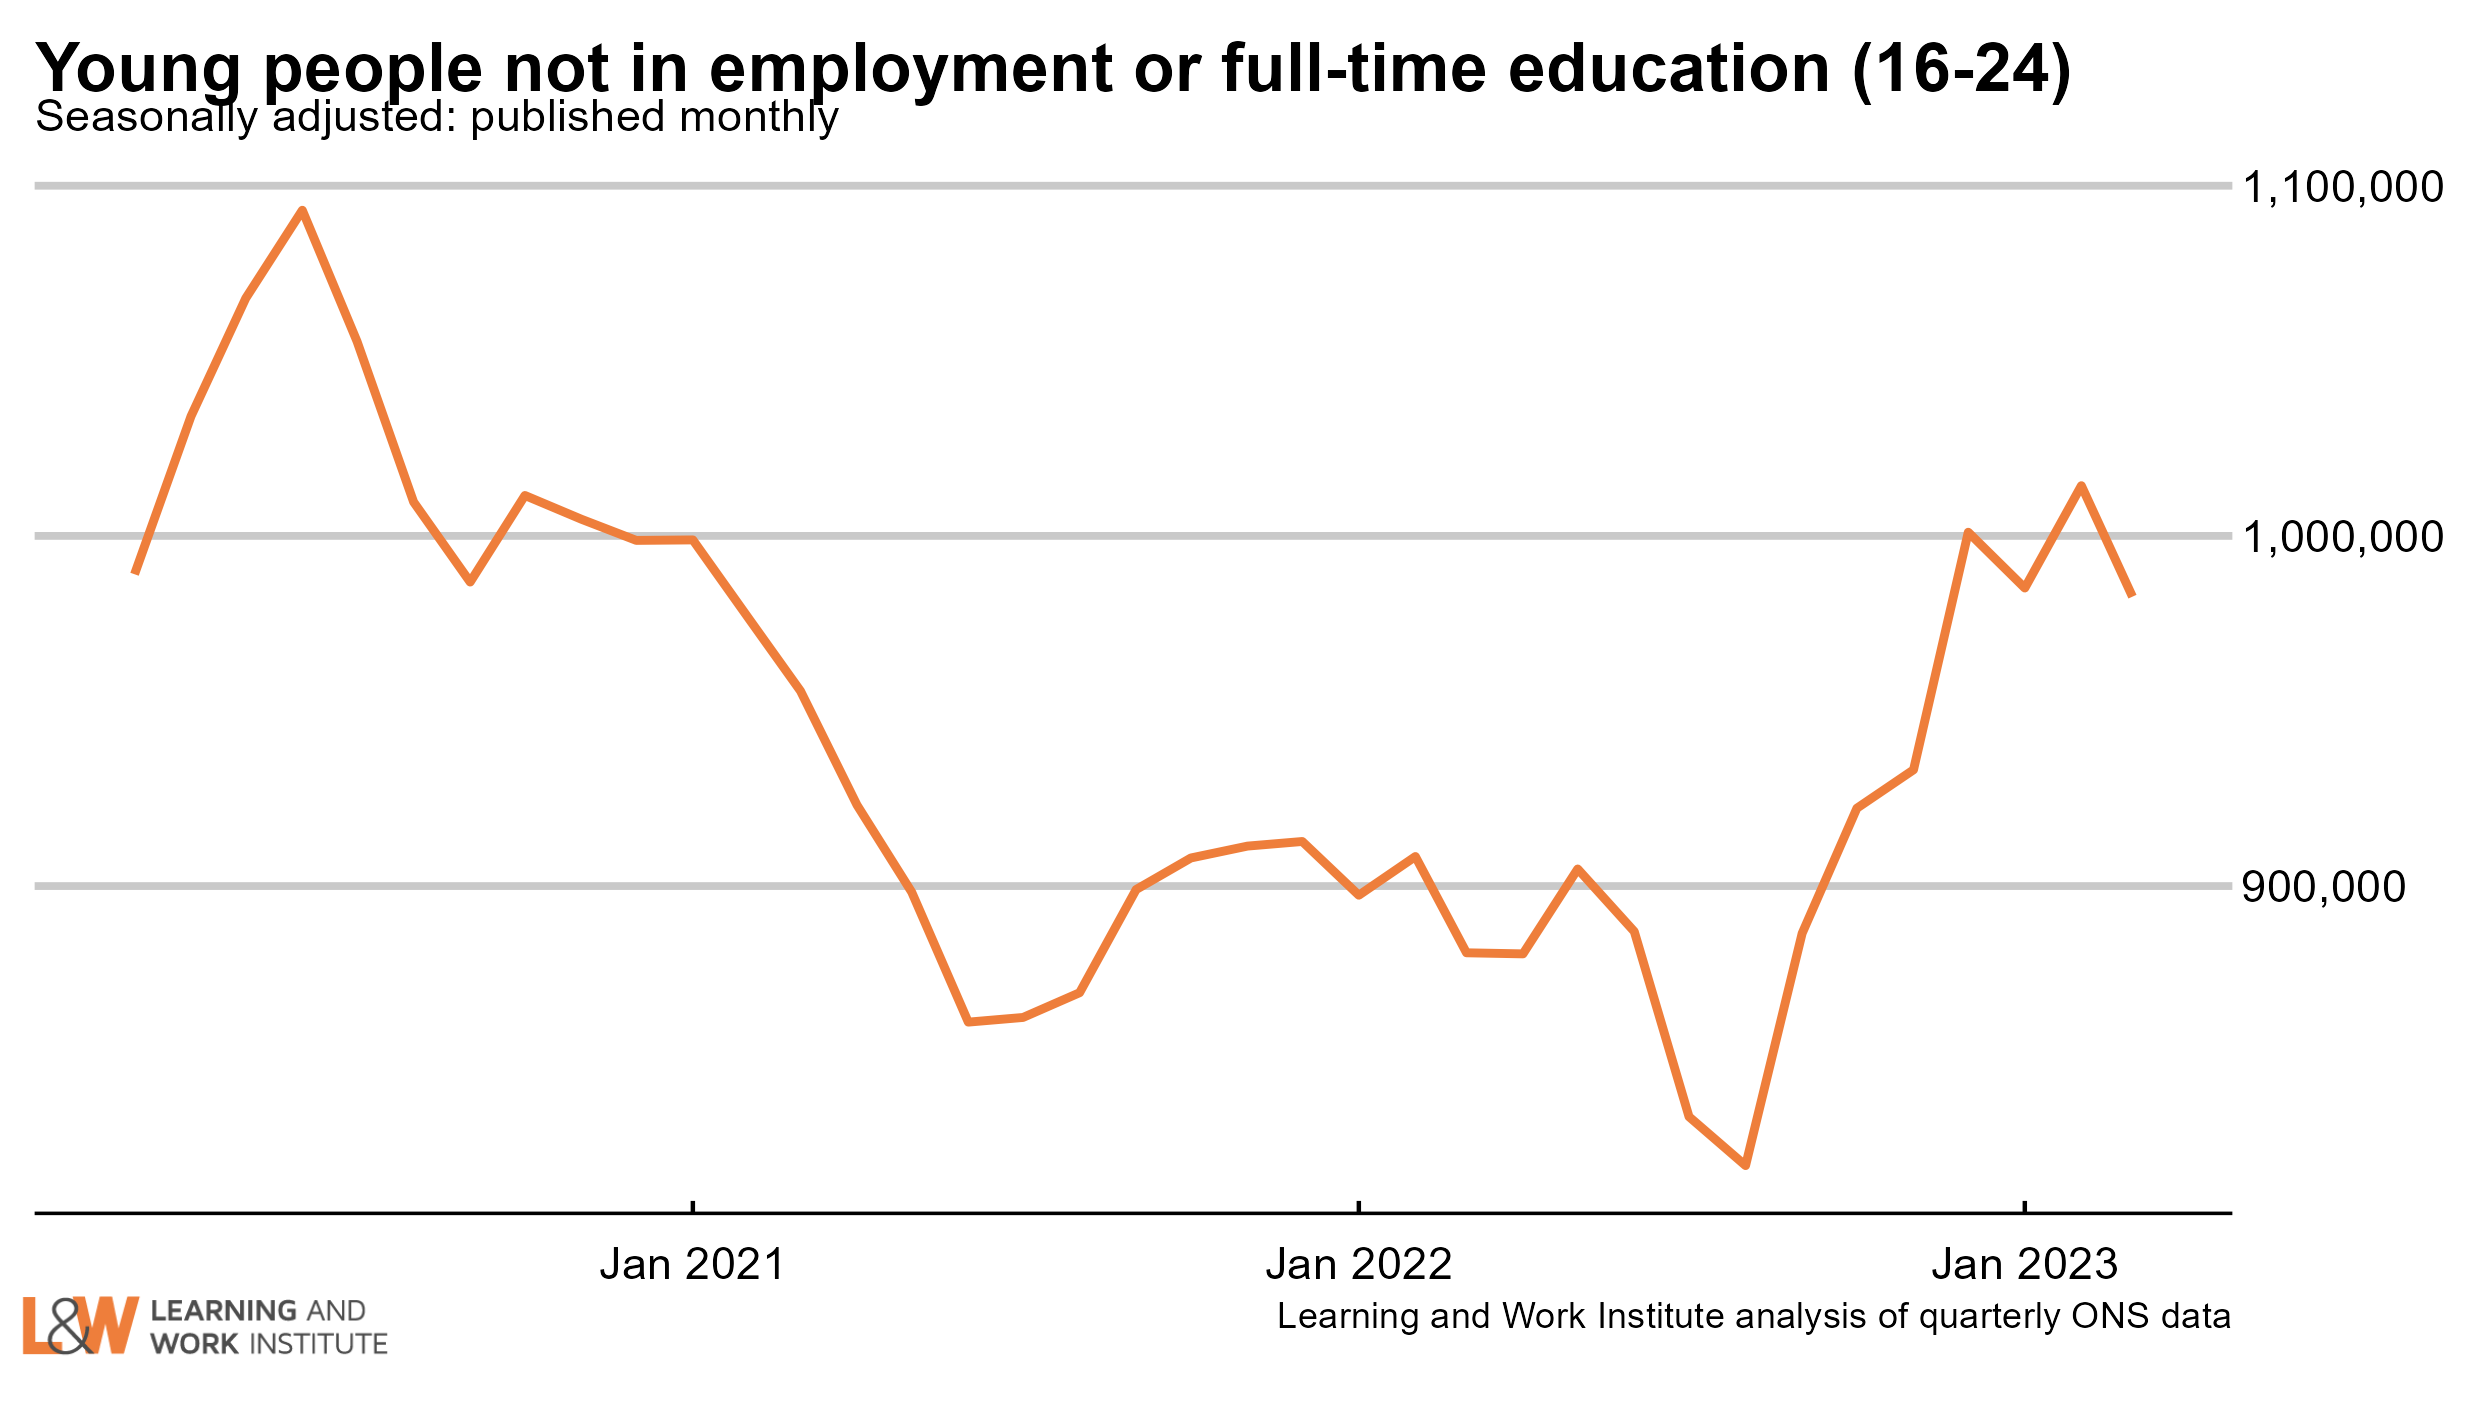 |
|
| Chart 5: Youth long-term unemployment (six months and over, 16-24) Total youth long-term unemployment (which can include students) is unknown this month because of sample size issues for 16-17 year olds unemployed for over 12 months, but it is at least 120,000. Long-term unemployment for young people is normally counted as being unemployed for six months or more. 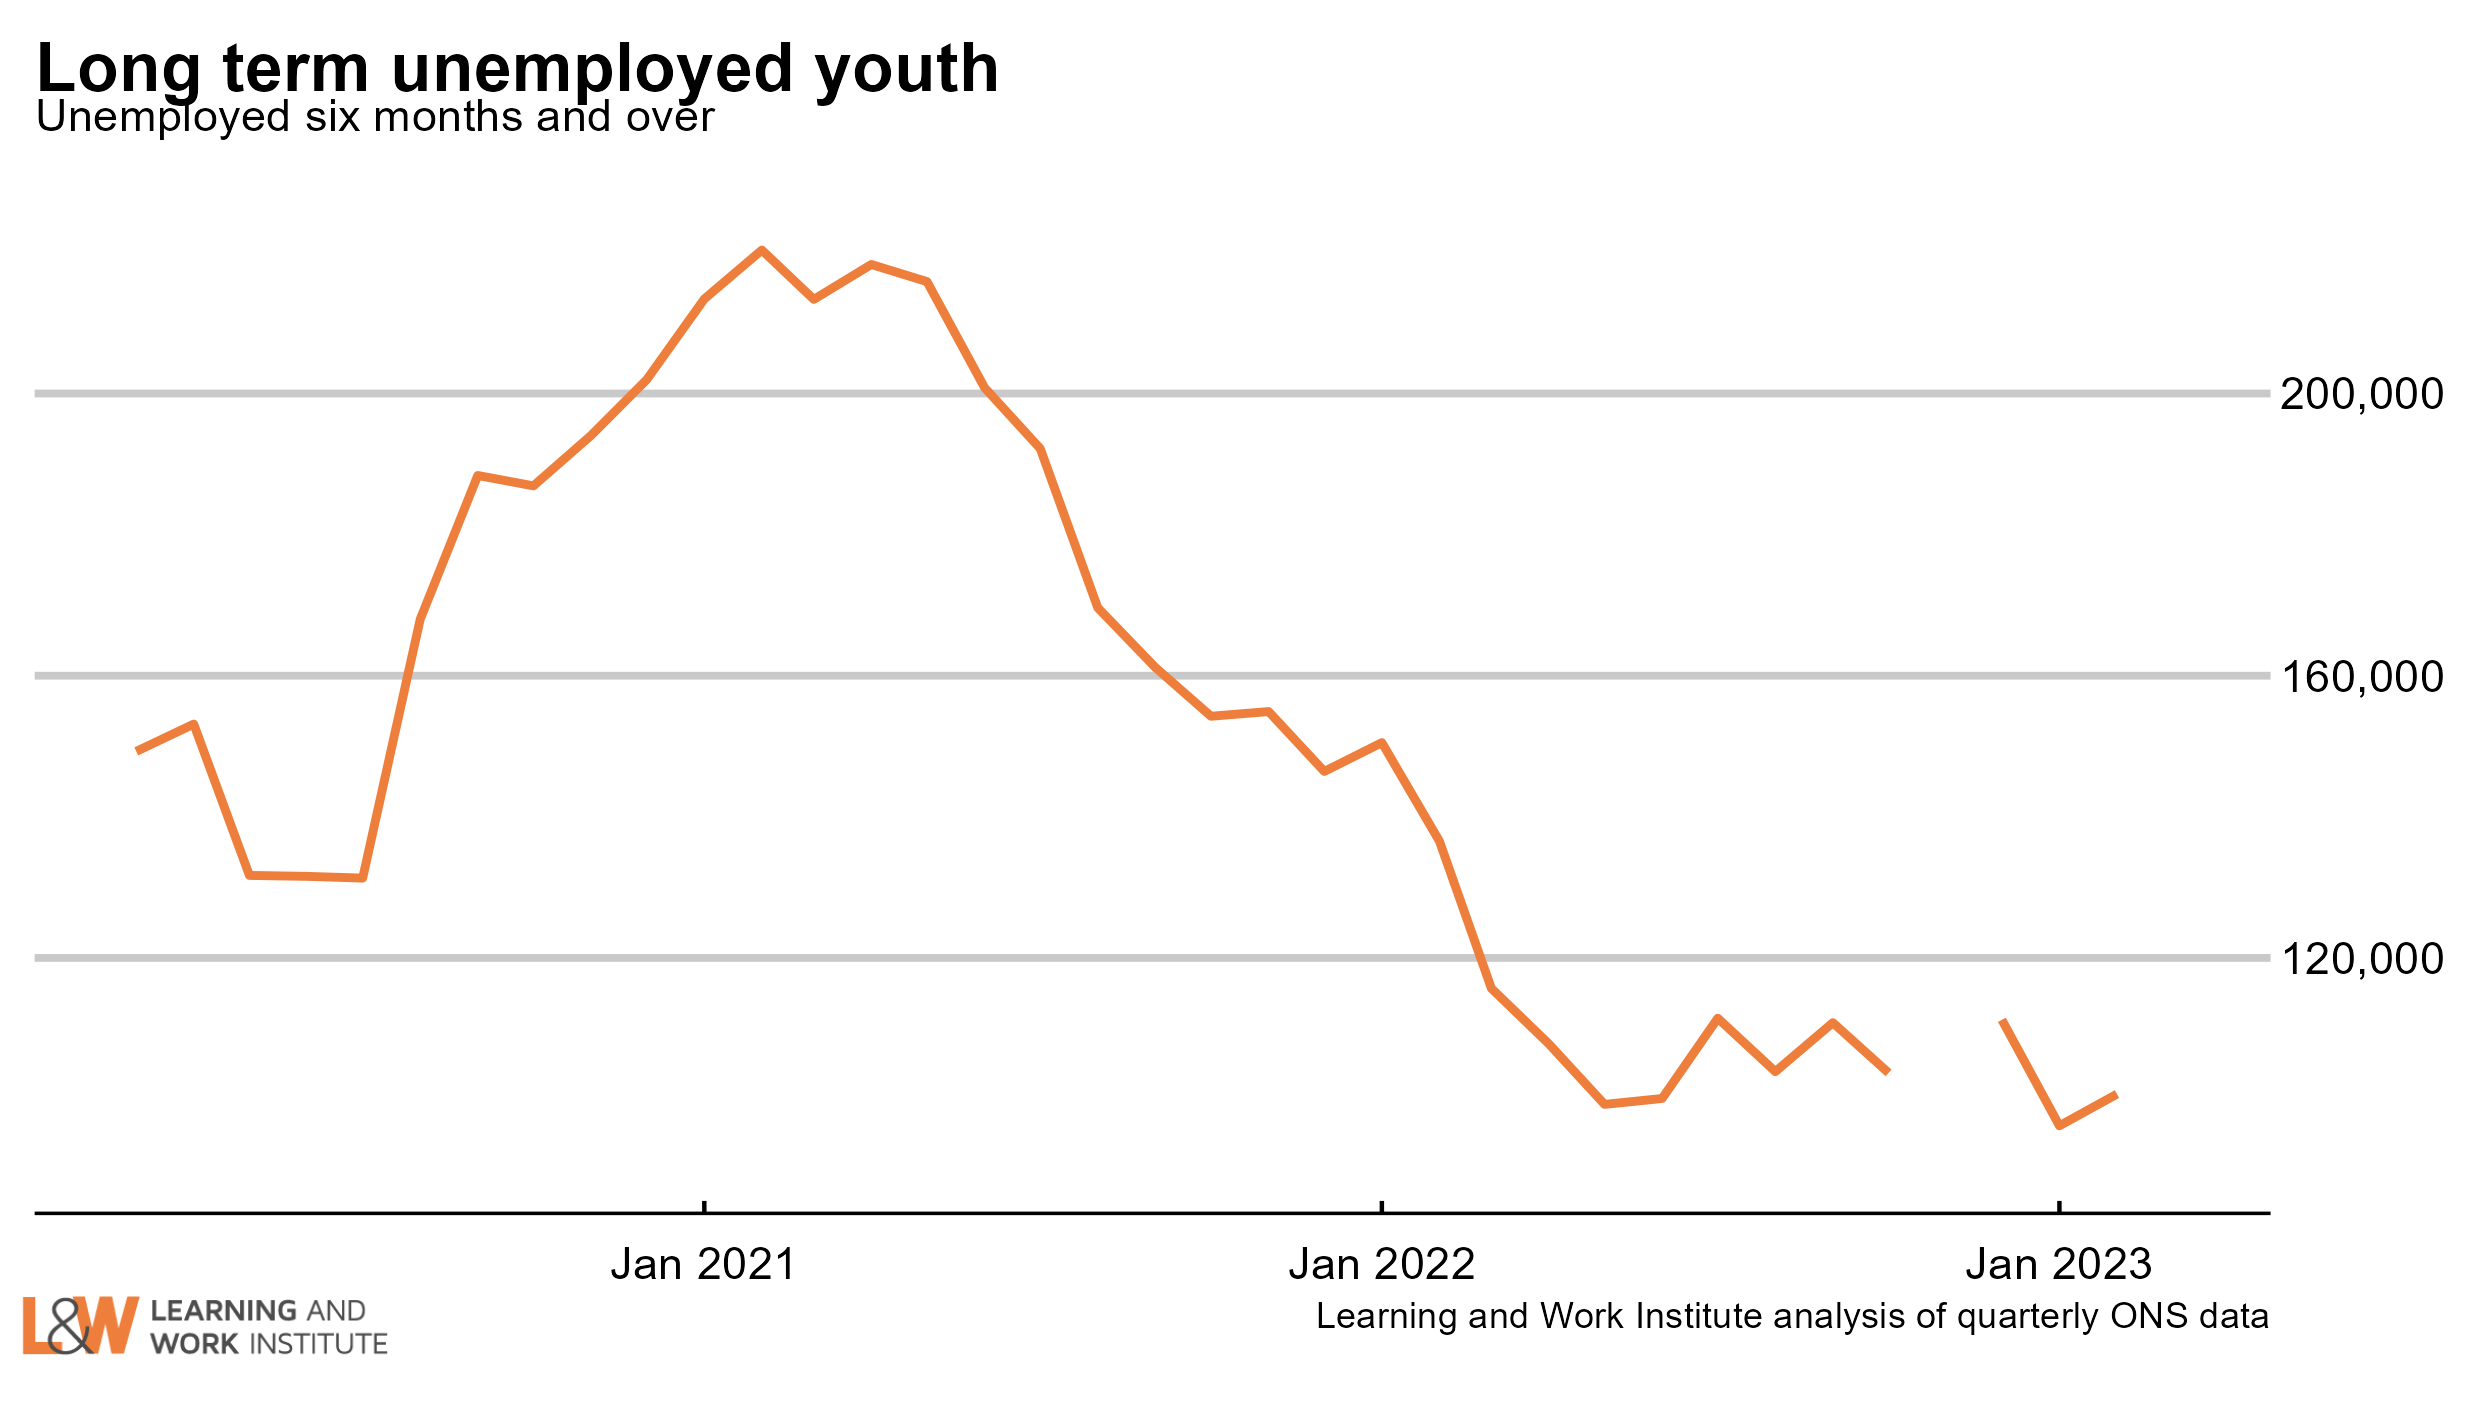 |
|
| Chart 6: Adult long-term unemployment (12 months and over, 25+) Adult long-term unemployment on the survey measure is now 250,000. The number people aged 25 and over out of work for 12 months has risen by 12,000 compared with before the pandemic (Dec 19 - Feb 20). 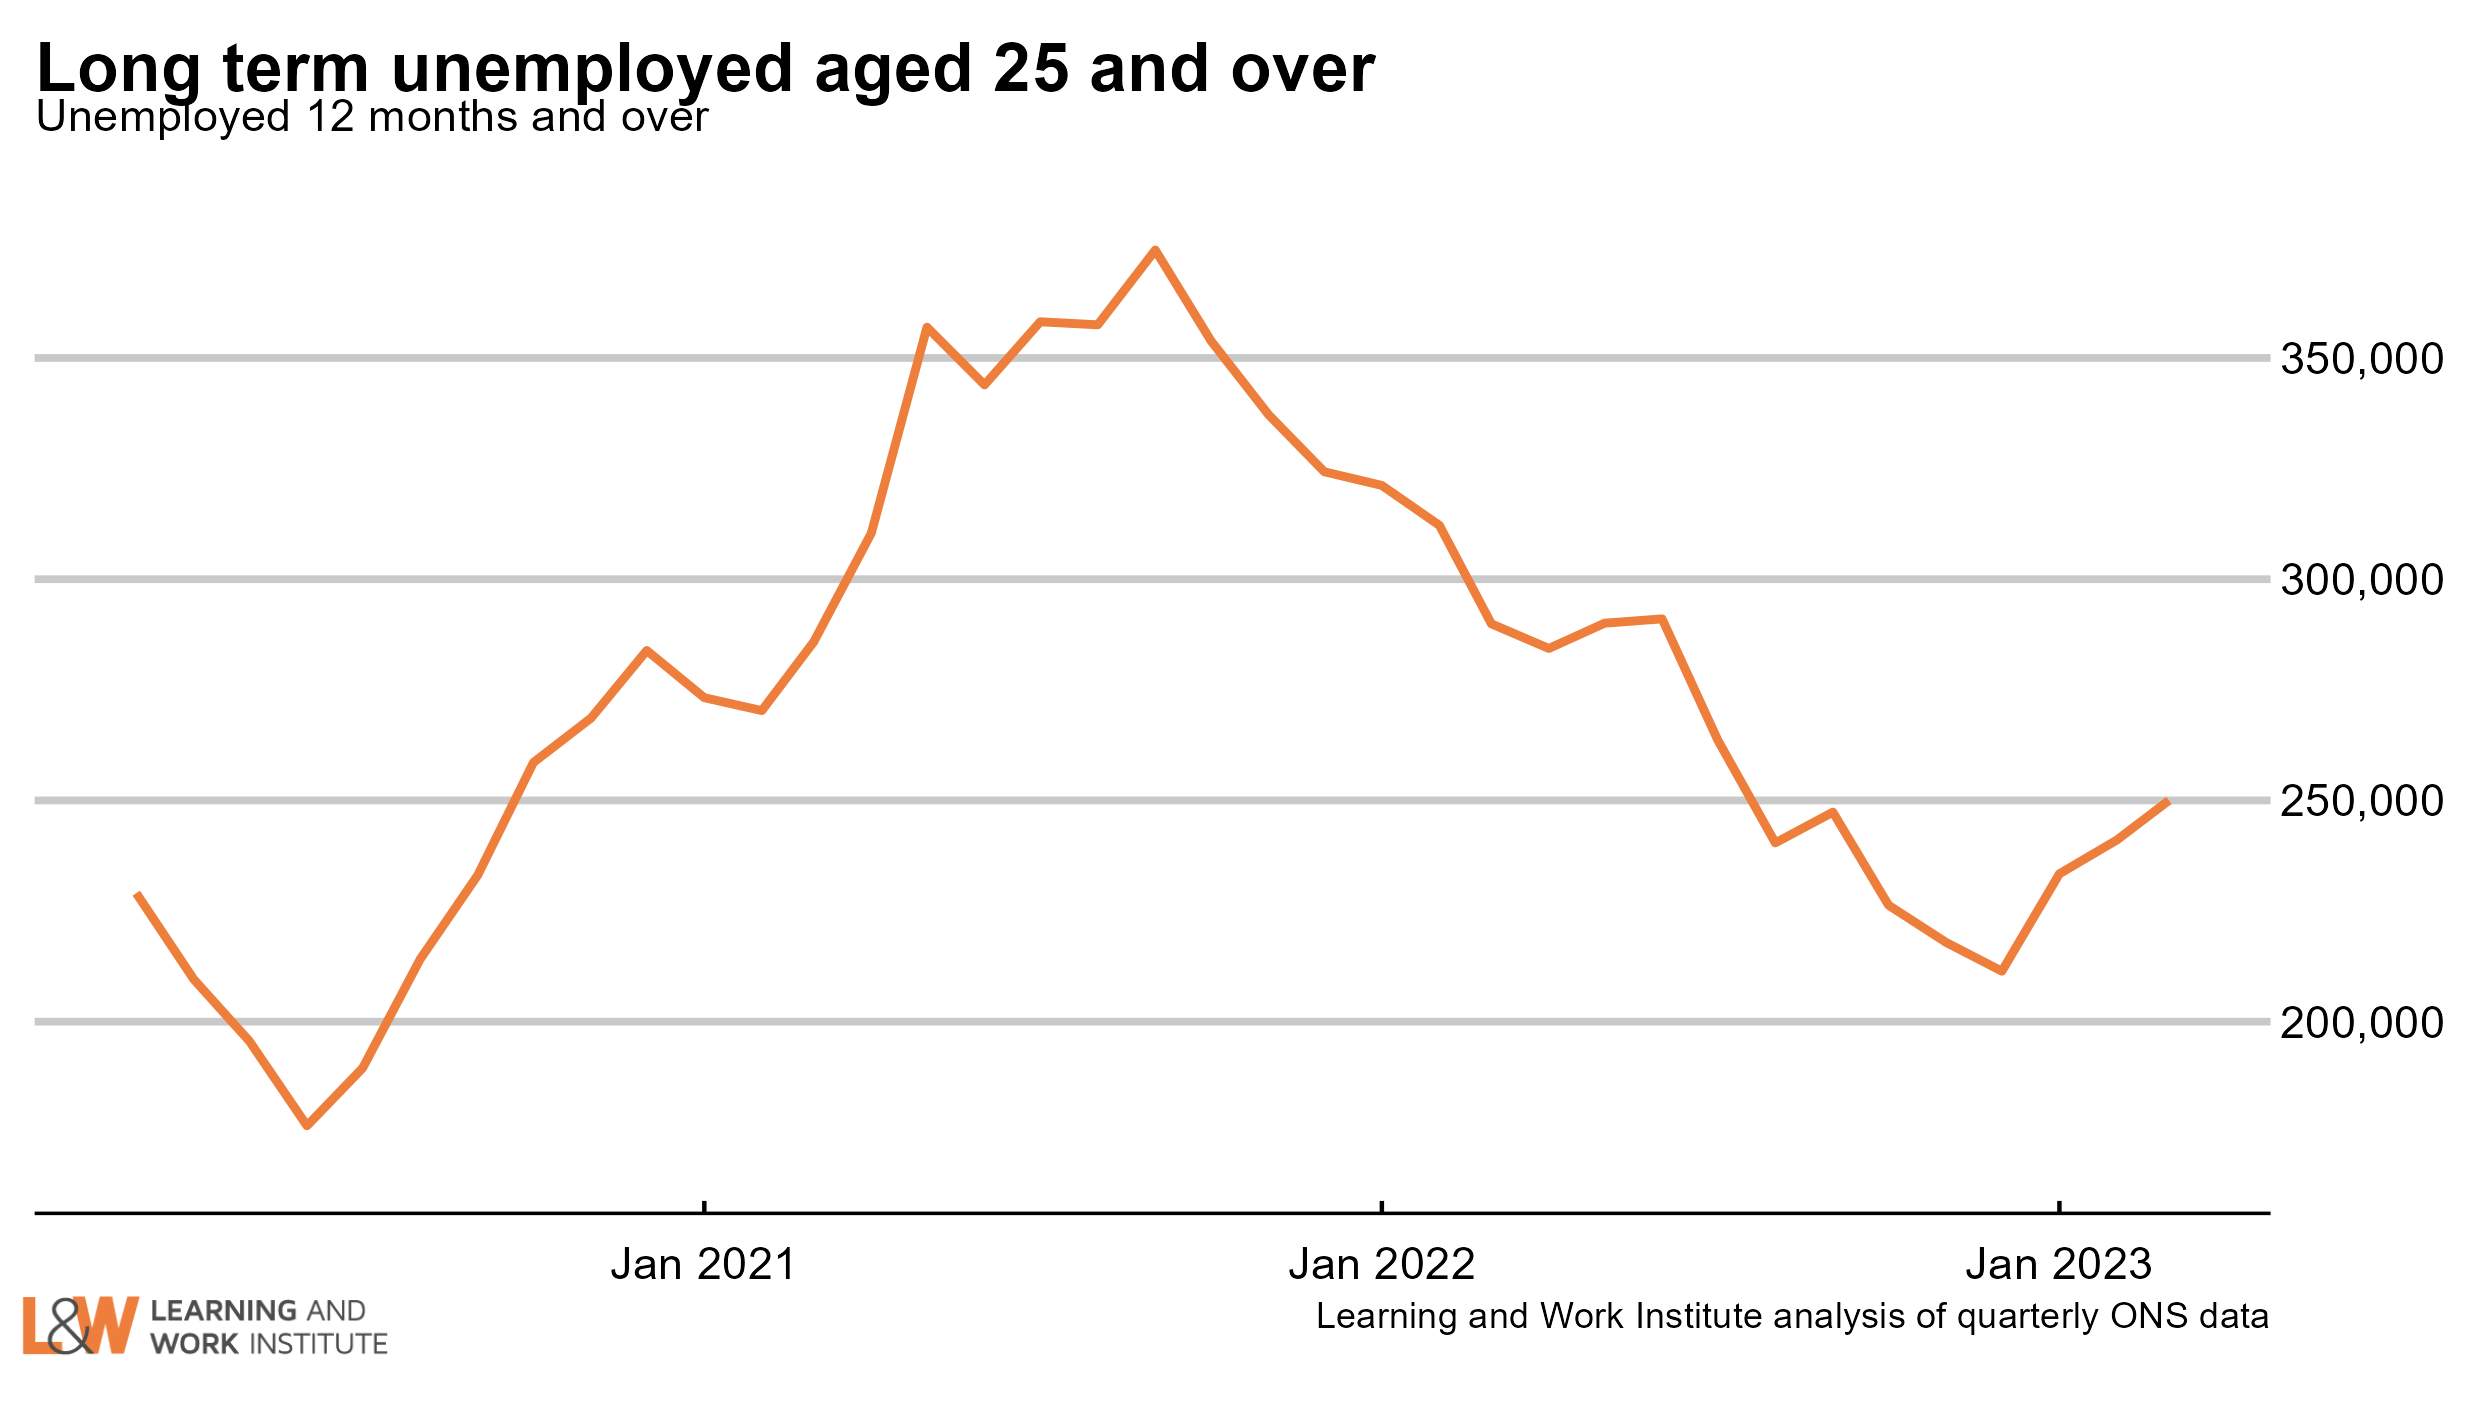 |
|
| Chart 7: Unemployment rates by age The 18 to 24 year old unemployment rate (including students) is 10.5% of the economically active. The rate for those aged 25 to 49 is 2.8%. For those aged 50 and over it is 2.9%. The quarterly change is 0.49 percentage points for 18 to 24 year olds, -0.05 percentage points for 25 to 49 year olds, and 0.49 percentage points for the over-50s. 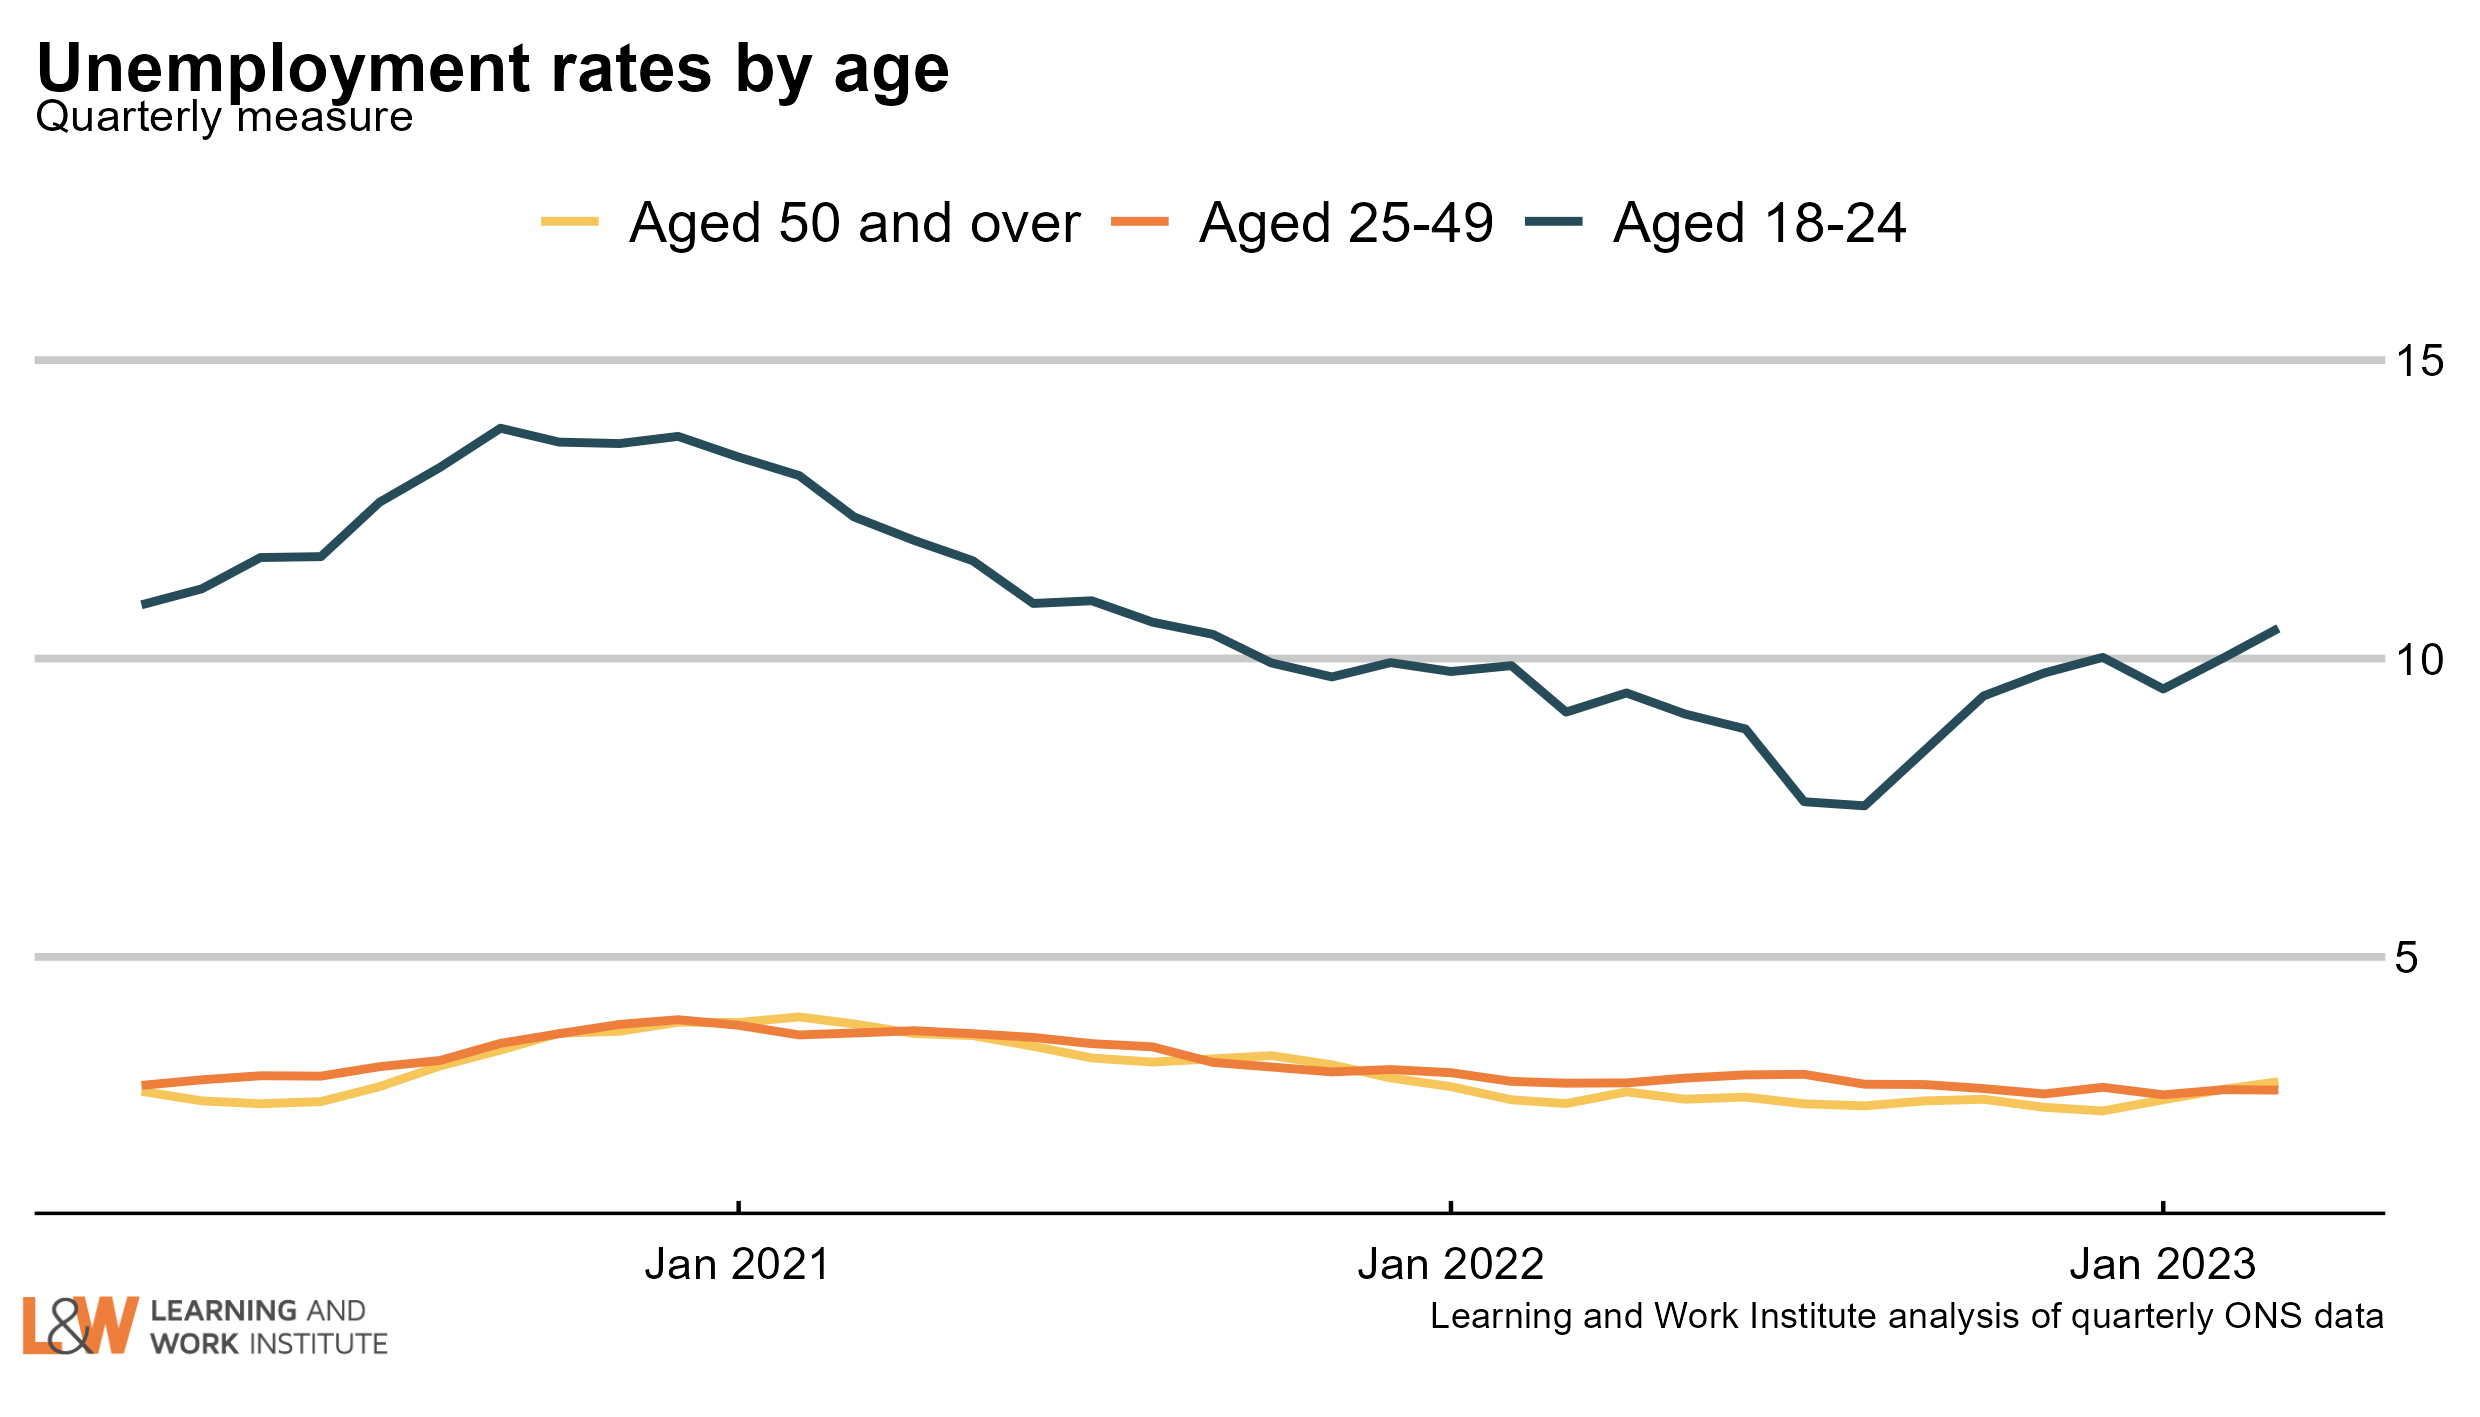 Chart 8: Unemployment rate changes by age (counting February 2020 as 100) The 18 to 24 year old unemployment rate (including students) is unchanged compared to February 2020. The unemployment rate increased by 0.2 percentage points for those aged 25 to 34 and decreased by 0.2 percentage points for those aged 35 to 49. The unemployment rate also increased by 0.1 percentage points for those aged 50 to 64 and decreased by 0.4 percentage points for those aged over 65. 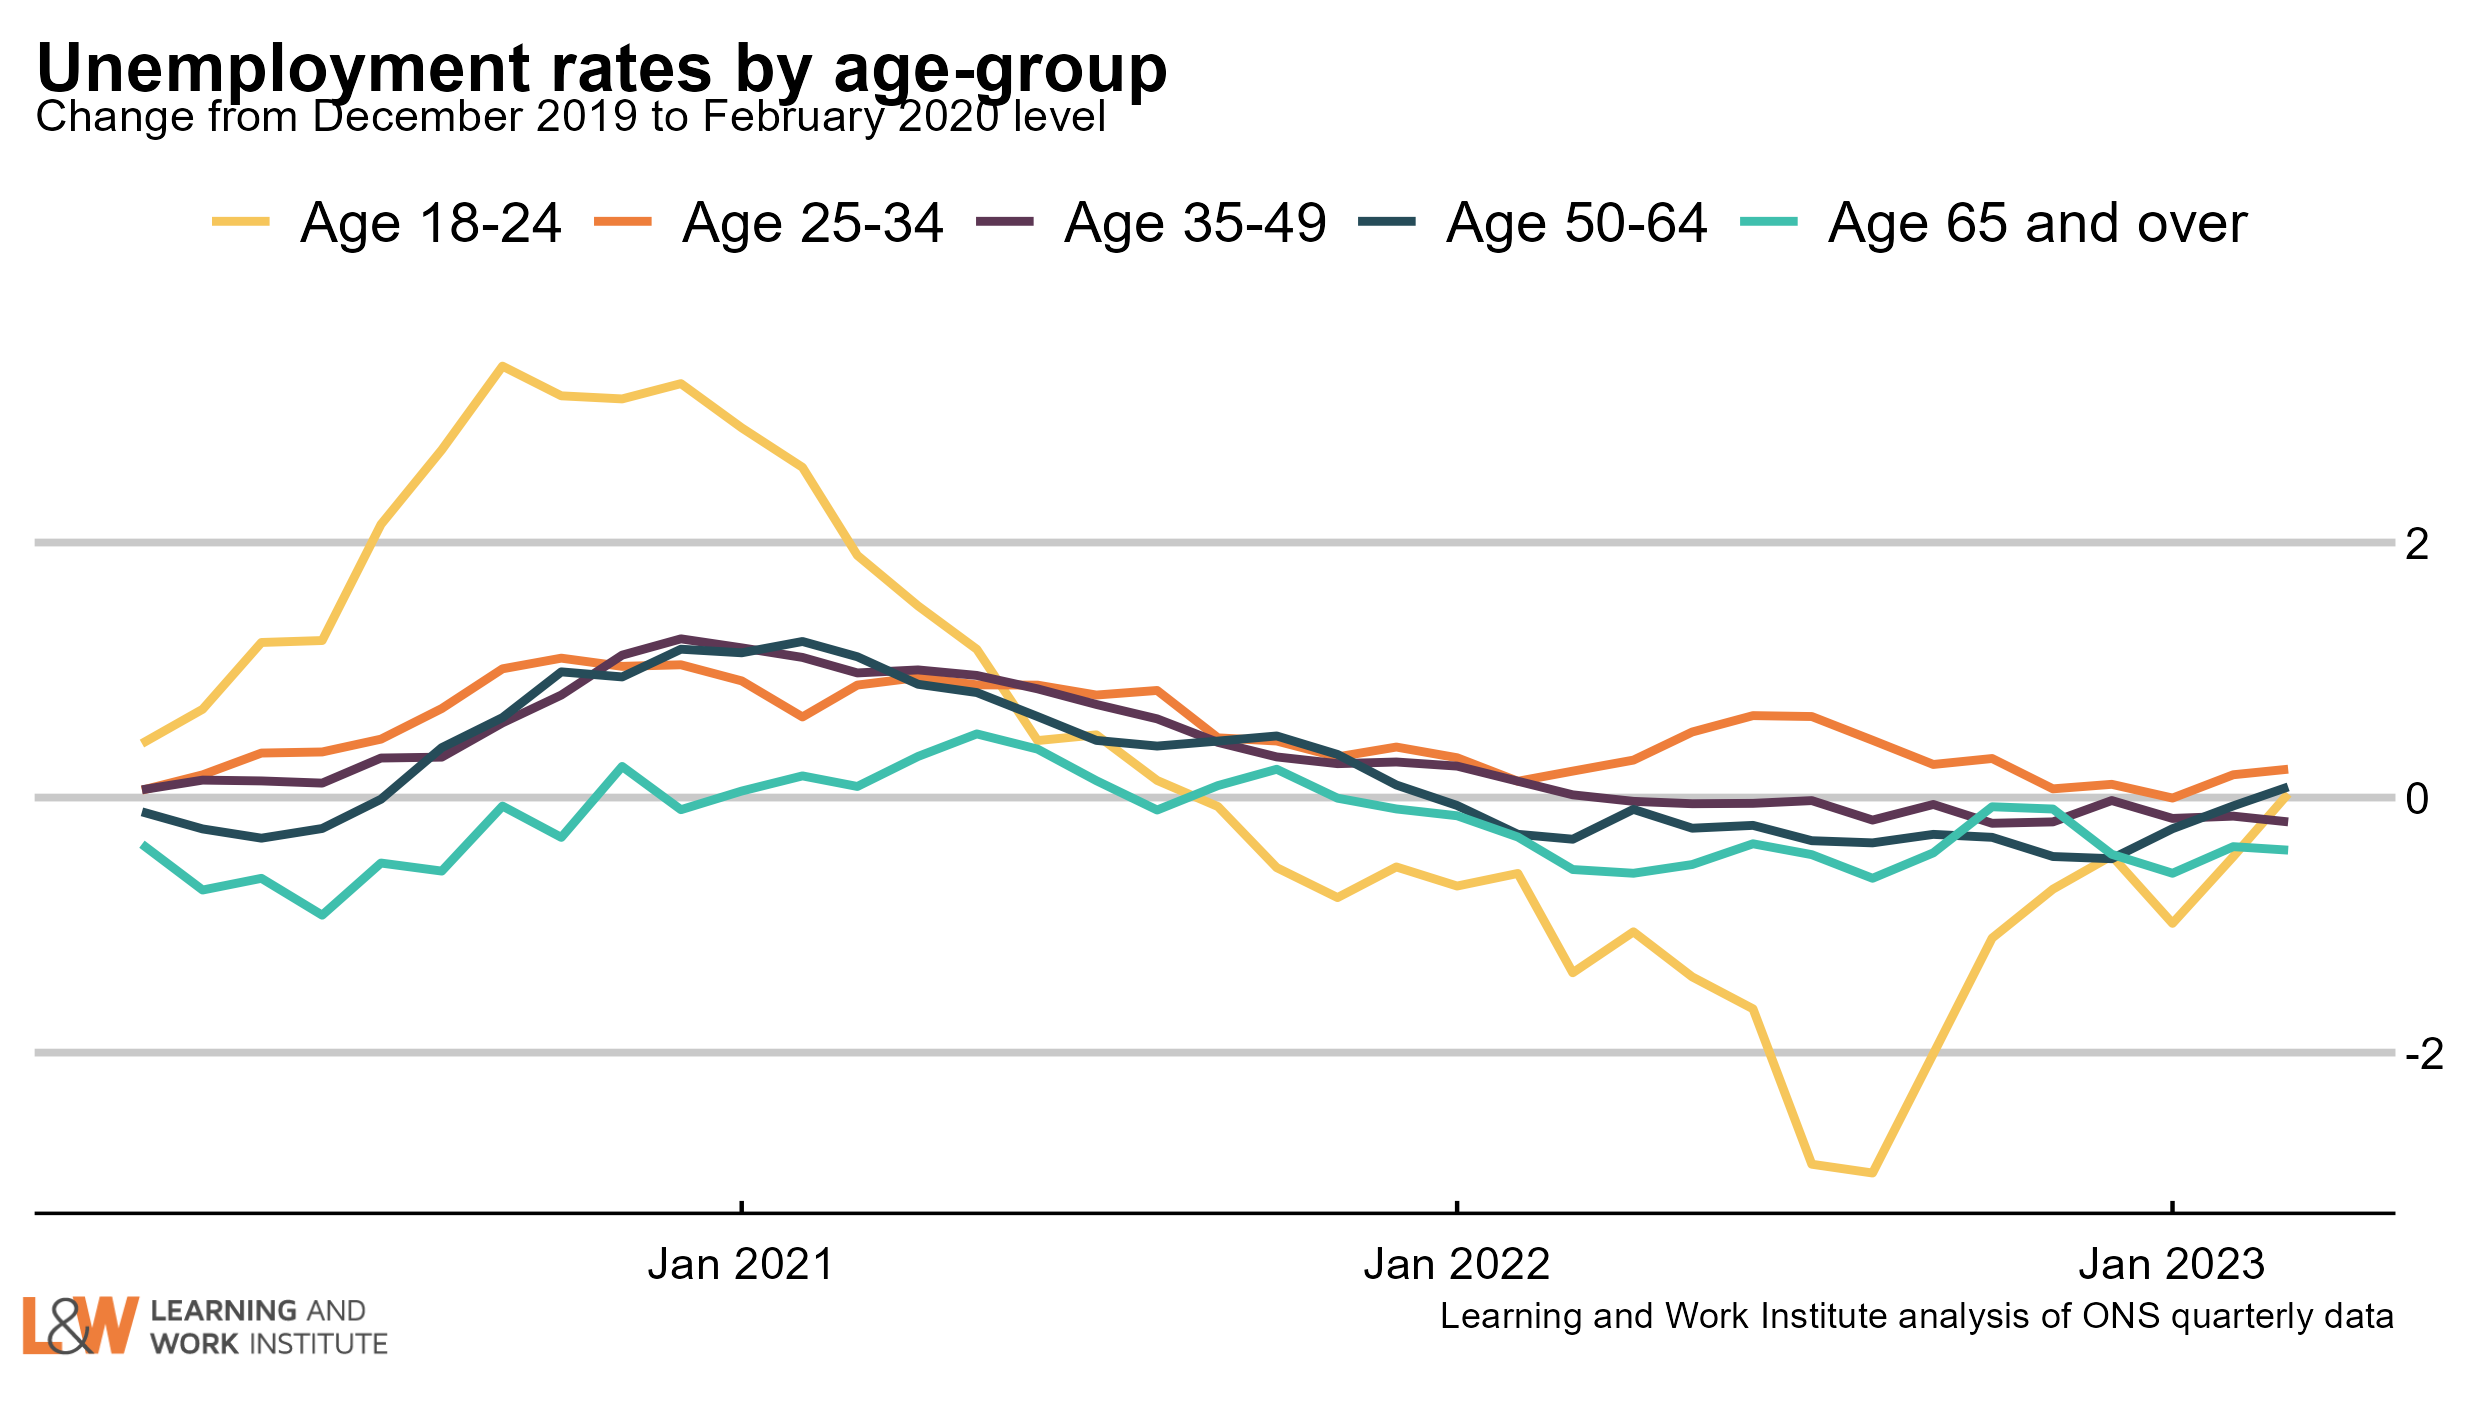
|
|
| Chart 9: Vacancies – whole economy survey Headline vacancies this month fell by 31,000 to 1,083,000. The ONS' experimental single-month vacancy figures was stable in the last quarter. The headline ONS vacancy figure is both seasonally adjusted and a three-month average. 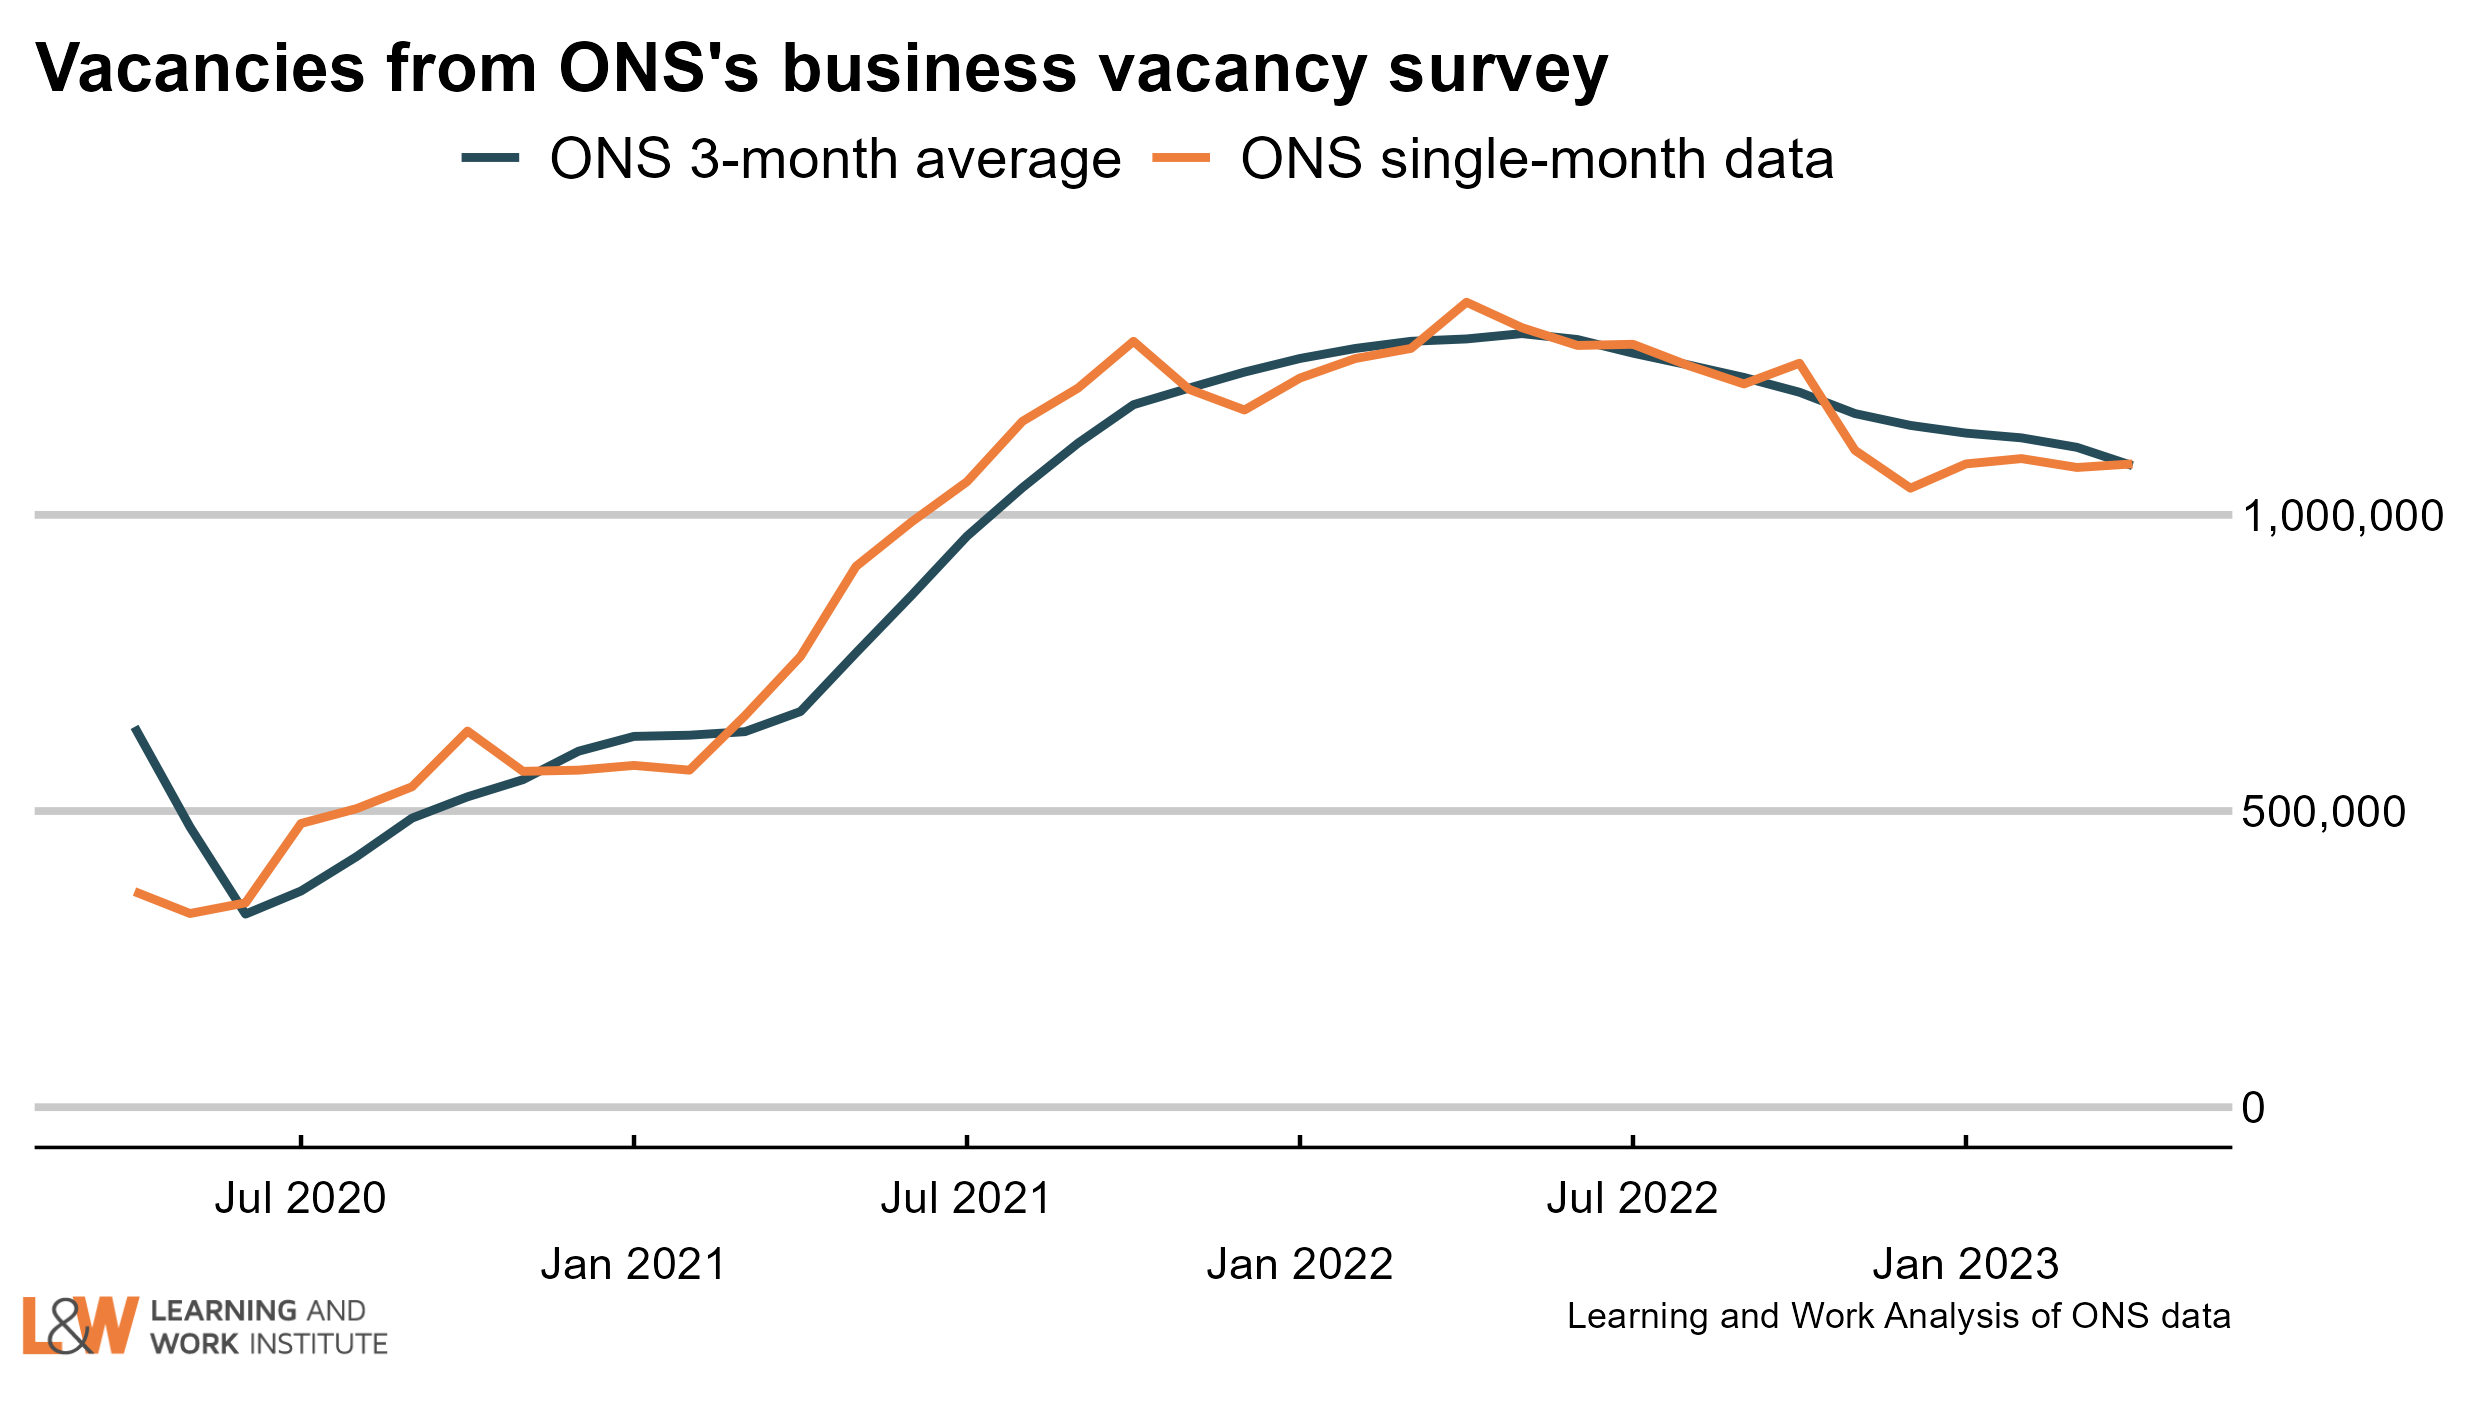 |
|
| Chart 10: UK employment Employment has risen by 45,000 on the figure published last month, to 32,995,000. The chart shows both the official figures and the experimental monthly figures. 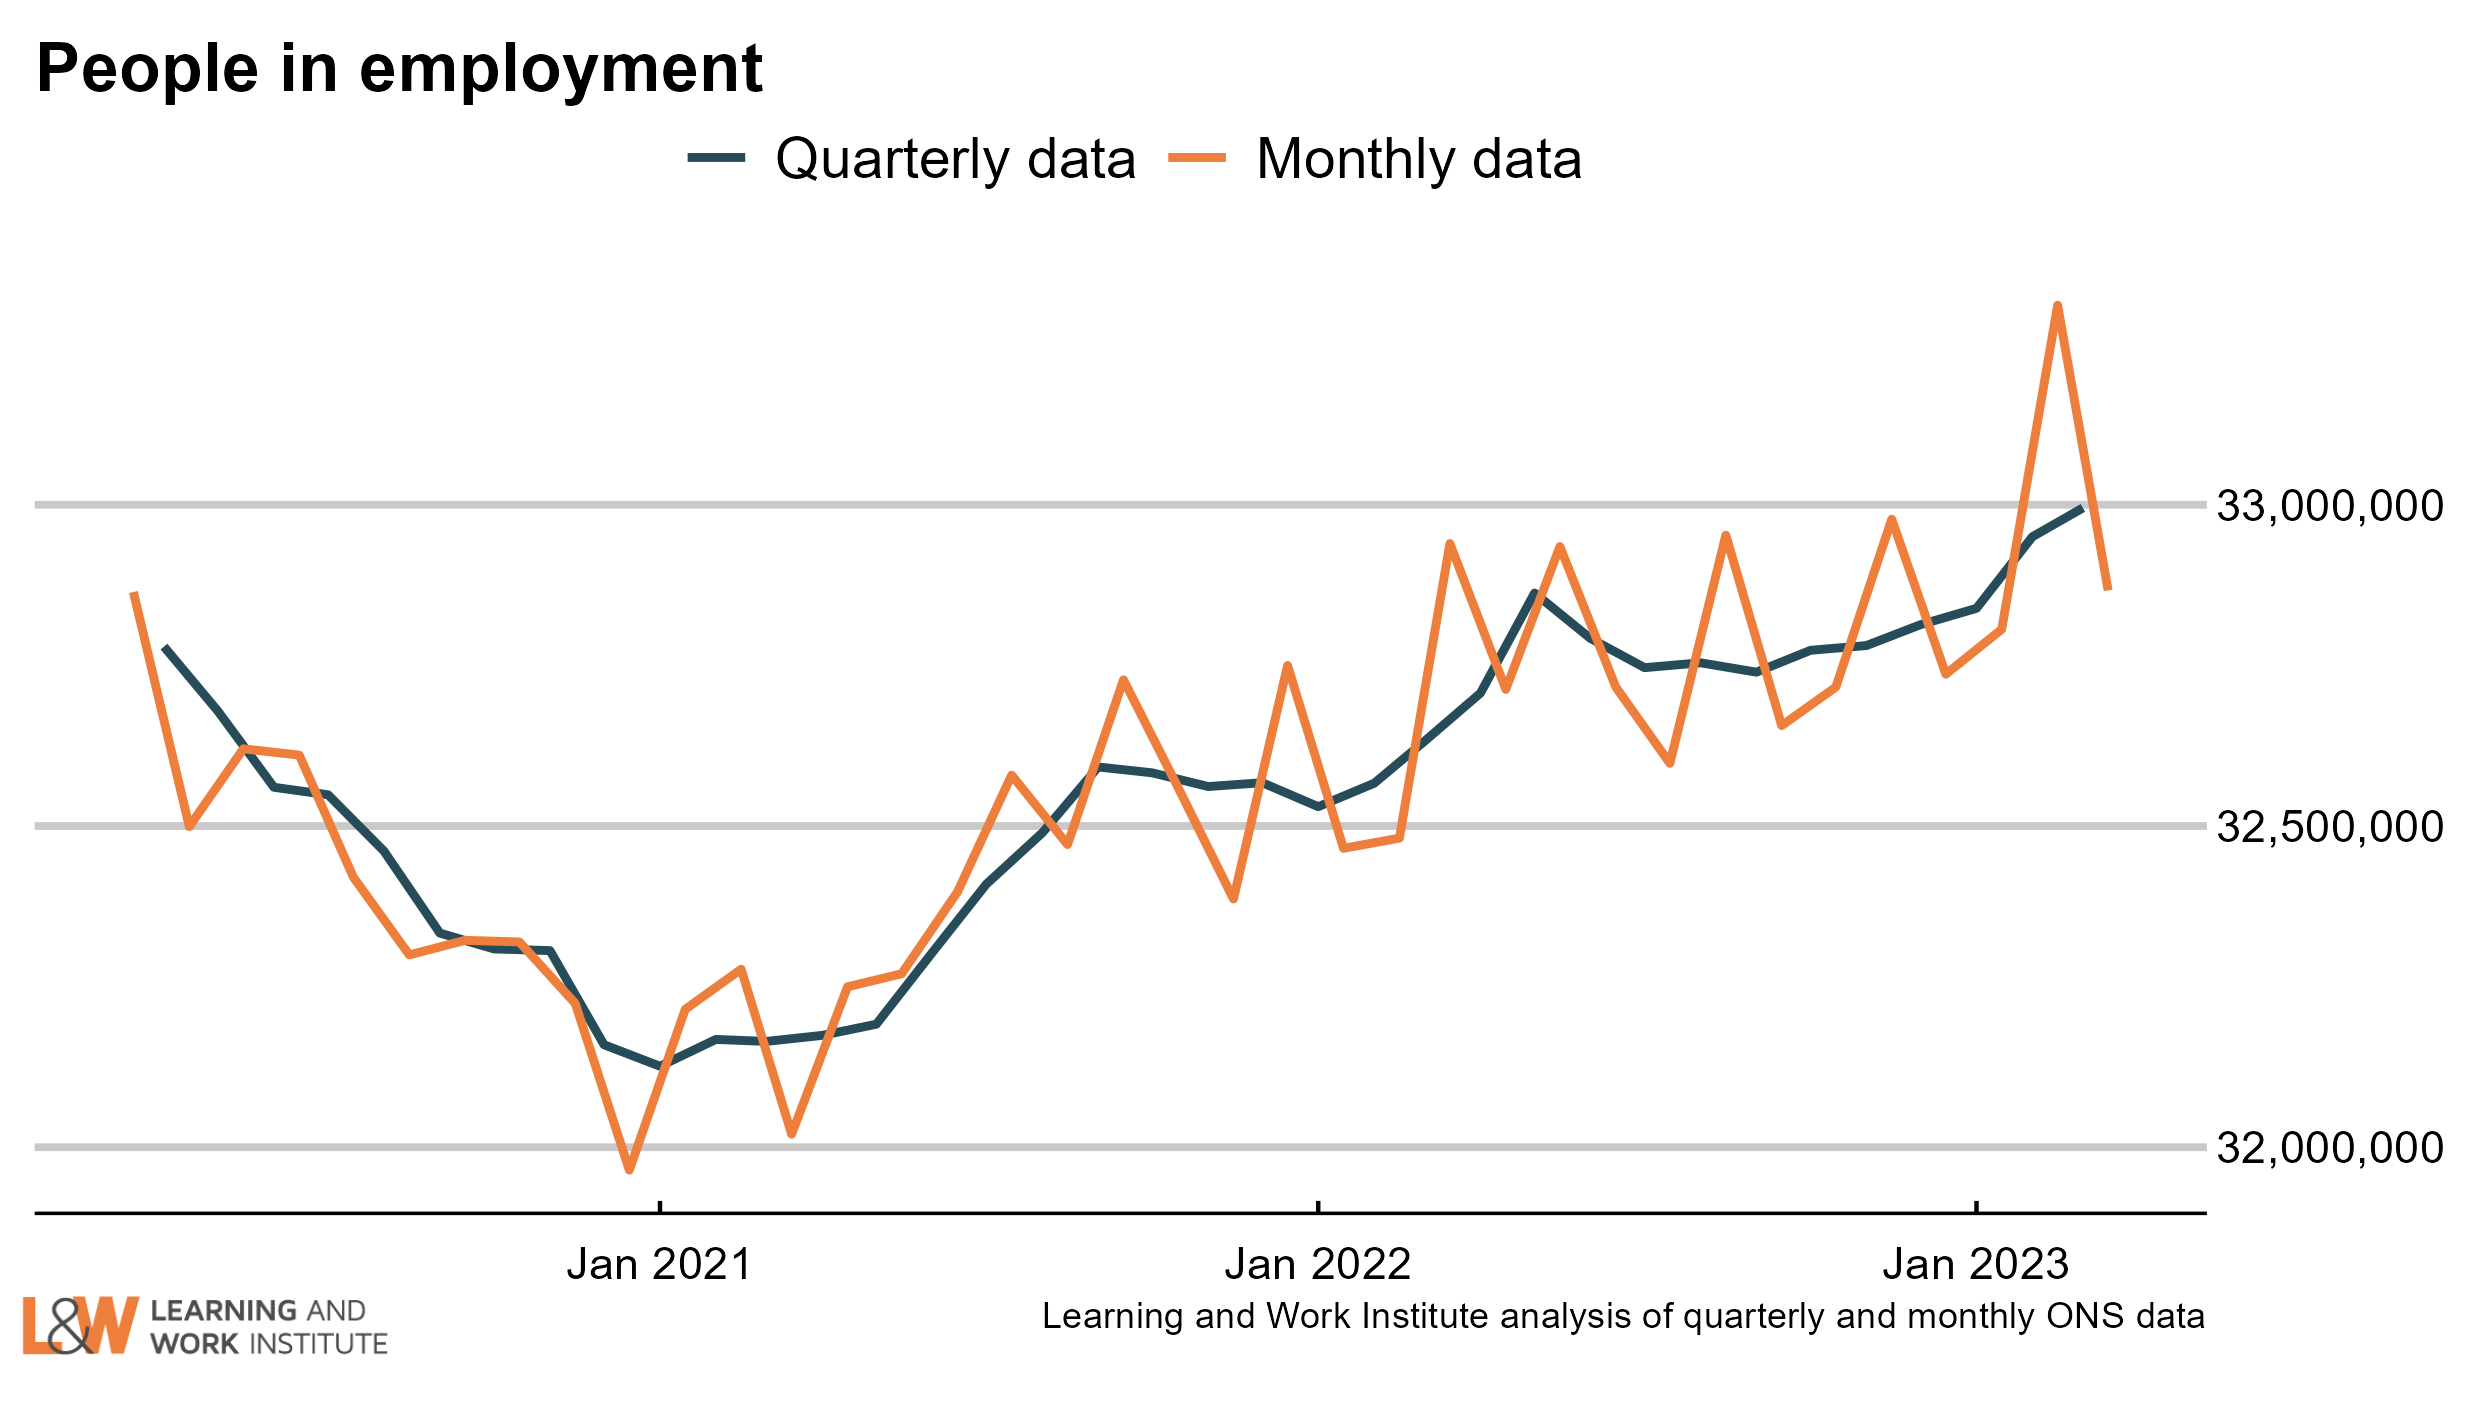 |
|
| Chart 11: Employment rate in the UK The employment rate increased by 0.2 percentage points over the quarter, to 75.9%. The chart shows both the official figures and the experimental monthly figures. 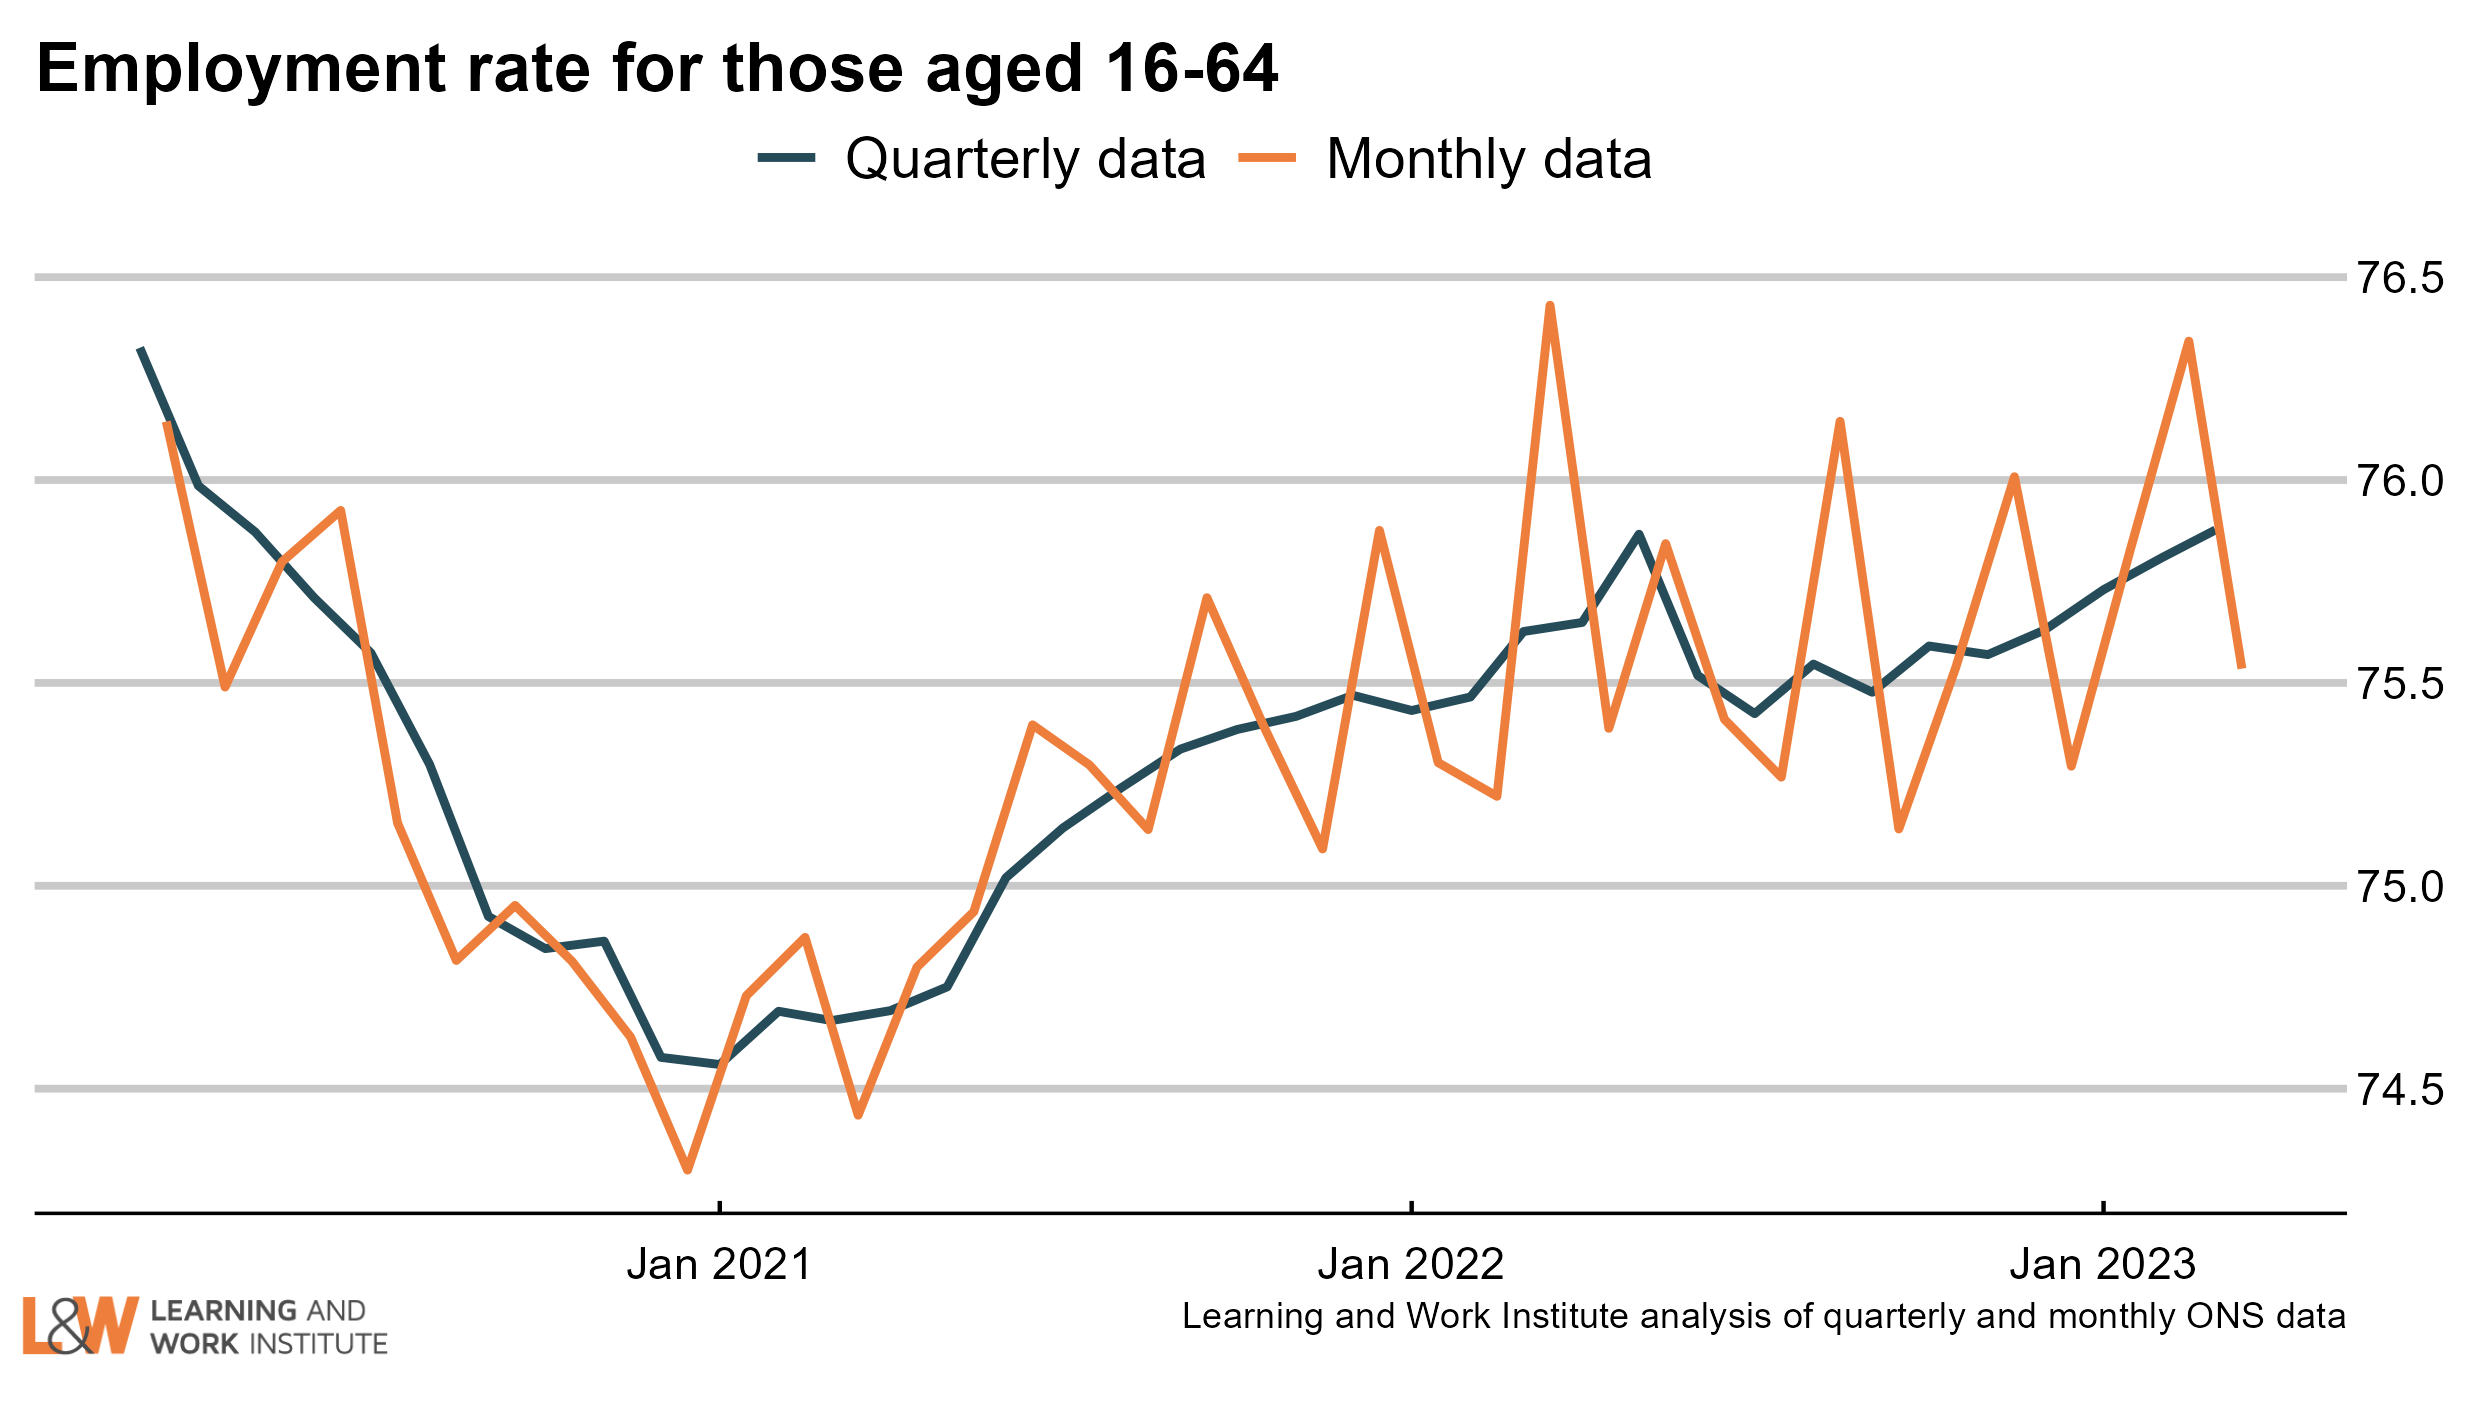 |
|
| Chart 12: Economic inactivity – the long-term sick or disabled The number of people who are economically inactive (that is, not working and not currently looking for work) who are long-term sick or disabled rose by 1.2% in the last 6 months to more than 2,550,000 working age people. 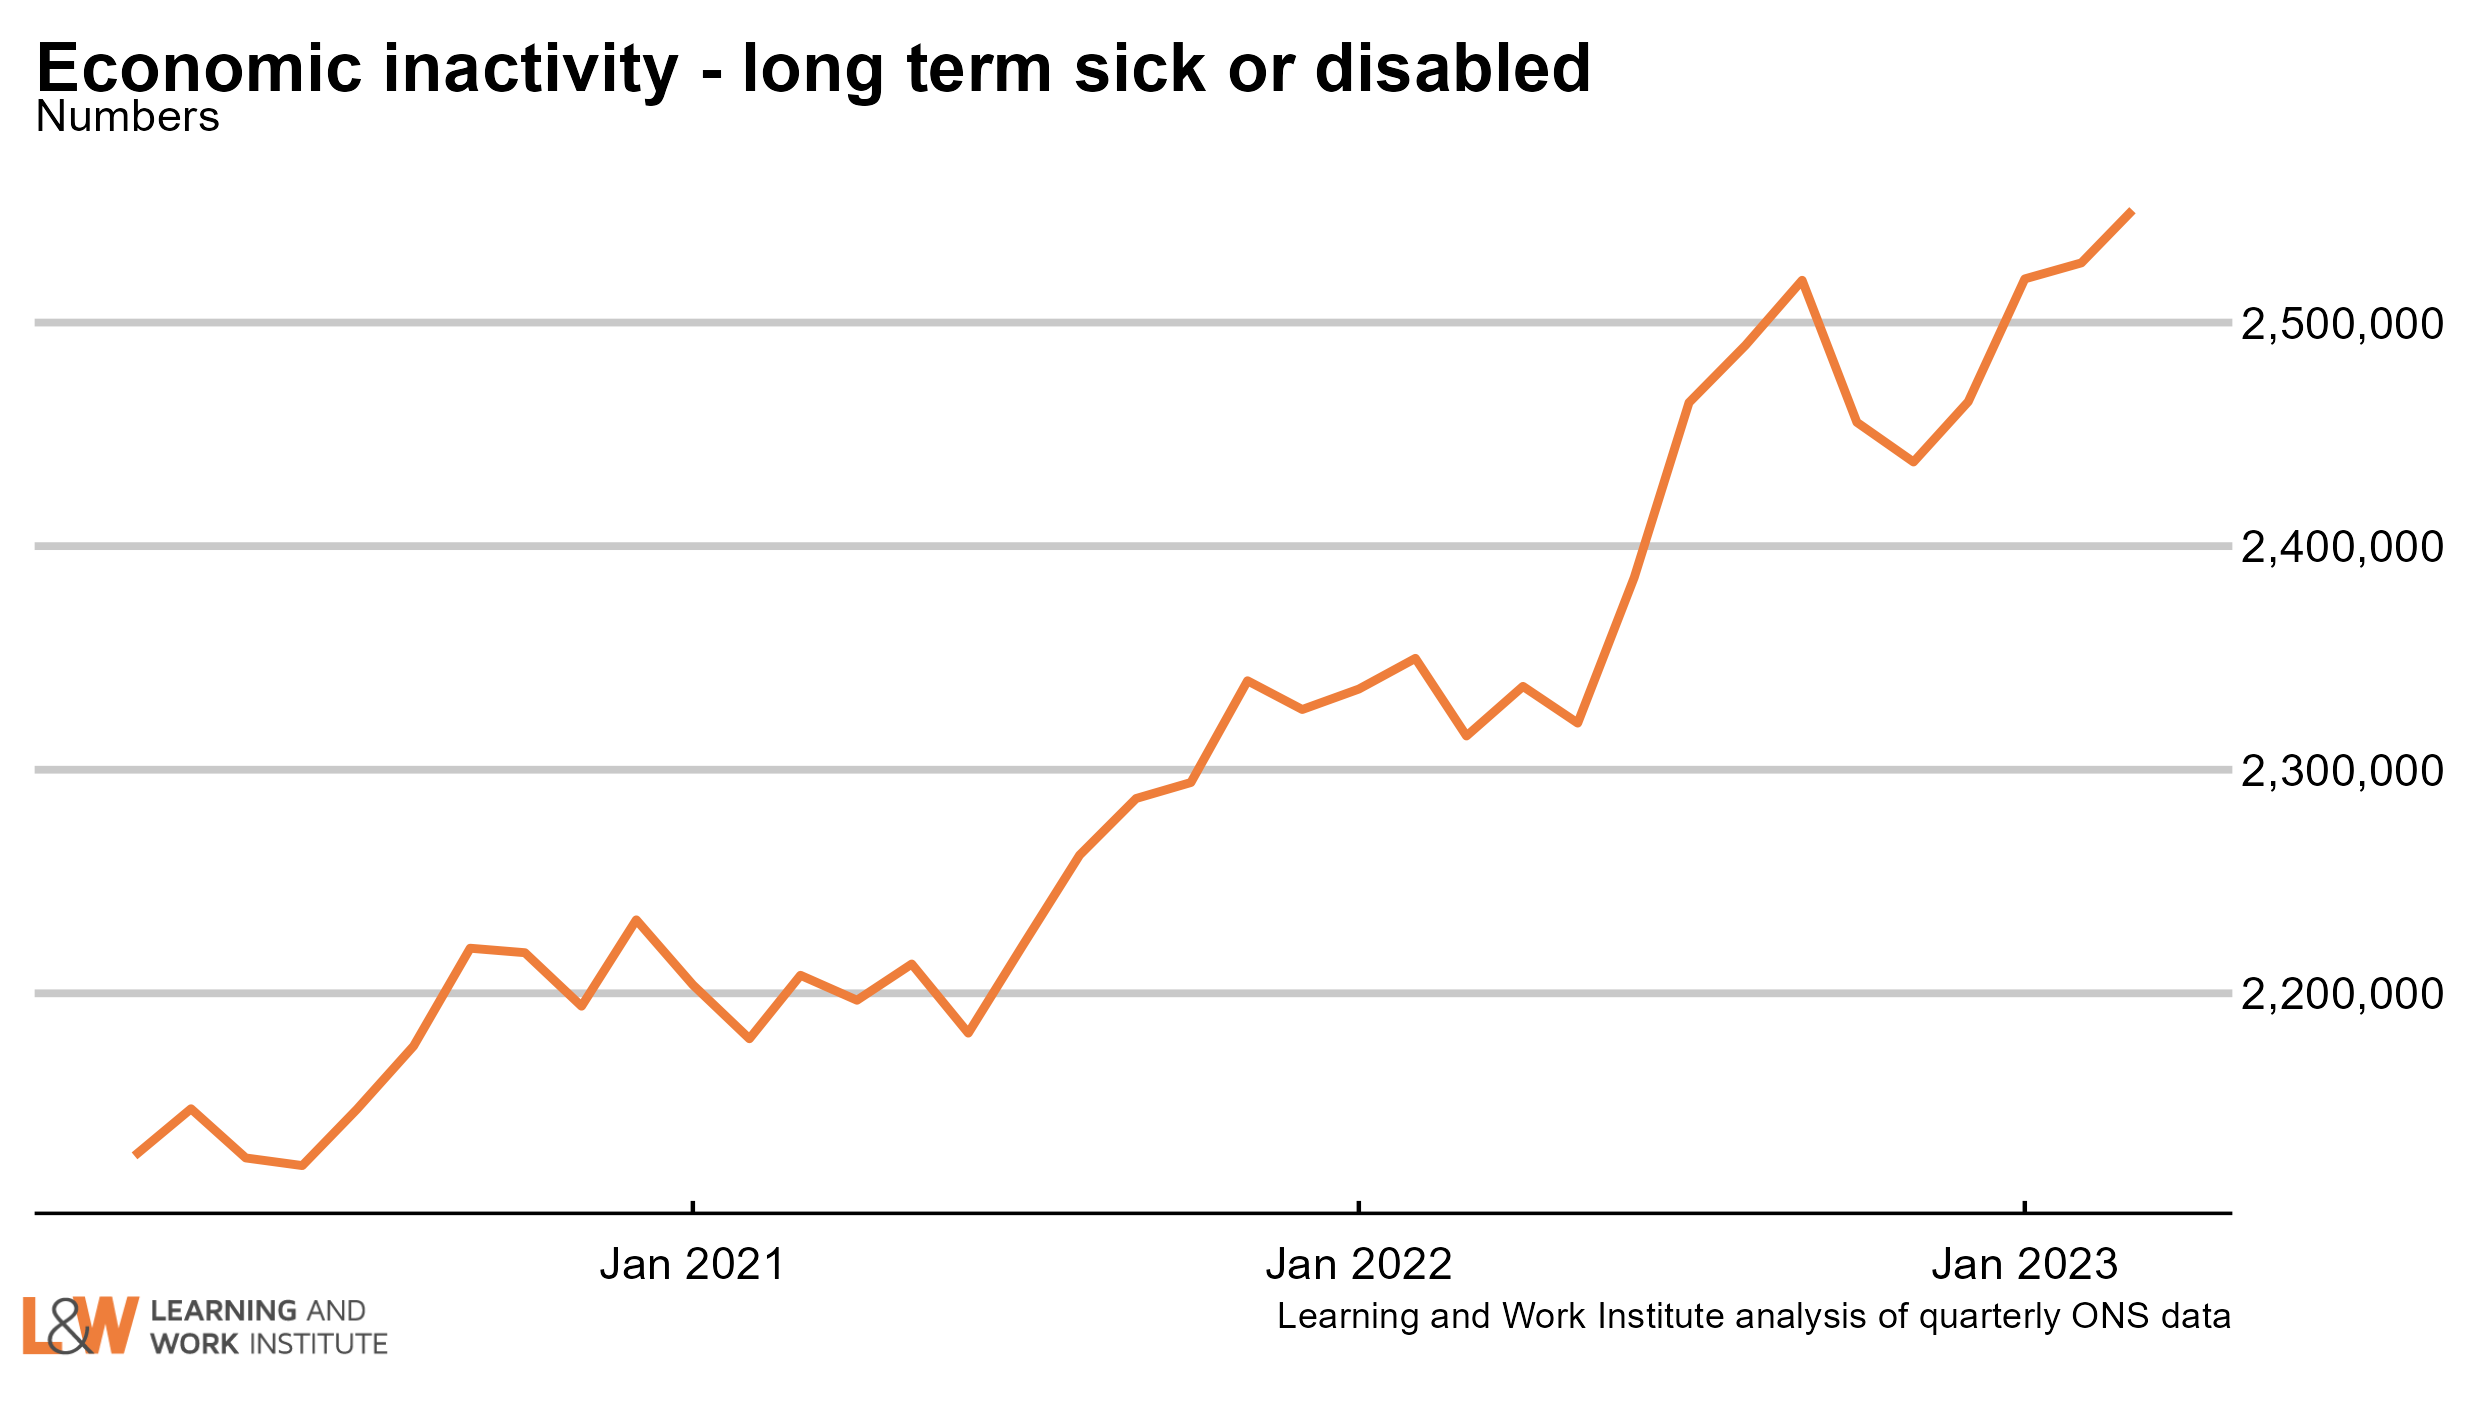 |
|
| Chart 13: Economic inactivity – people looking after family The survey figures show the numbers looking after family and not doing paid work or looking for paid work have been rising steadily since early 2021. There are now 1,660,000 people looking after family and not working, compared to a low point of 1,590,000. However, the numbers have fallen slightly in recent months. 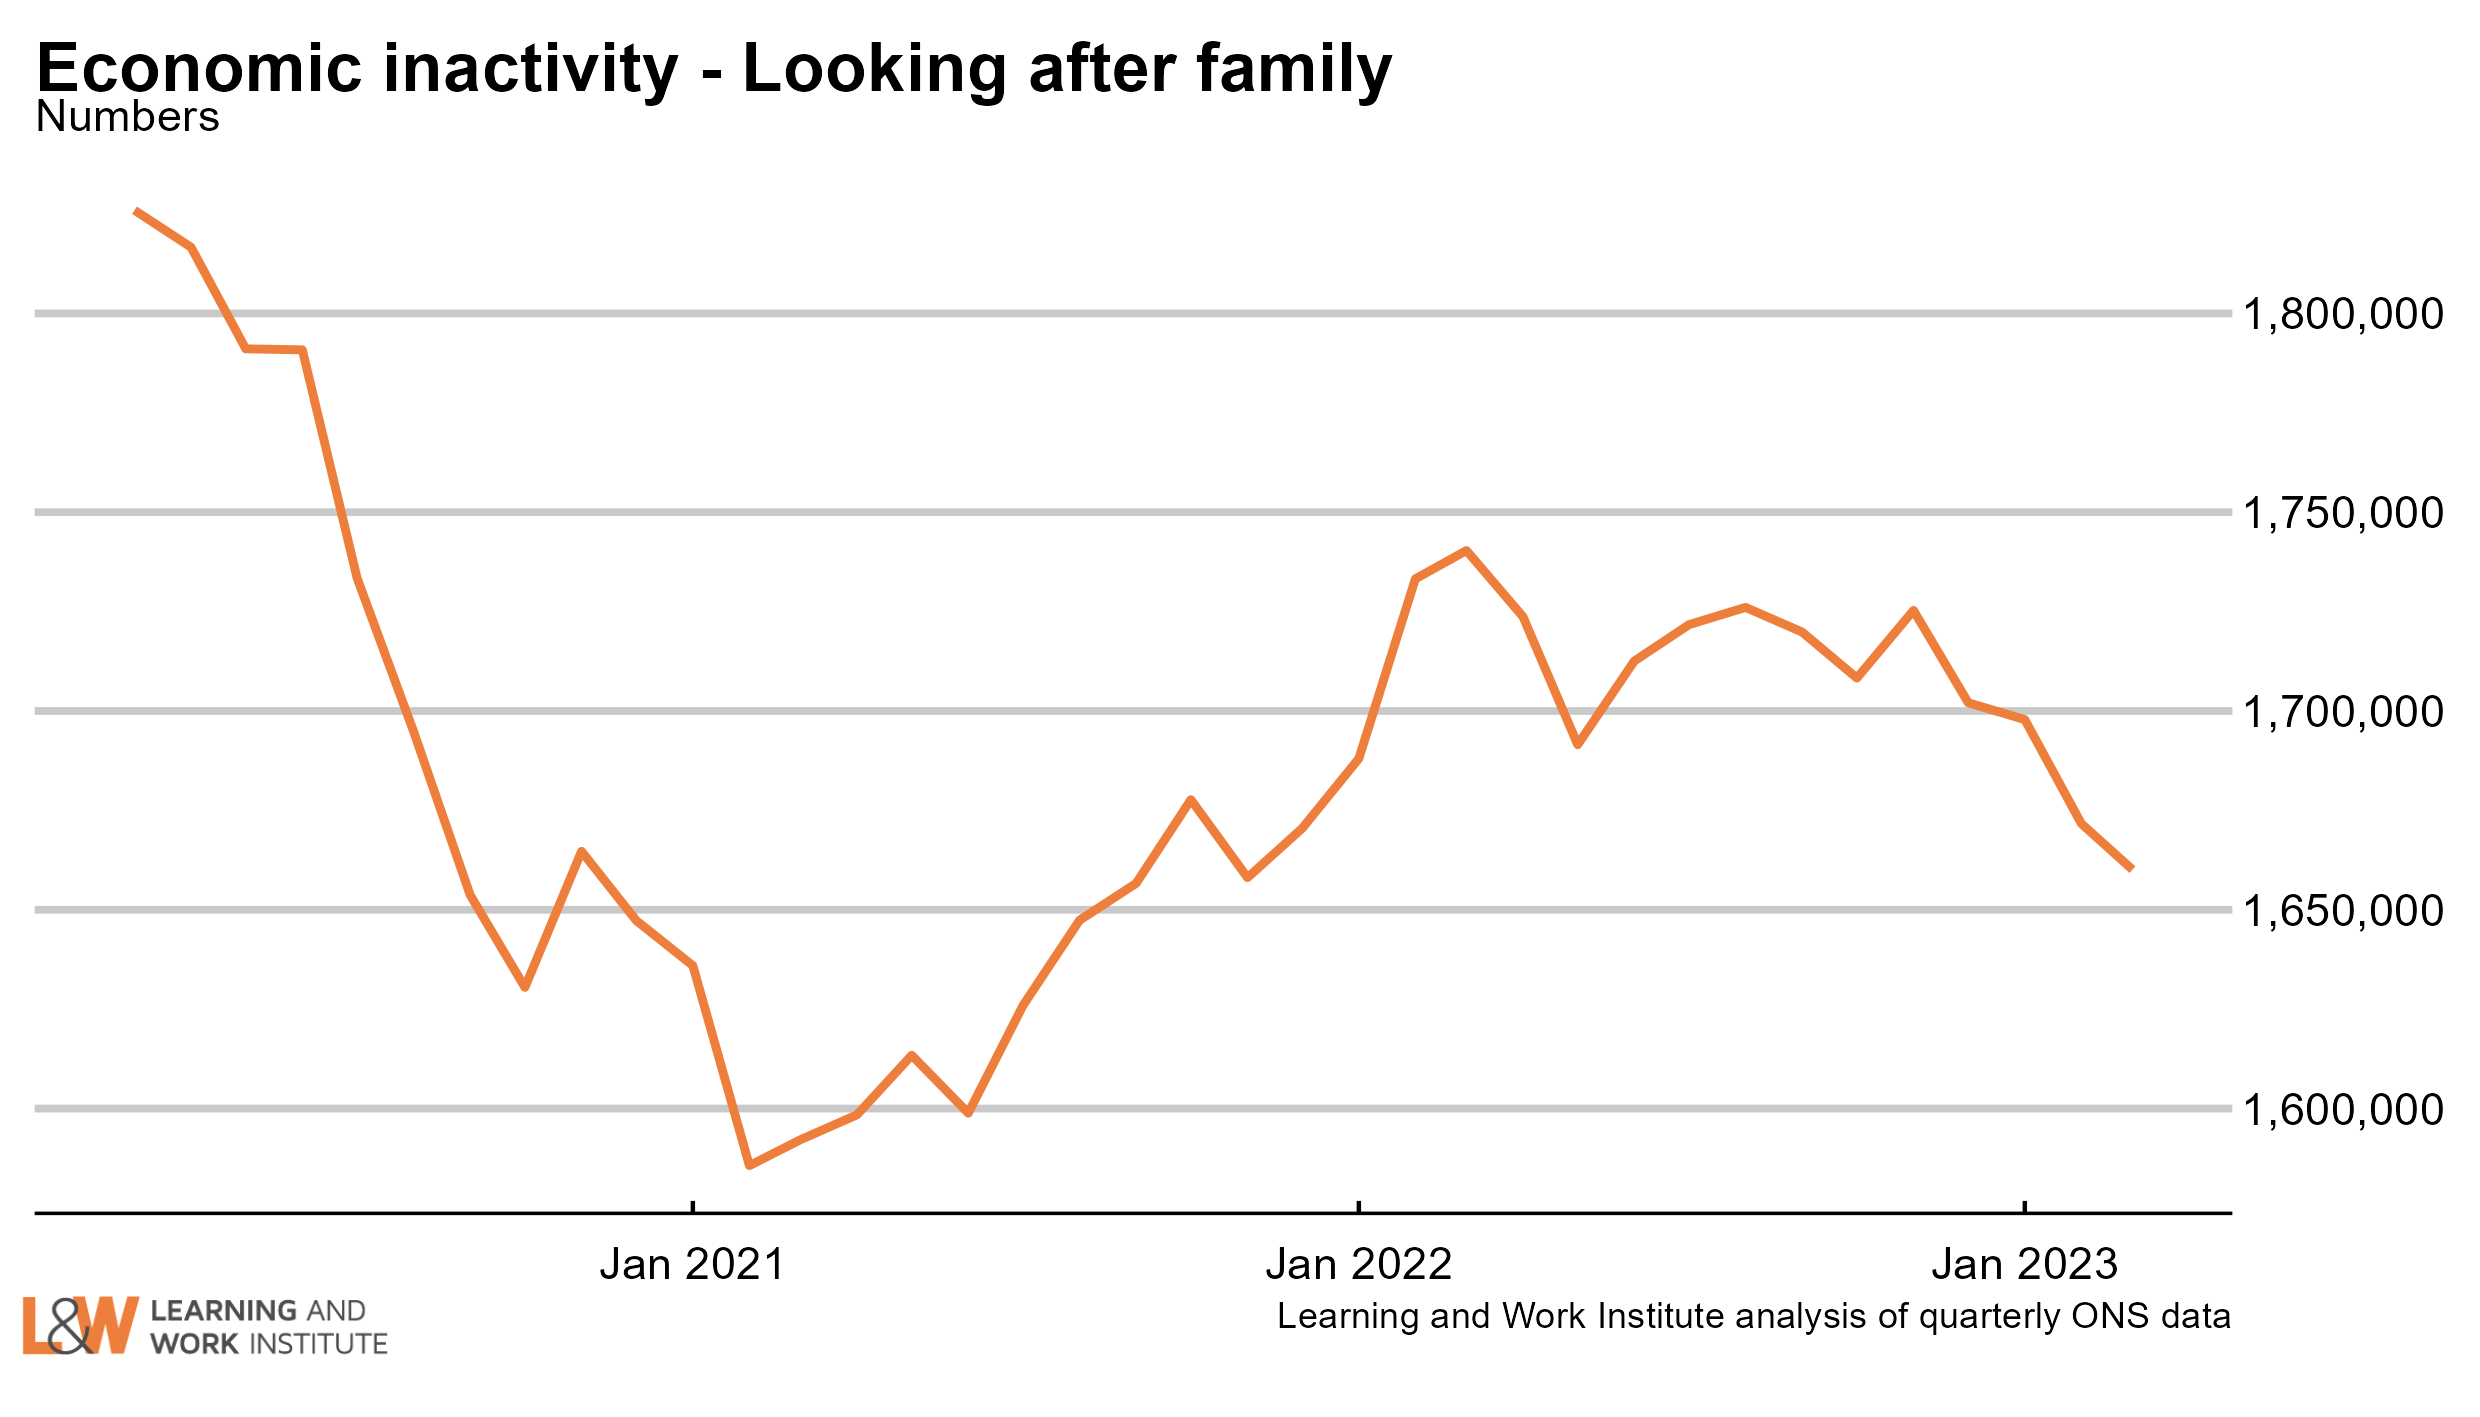 |
|
| Chart 14: Economic inactivity – other inactive In the Coronavirus period, people who were not working or looking for work due to Covid were included in this group. The number in this category increased sharply at the time, but has since declined. A relatively high proportion of this group want to work. There are now 1,033,000 people who are classified as economically inactive - other, 30% of whom want to work. This is compared to a high point of 1,290,000. 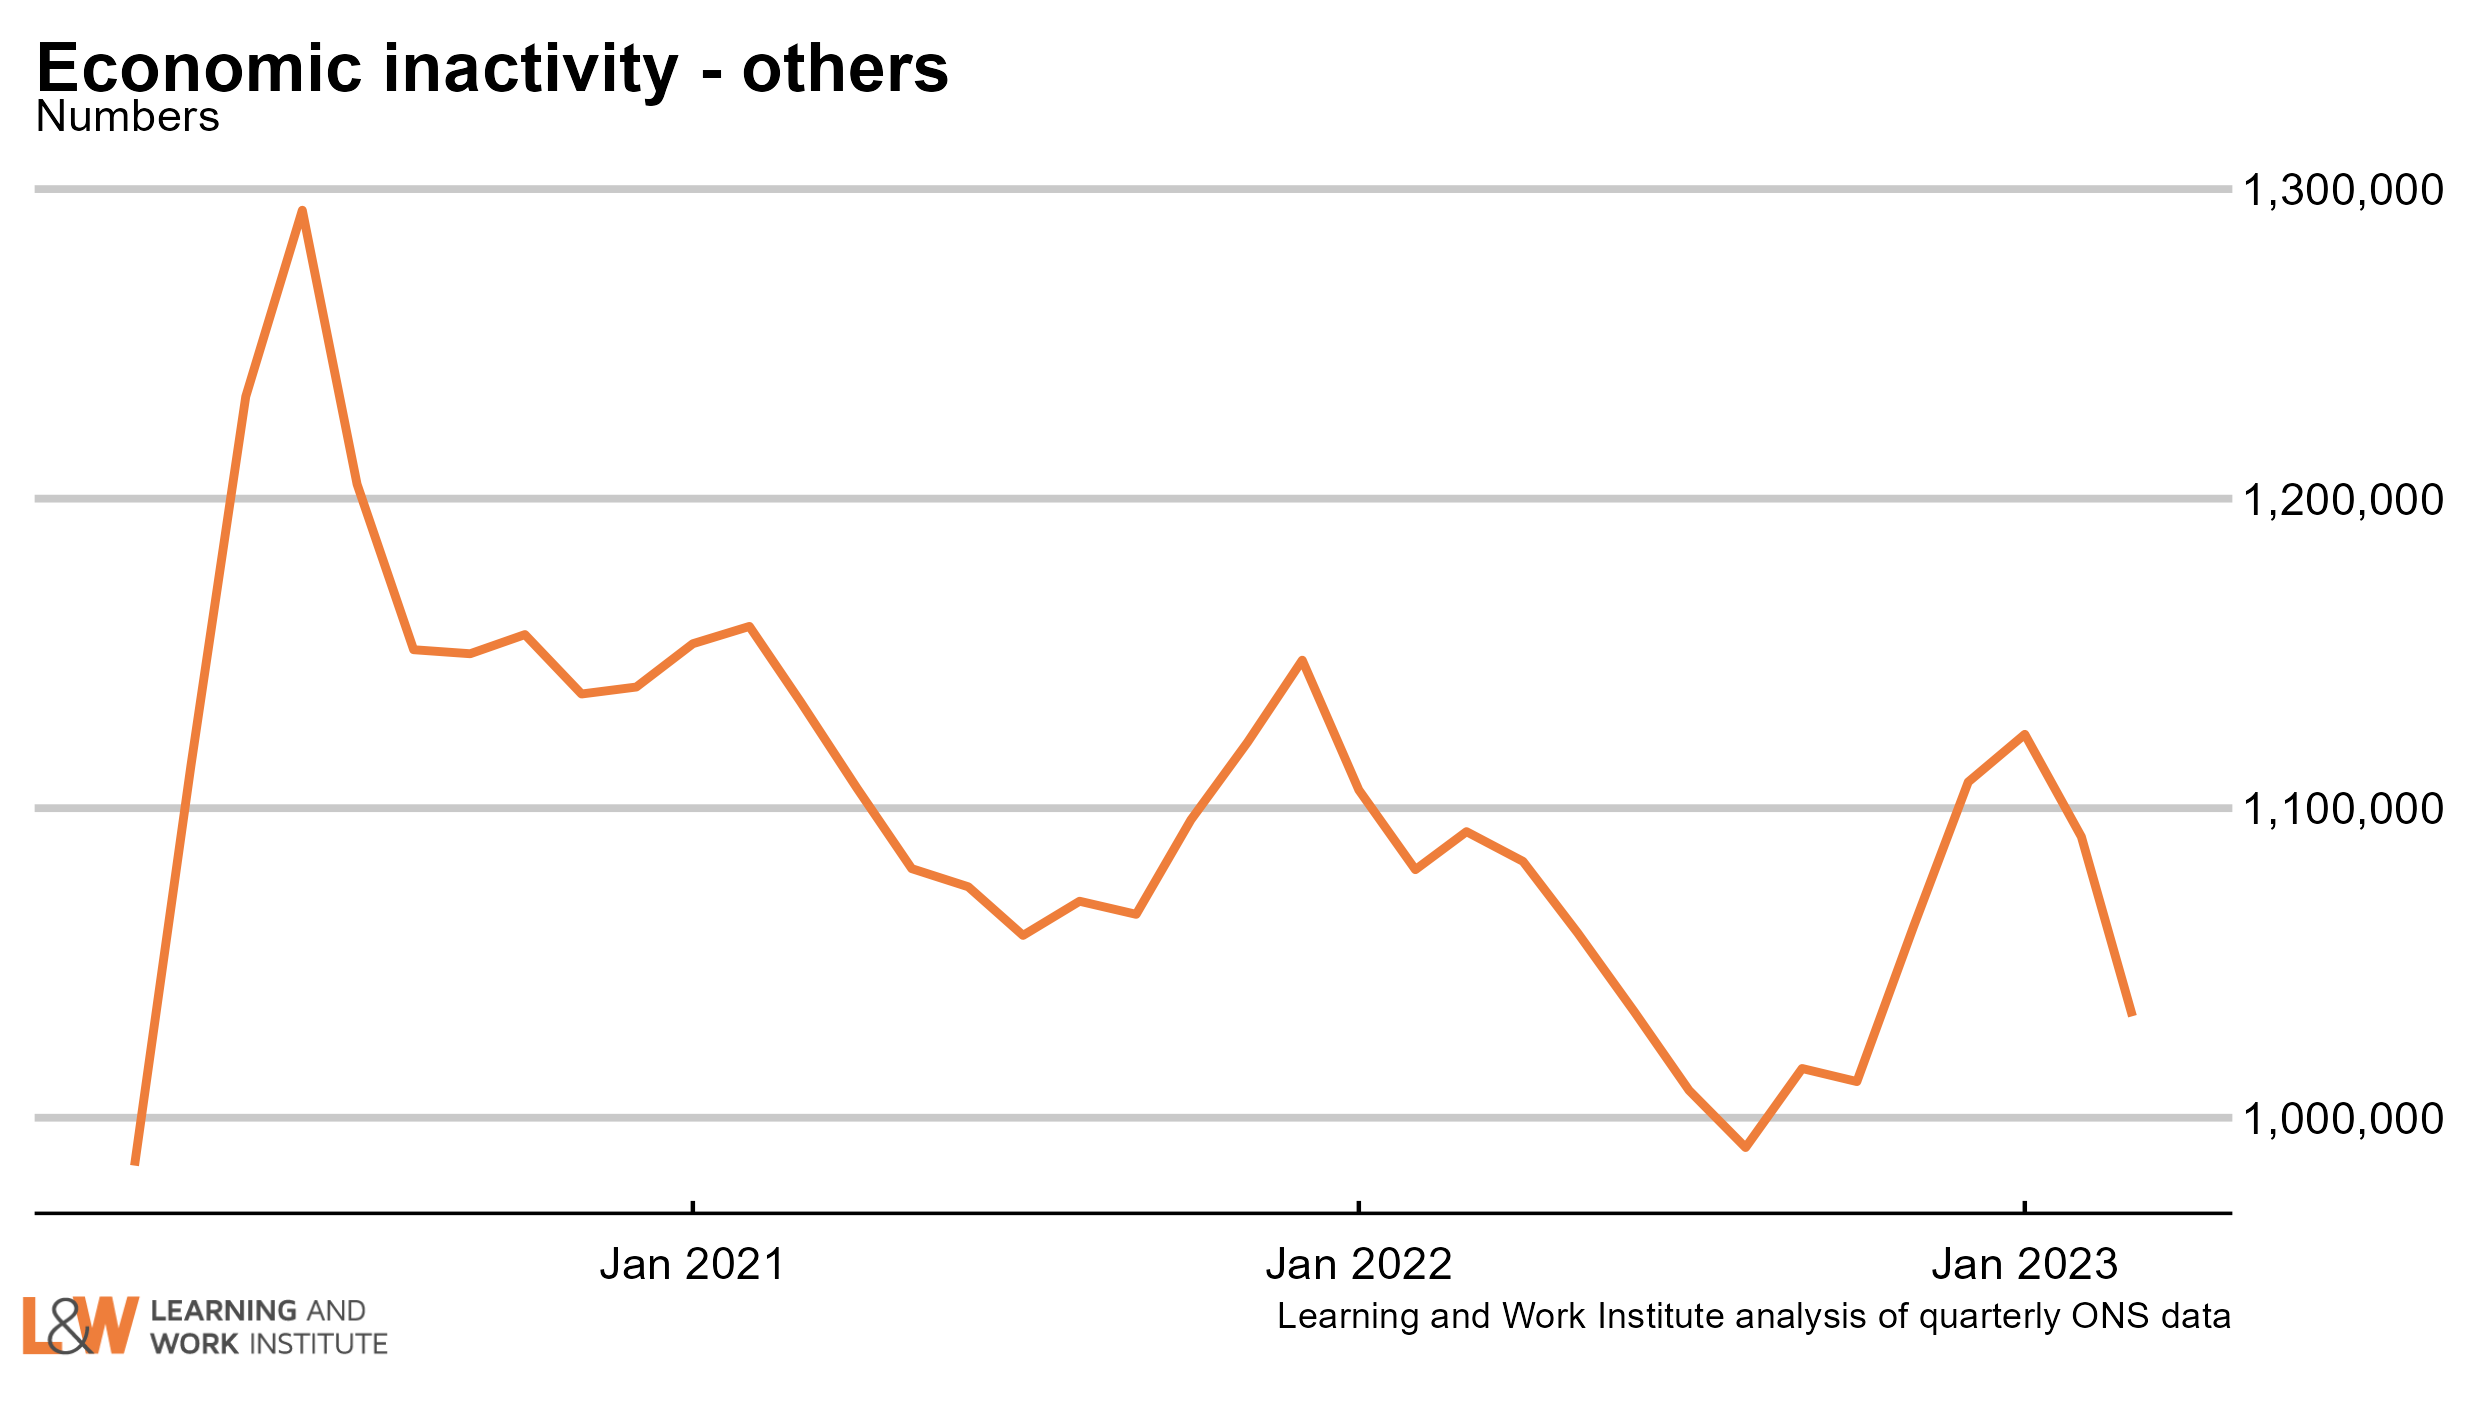 |
|
| Chart 15: Employment rate three-year change in regions – January to March 2023 This quarter, compared to 2020, 5 regions showed a rise in the employment rate, the largest increase being in Yorkshire & the Humber. The employment rate fell in 7 regions, the greatest fall being in Wales. 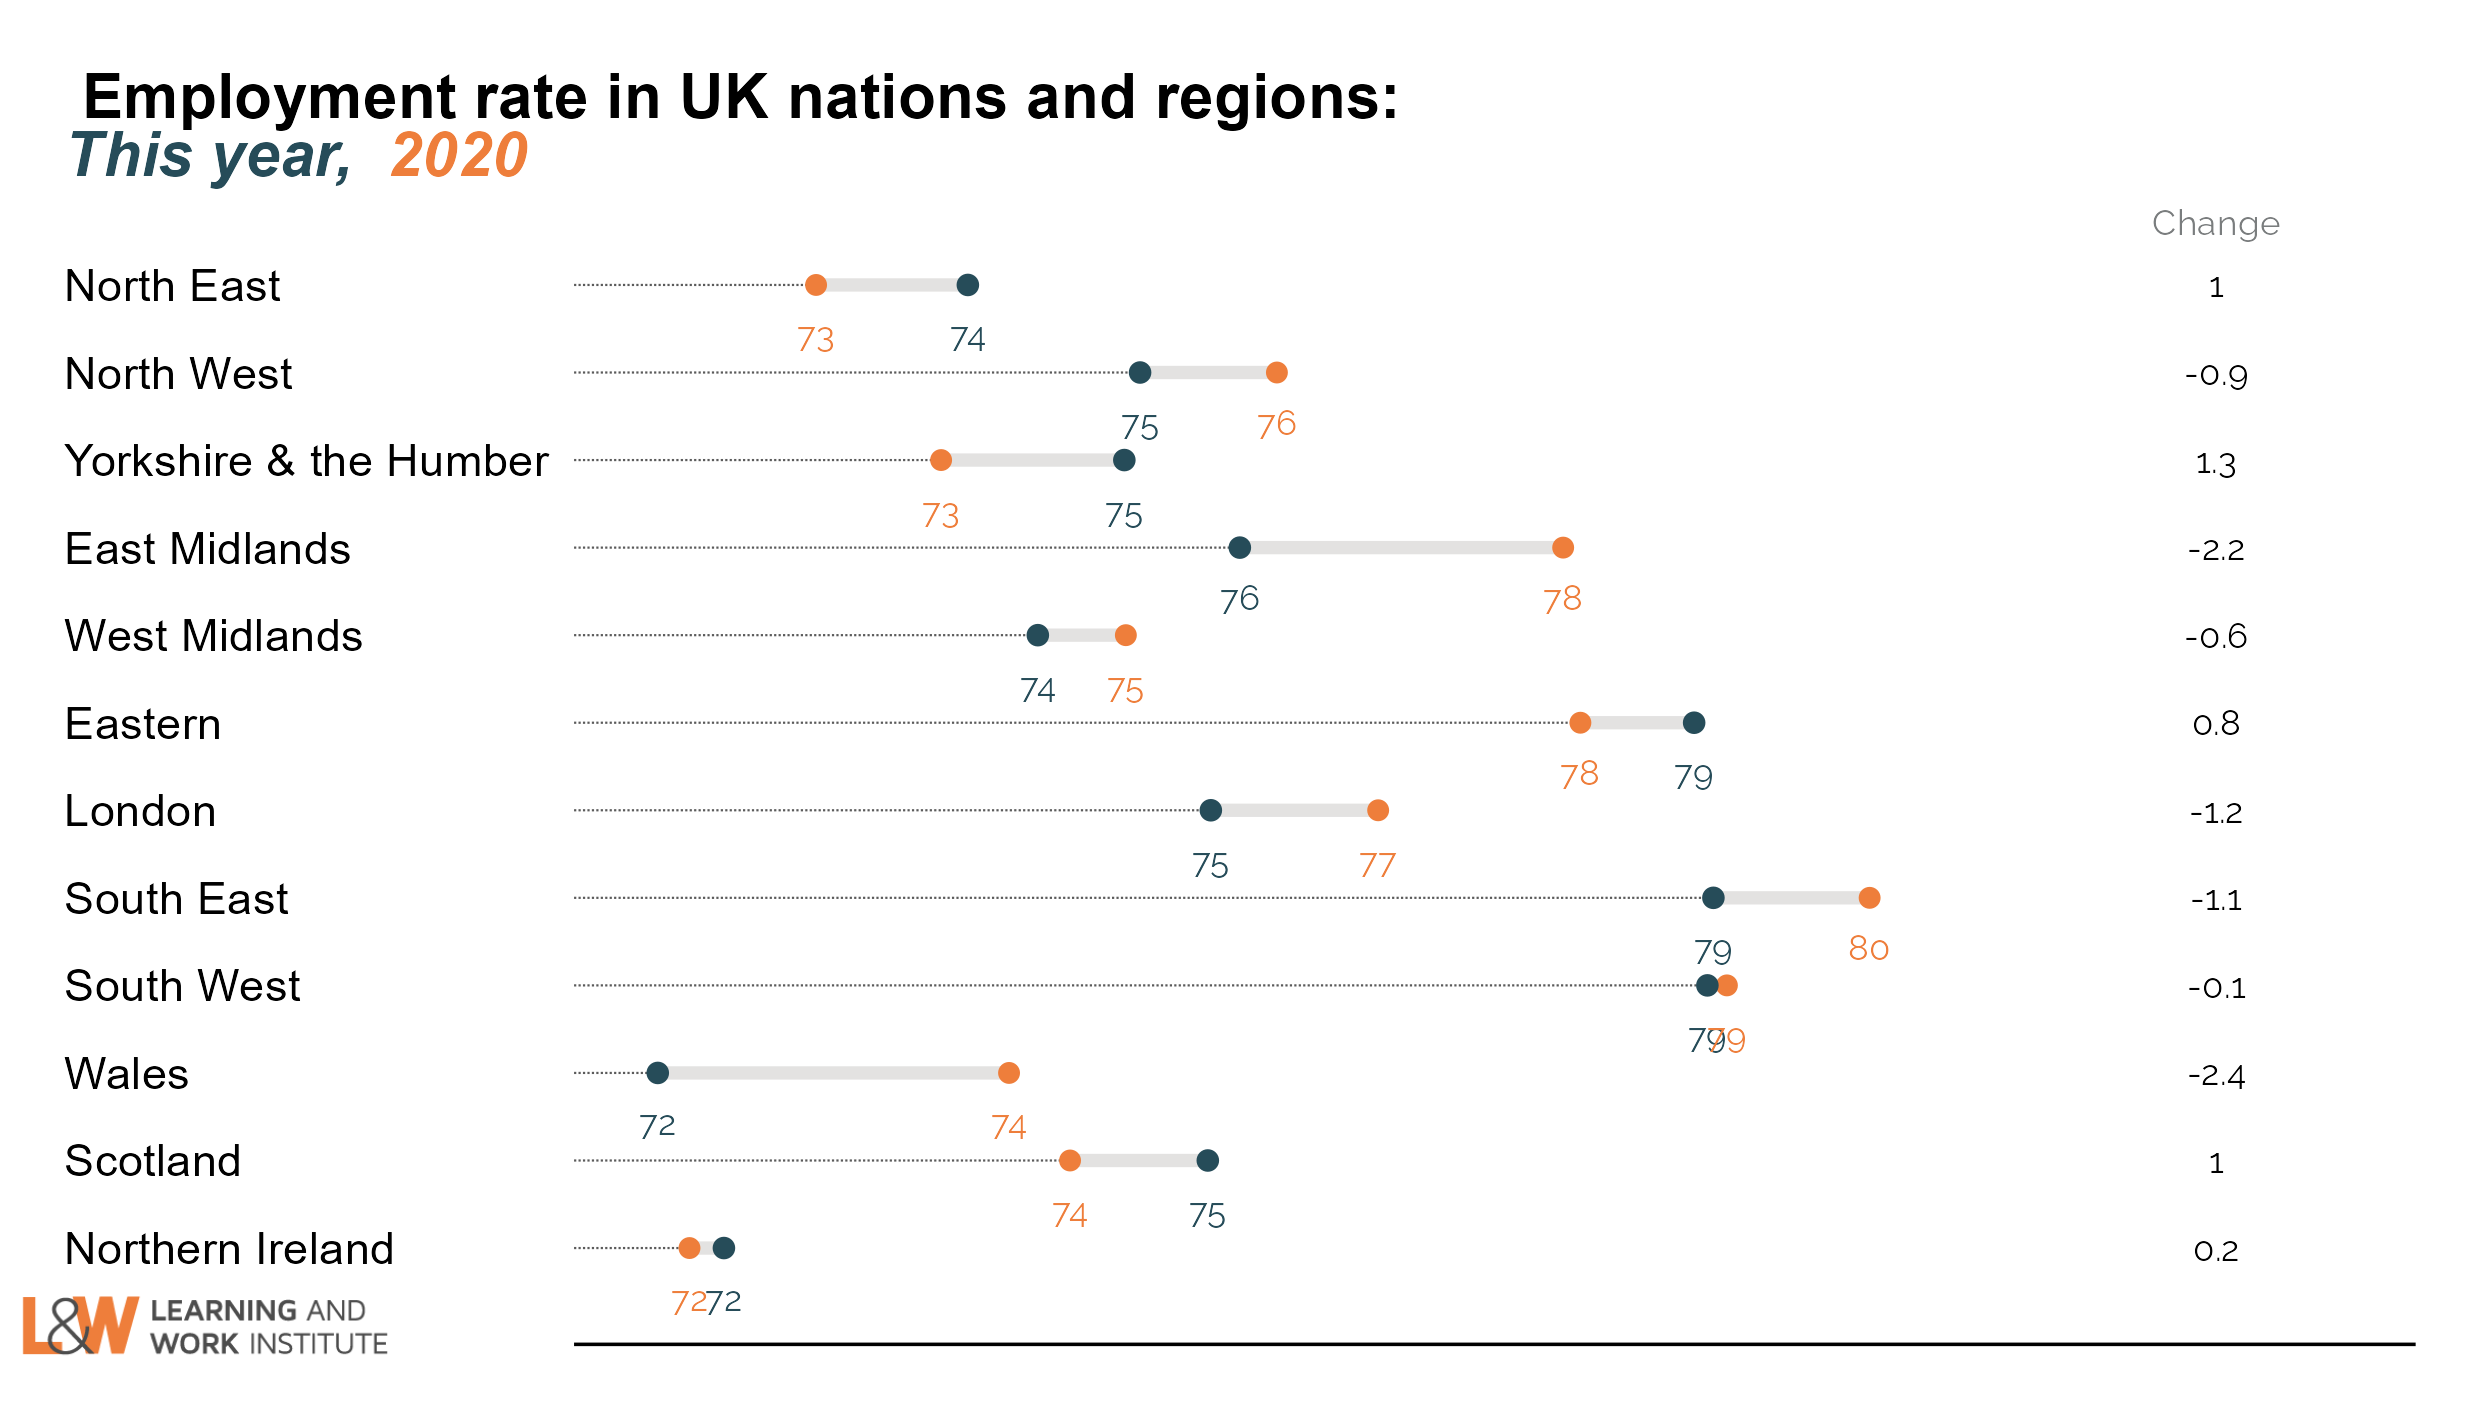 |
|
| Chart 16: Inactivity rate three-year change in regions – January to March 2023 This quarter, compared to 2020, 7 regions showed a rise in the inactivity rate, the largest increase being in the East Midlands. The inactivity rate fell in 4 regions, the greatest falls being in Yorkshire & the Humber and Eastern England. There was no change in Scotland. 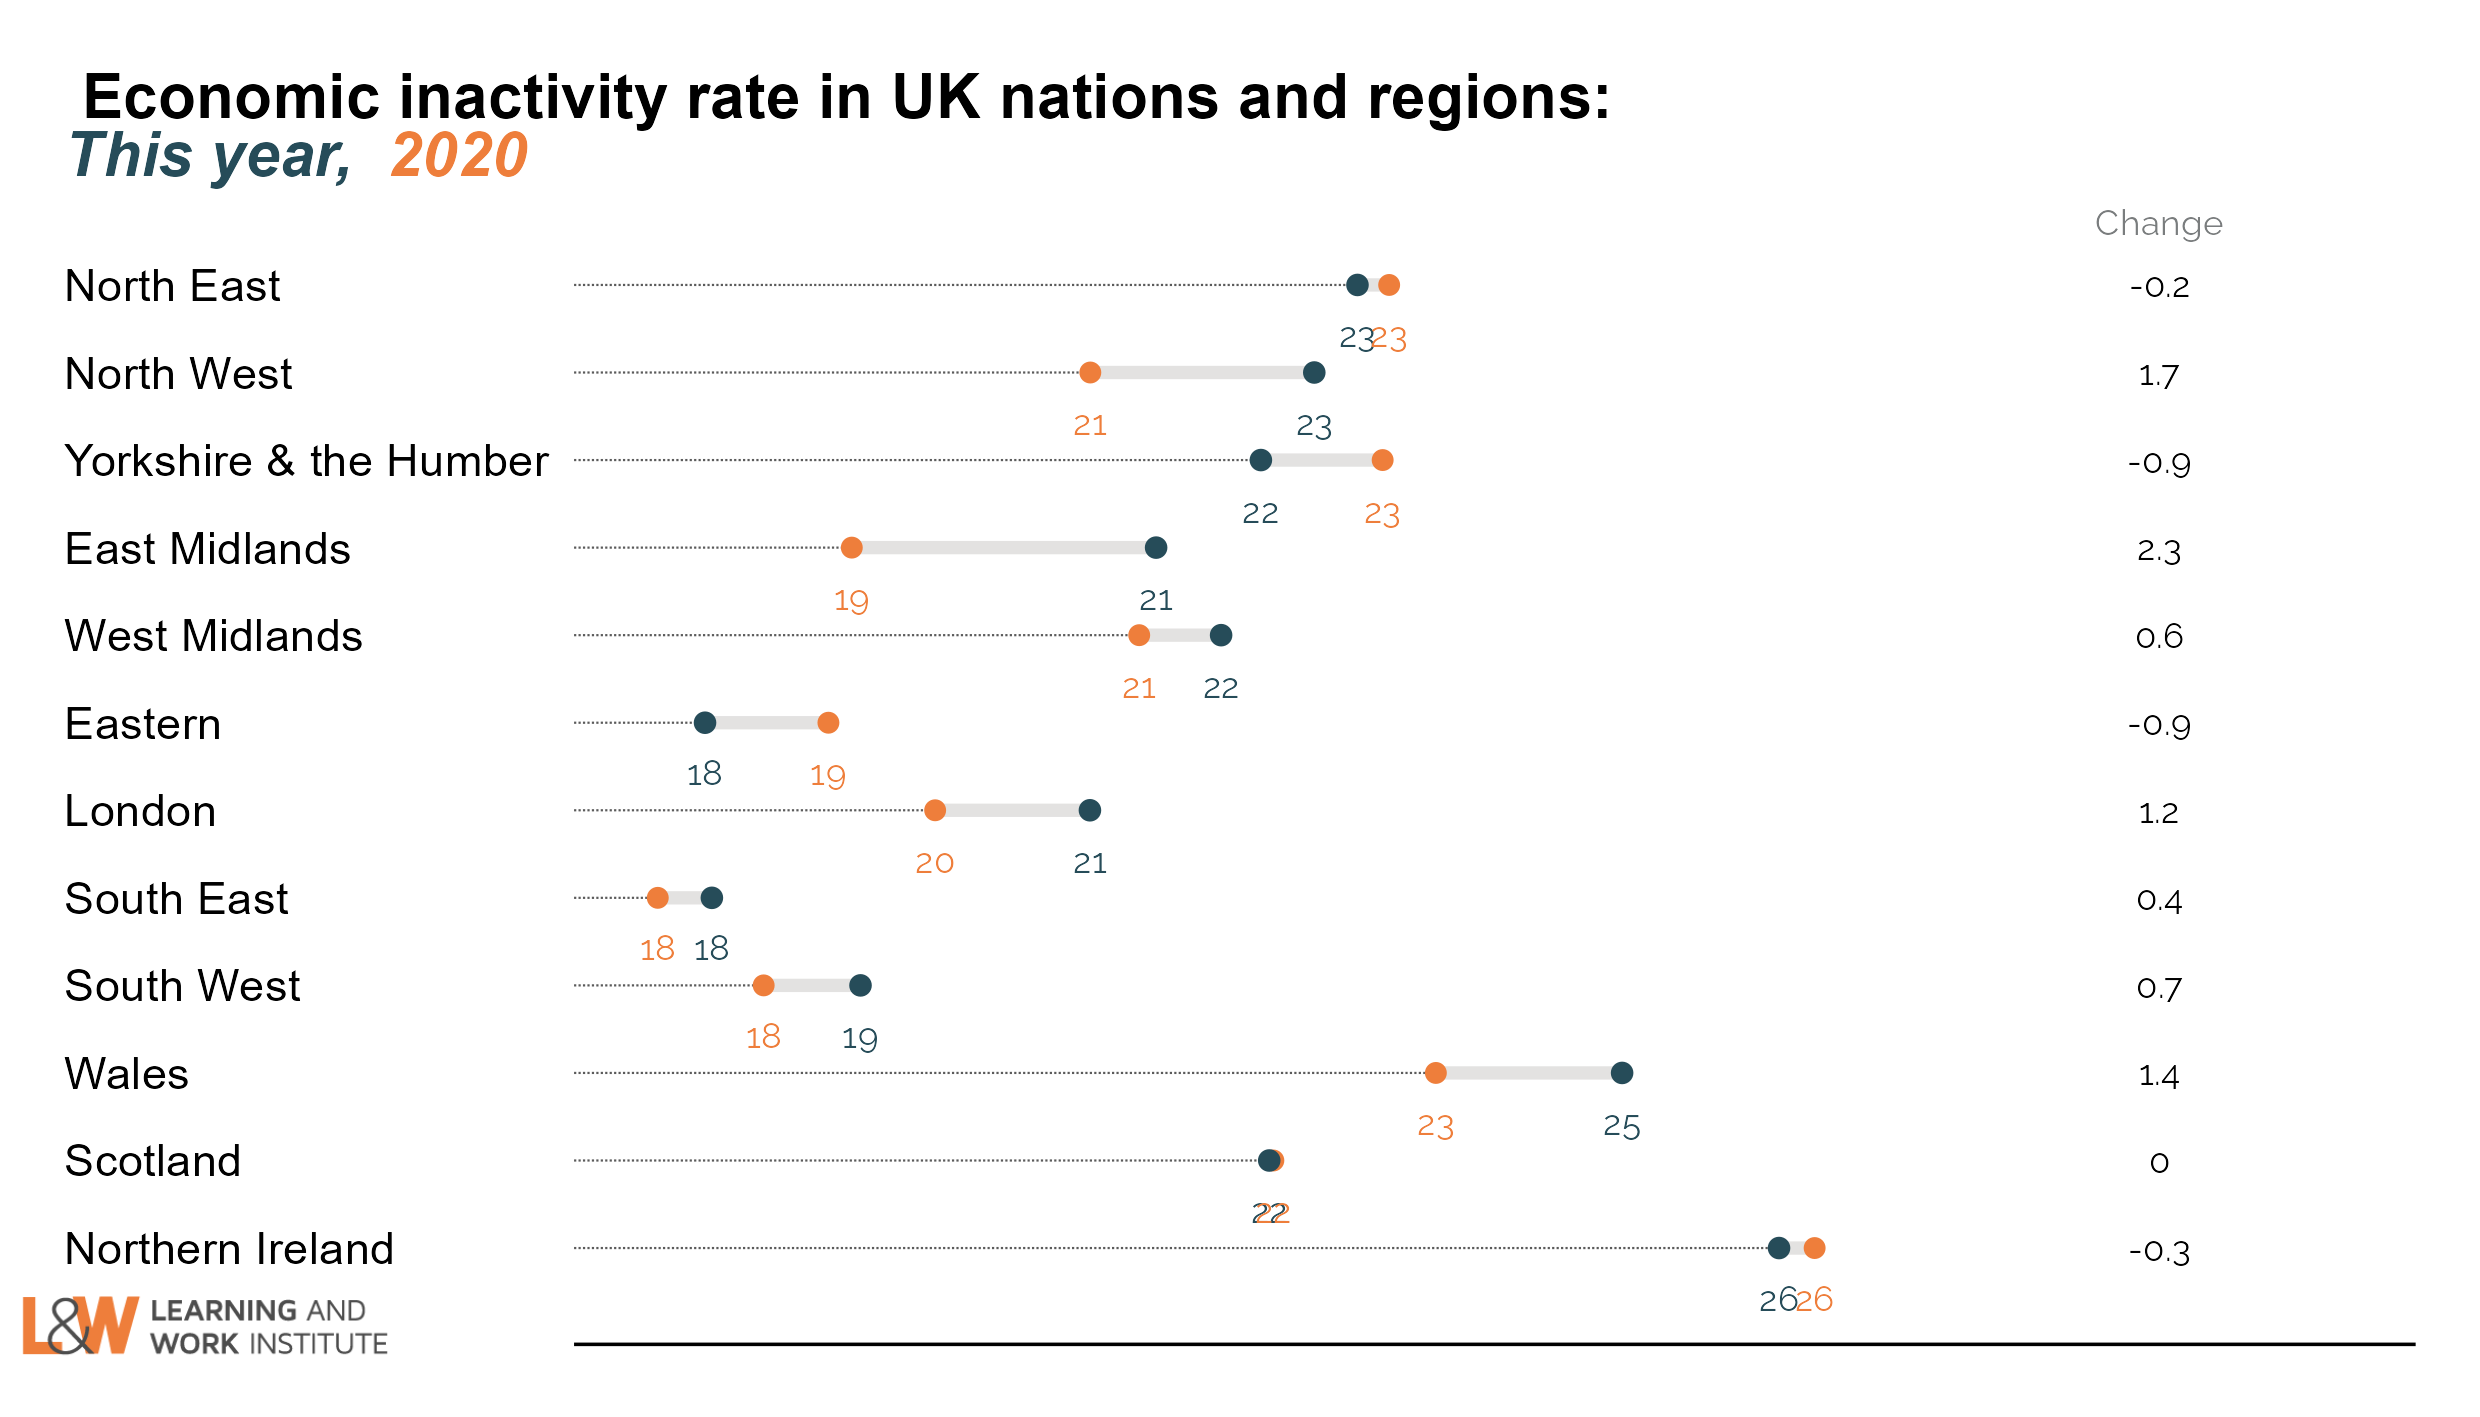 |
|
|
View this email in your browser. This newsletter is produced by Learning and Work Institute and keeps readers up to date on a wide range of learning and work issues. |
|