 |
|
| Making learning and work count Labour market LIVE from Learning and Work Institute 15 February 2022
Learning and Work Institute comment |
|
| Chart 1: UK unemployment (ILO) The latest unemployment rate was down by 0.2 percentage points in the quarter to 4.1%. 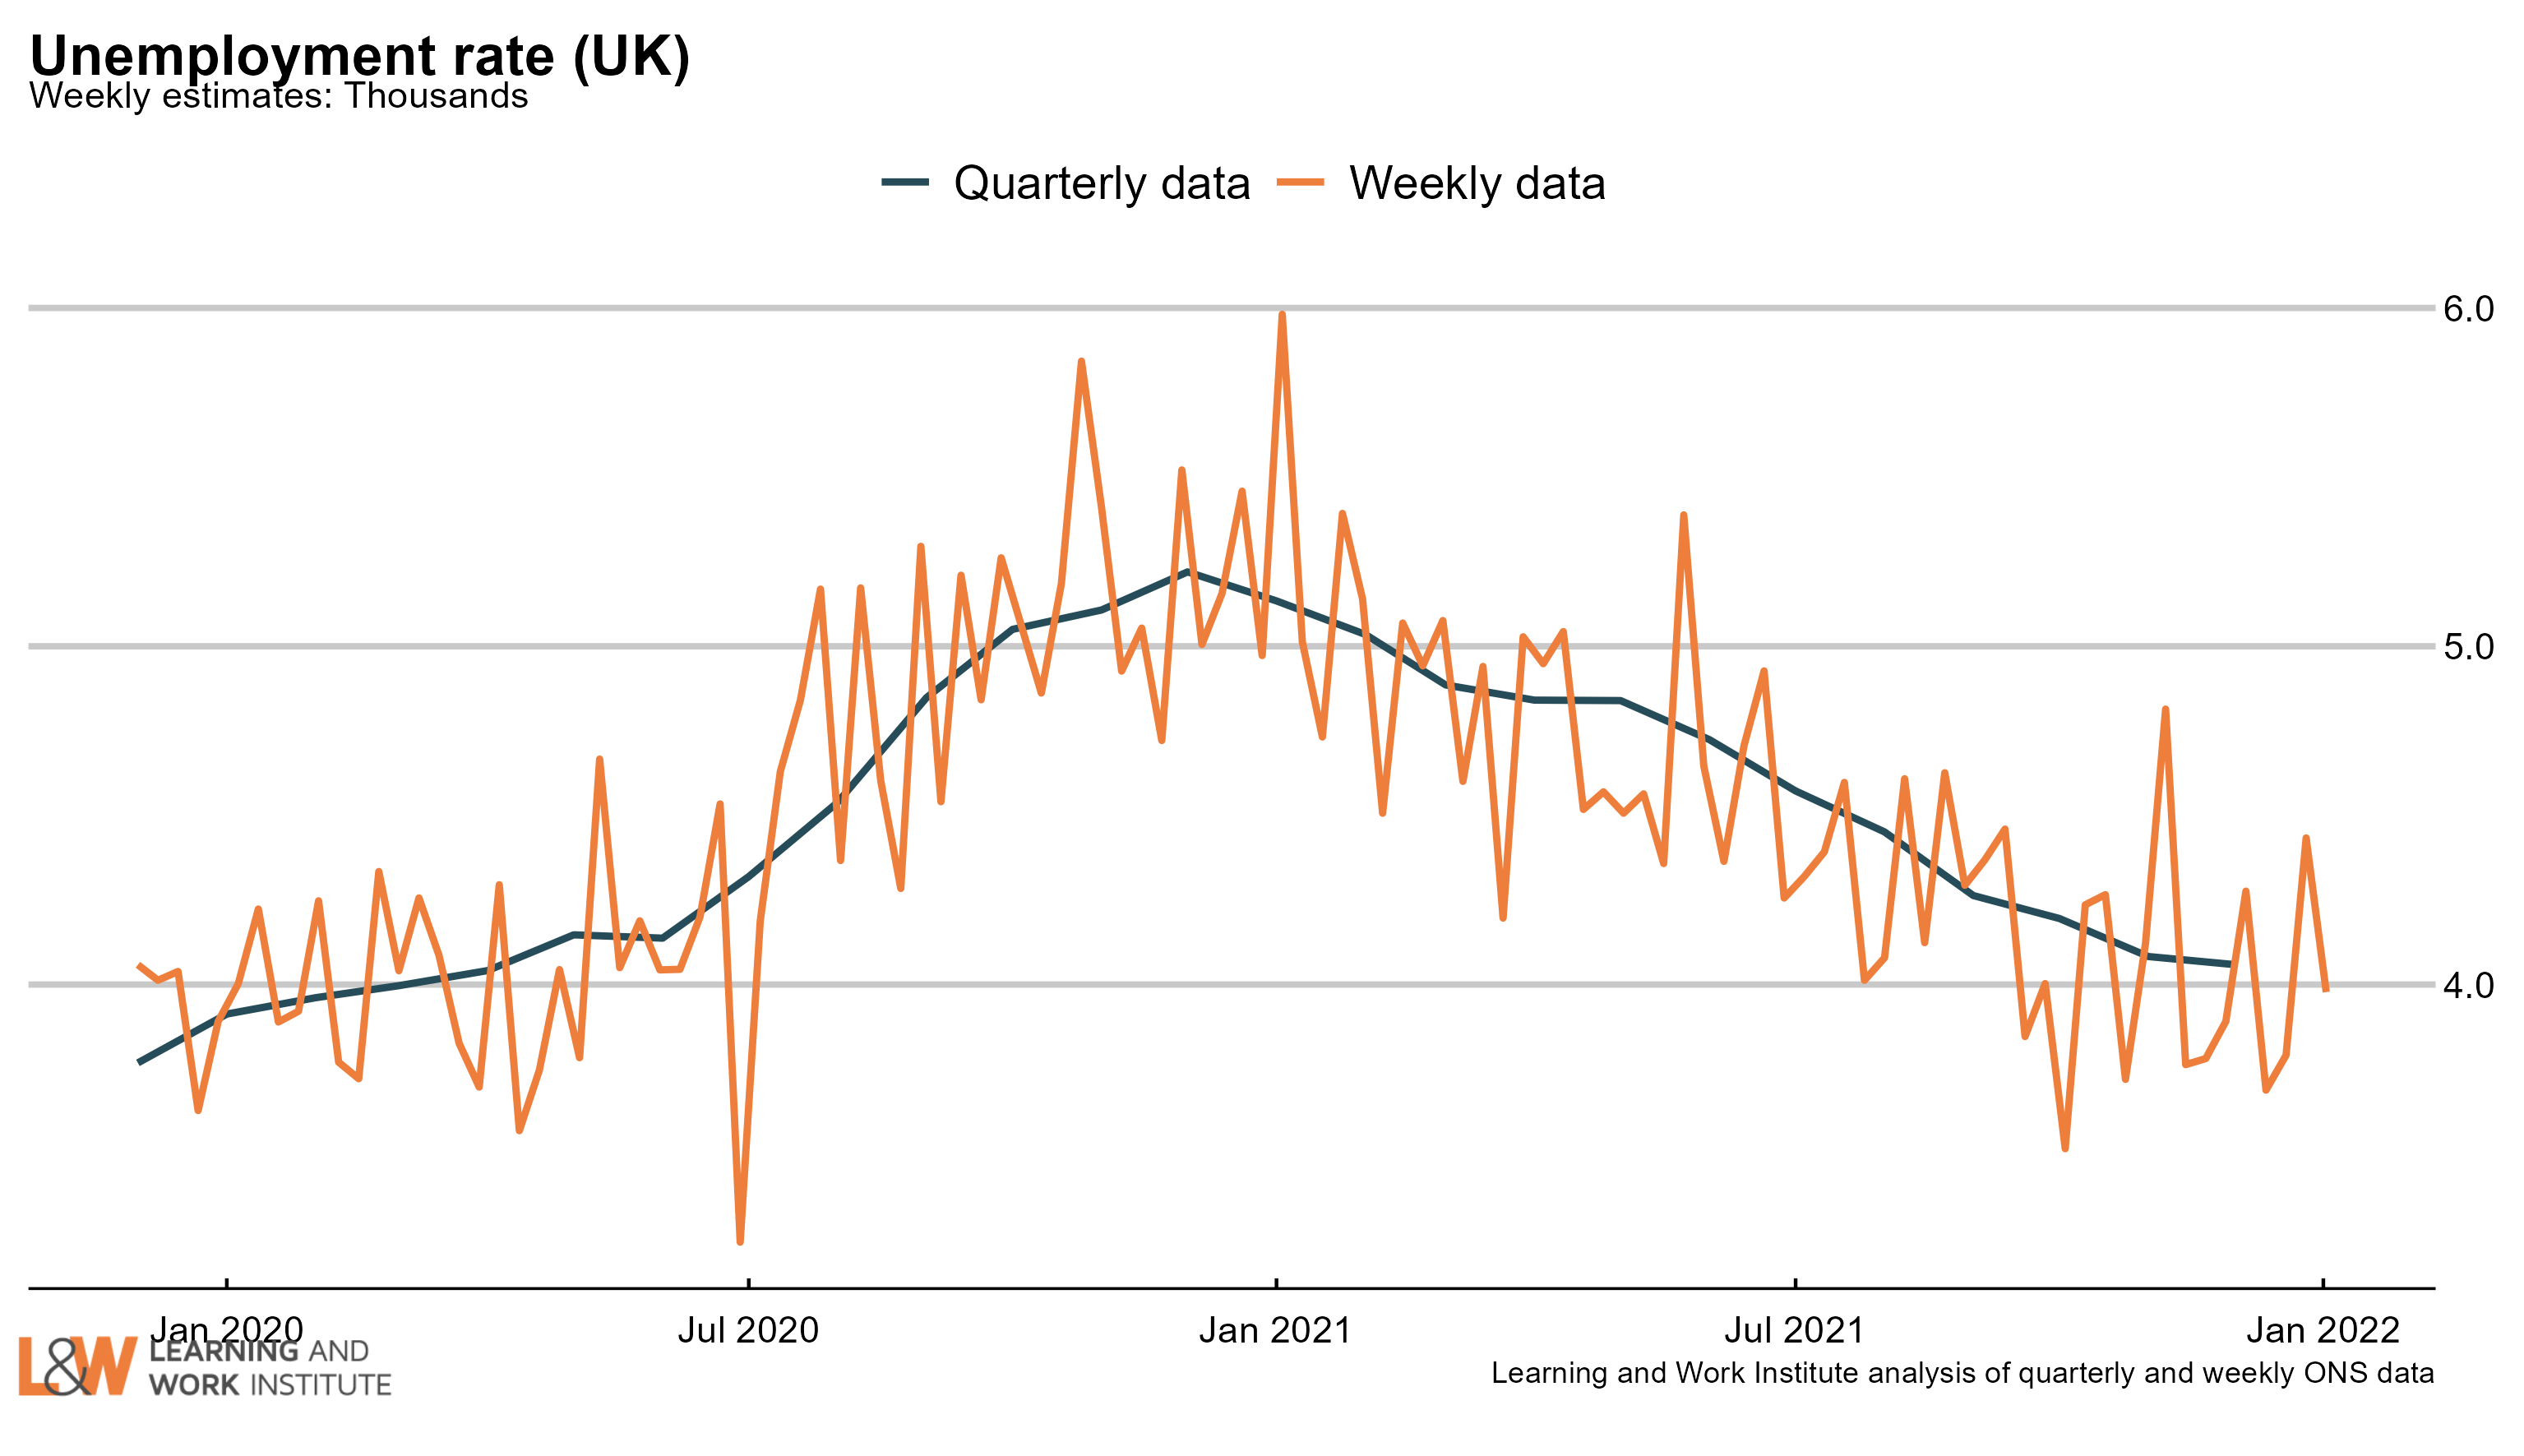 |
|
| Chart 2: The claimant count and UK unemployment compared The number of unemployed people who are claiming unemployment-related benefits is still 466,500 higher than the number of unemployed in the official measure, though the gap is closing. 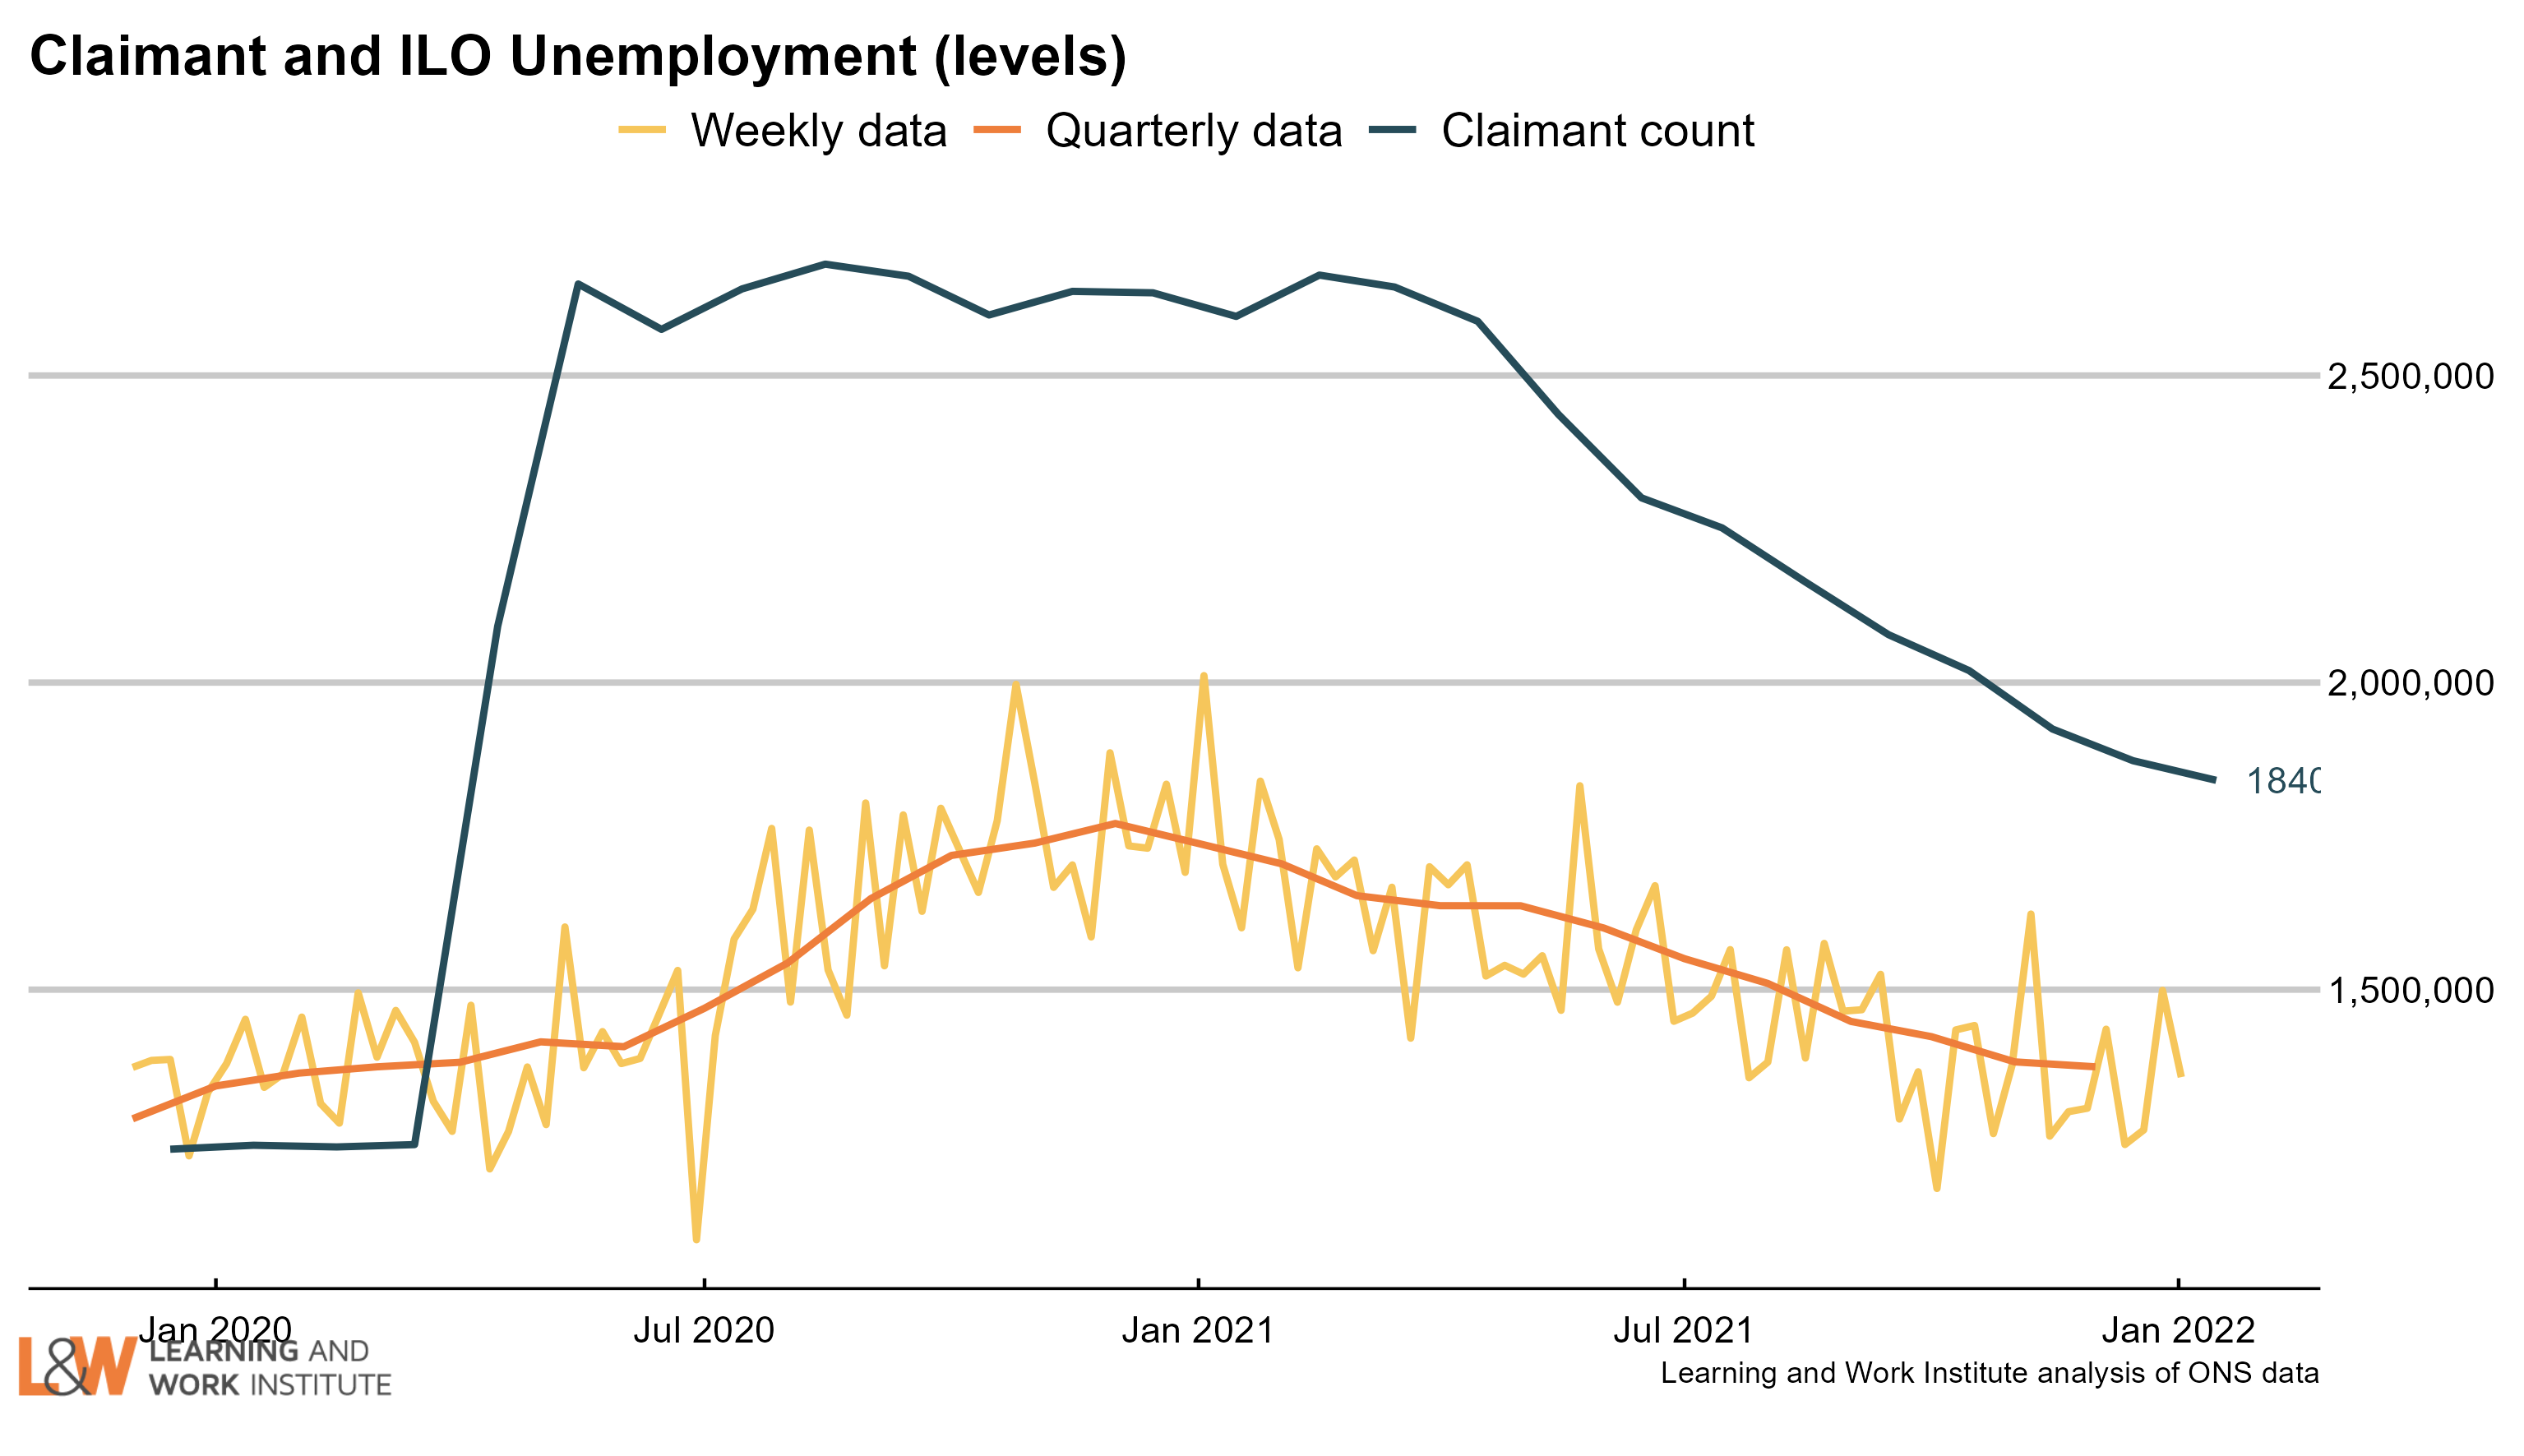 |
|
| Chart 3: Youth unemployment The number of unemployed young people is up by 12,000 since last month’s figures, to 465,000. Meanwhile, the number of young Universal Credit or Jobseeker’s Allowance claimants is down 8,300 from last month to 299,700. 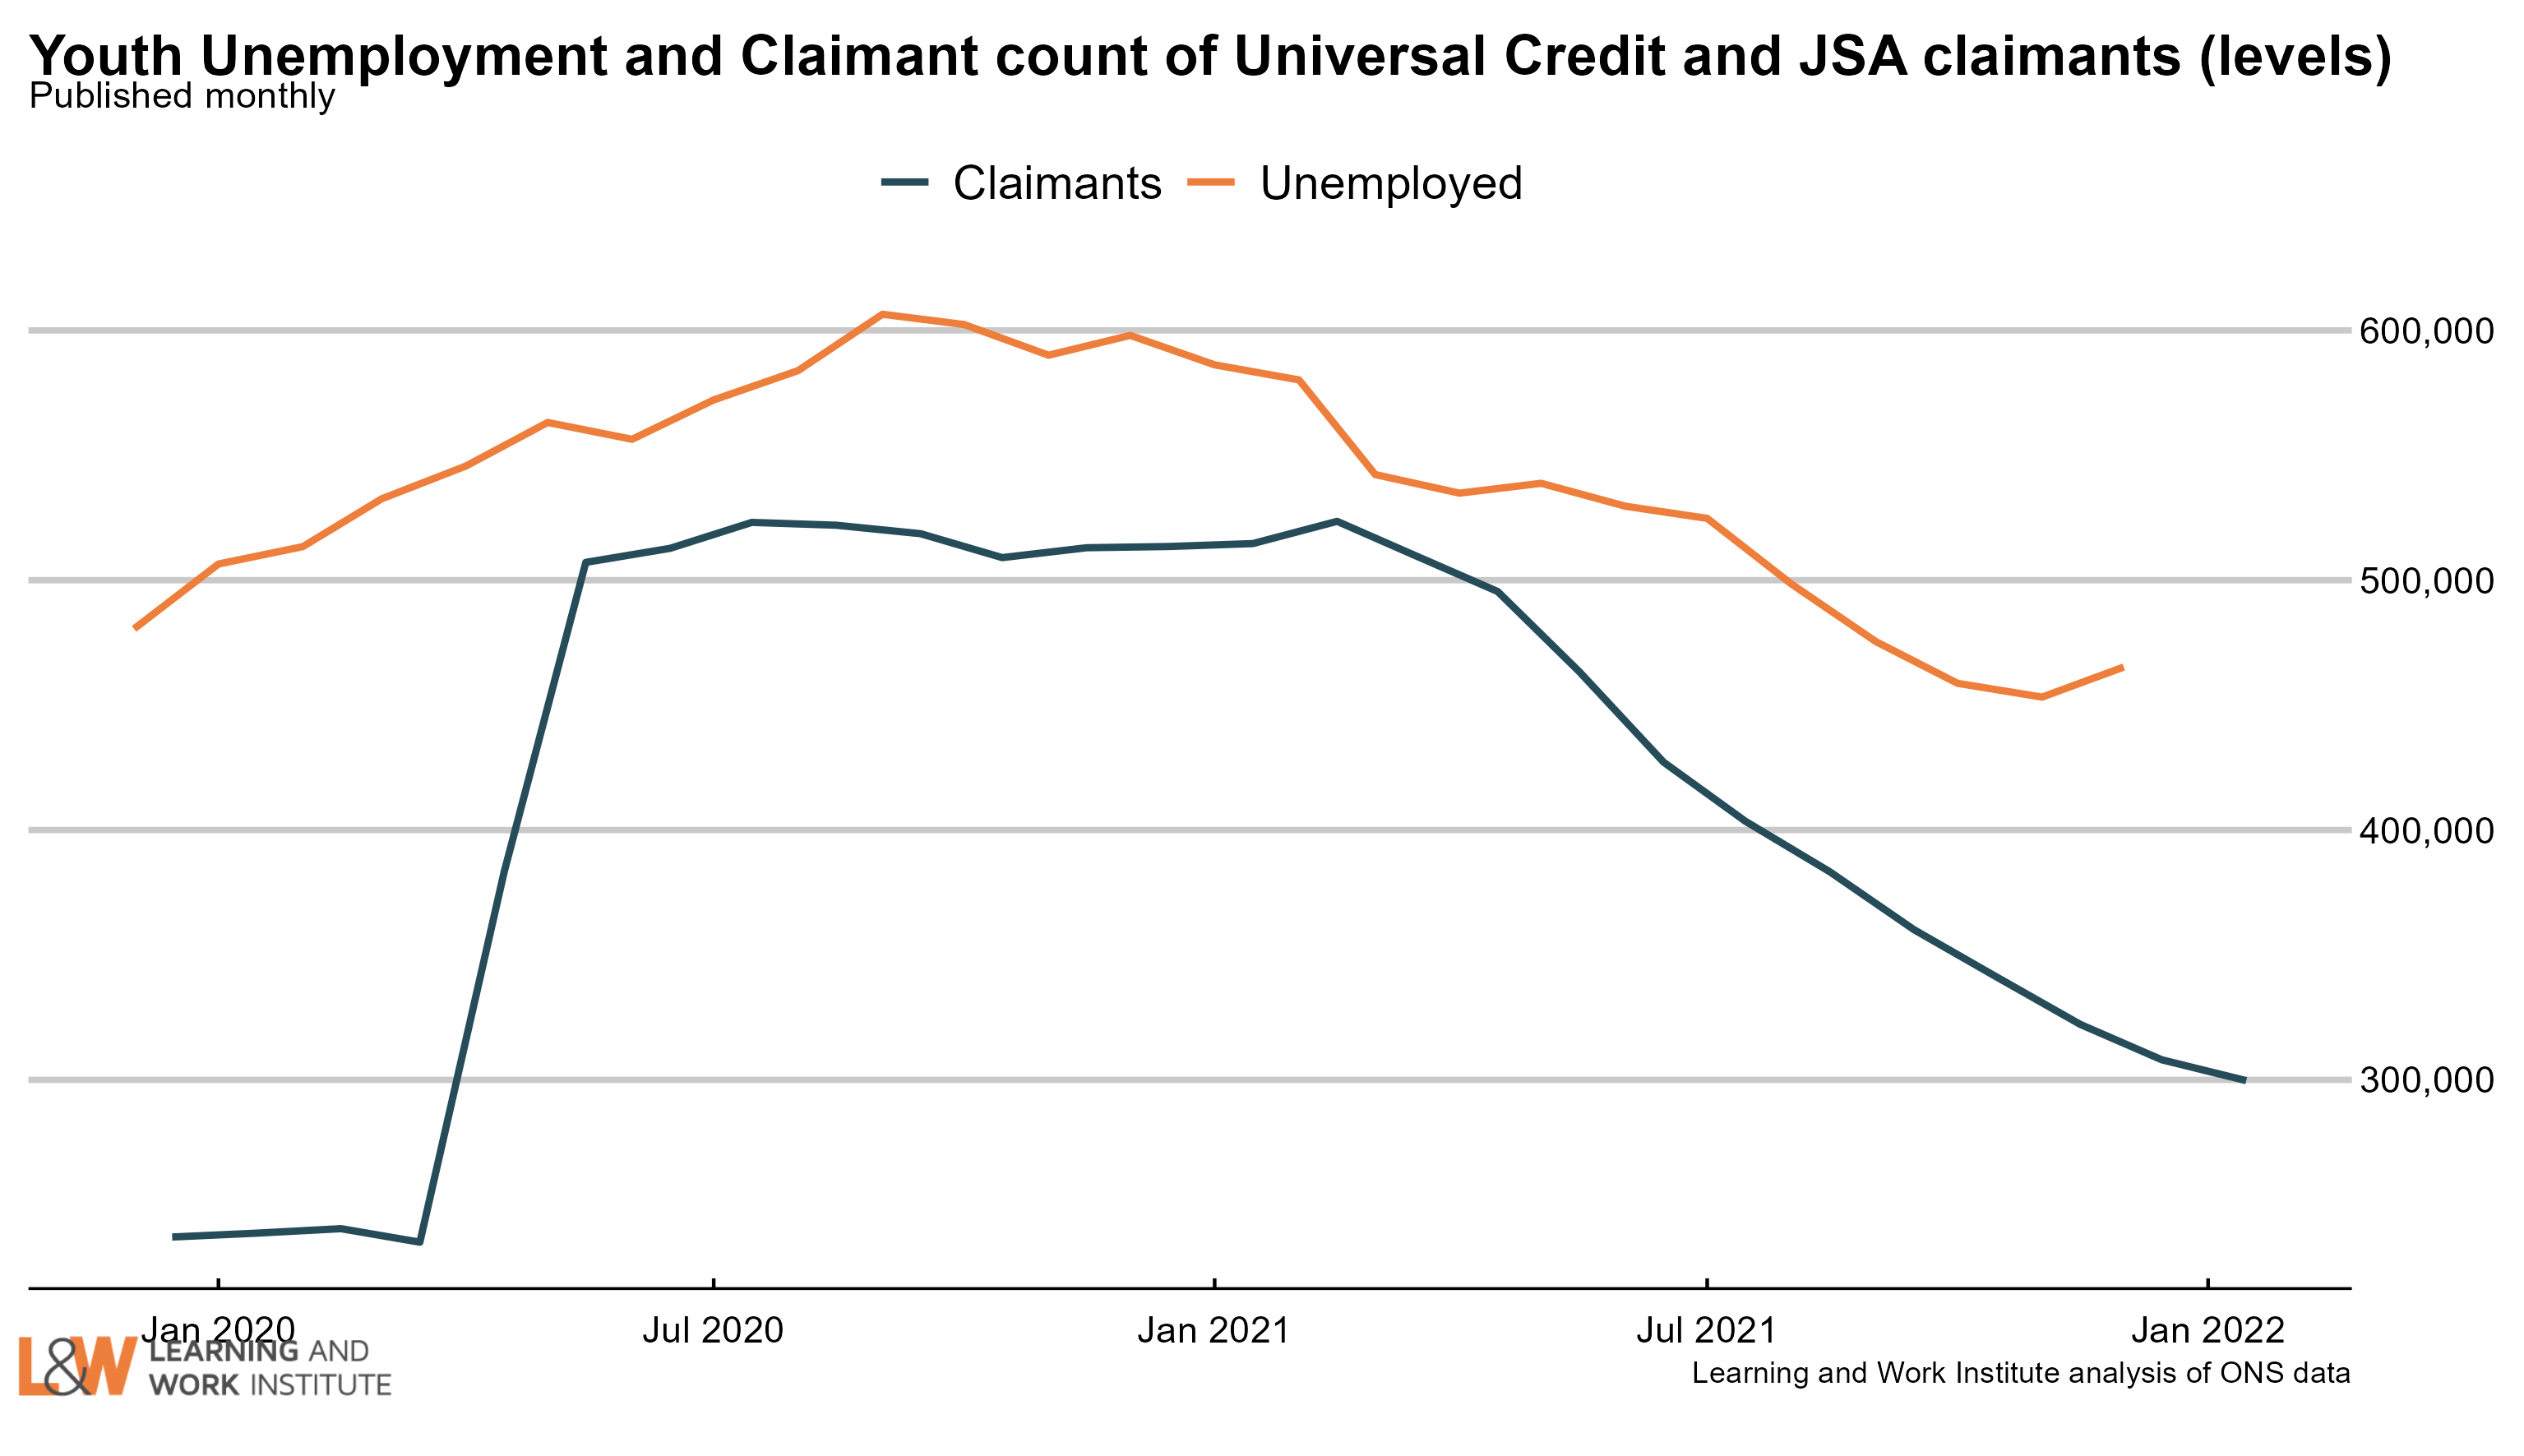 |
|
| Chart 4: Young people not in employment, full-time education or training The number of out of work young people who are not in full-time education (908,000) is up by 27,000 in the last quarter, or 3.1%. The rise was largely among the inactive, with the number of unemployed young people not in full-time education or training falling 3,000 in the quarter. 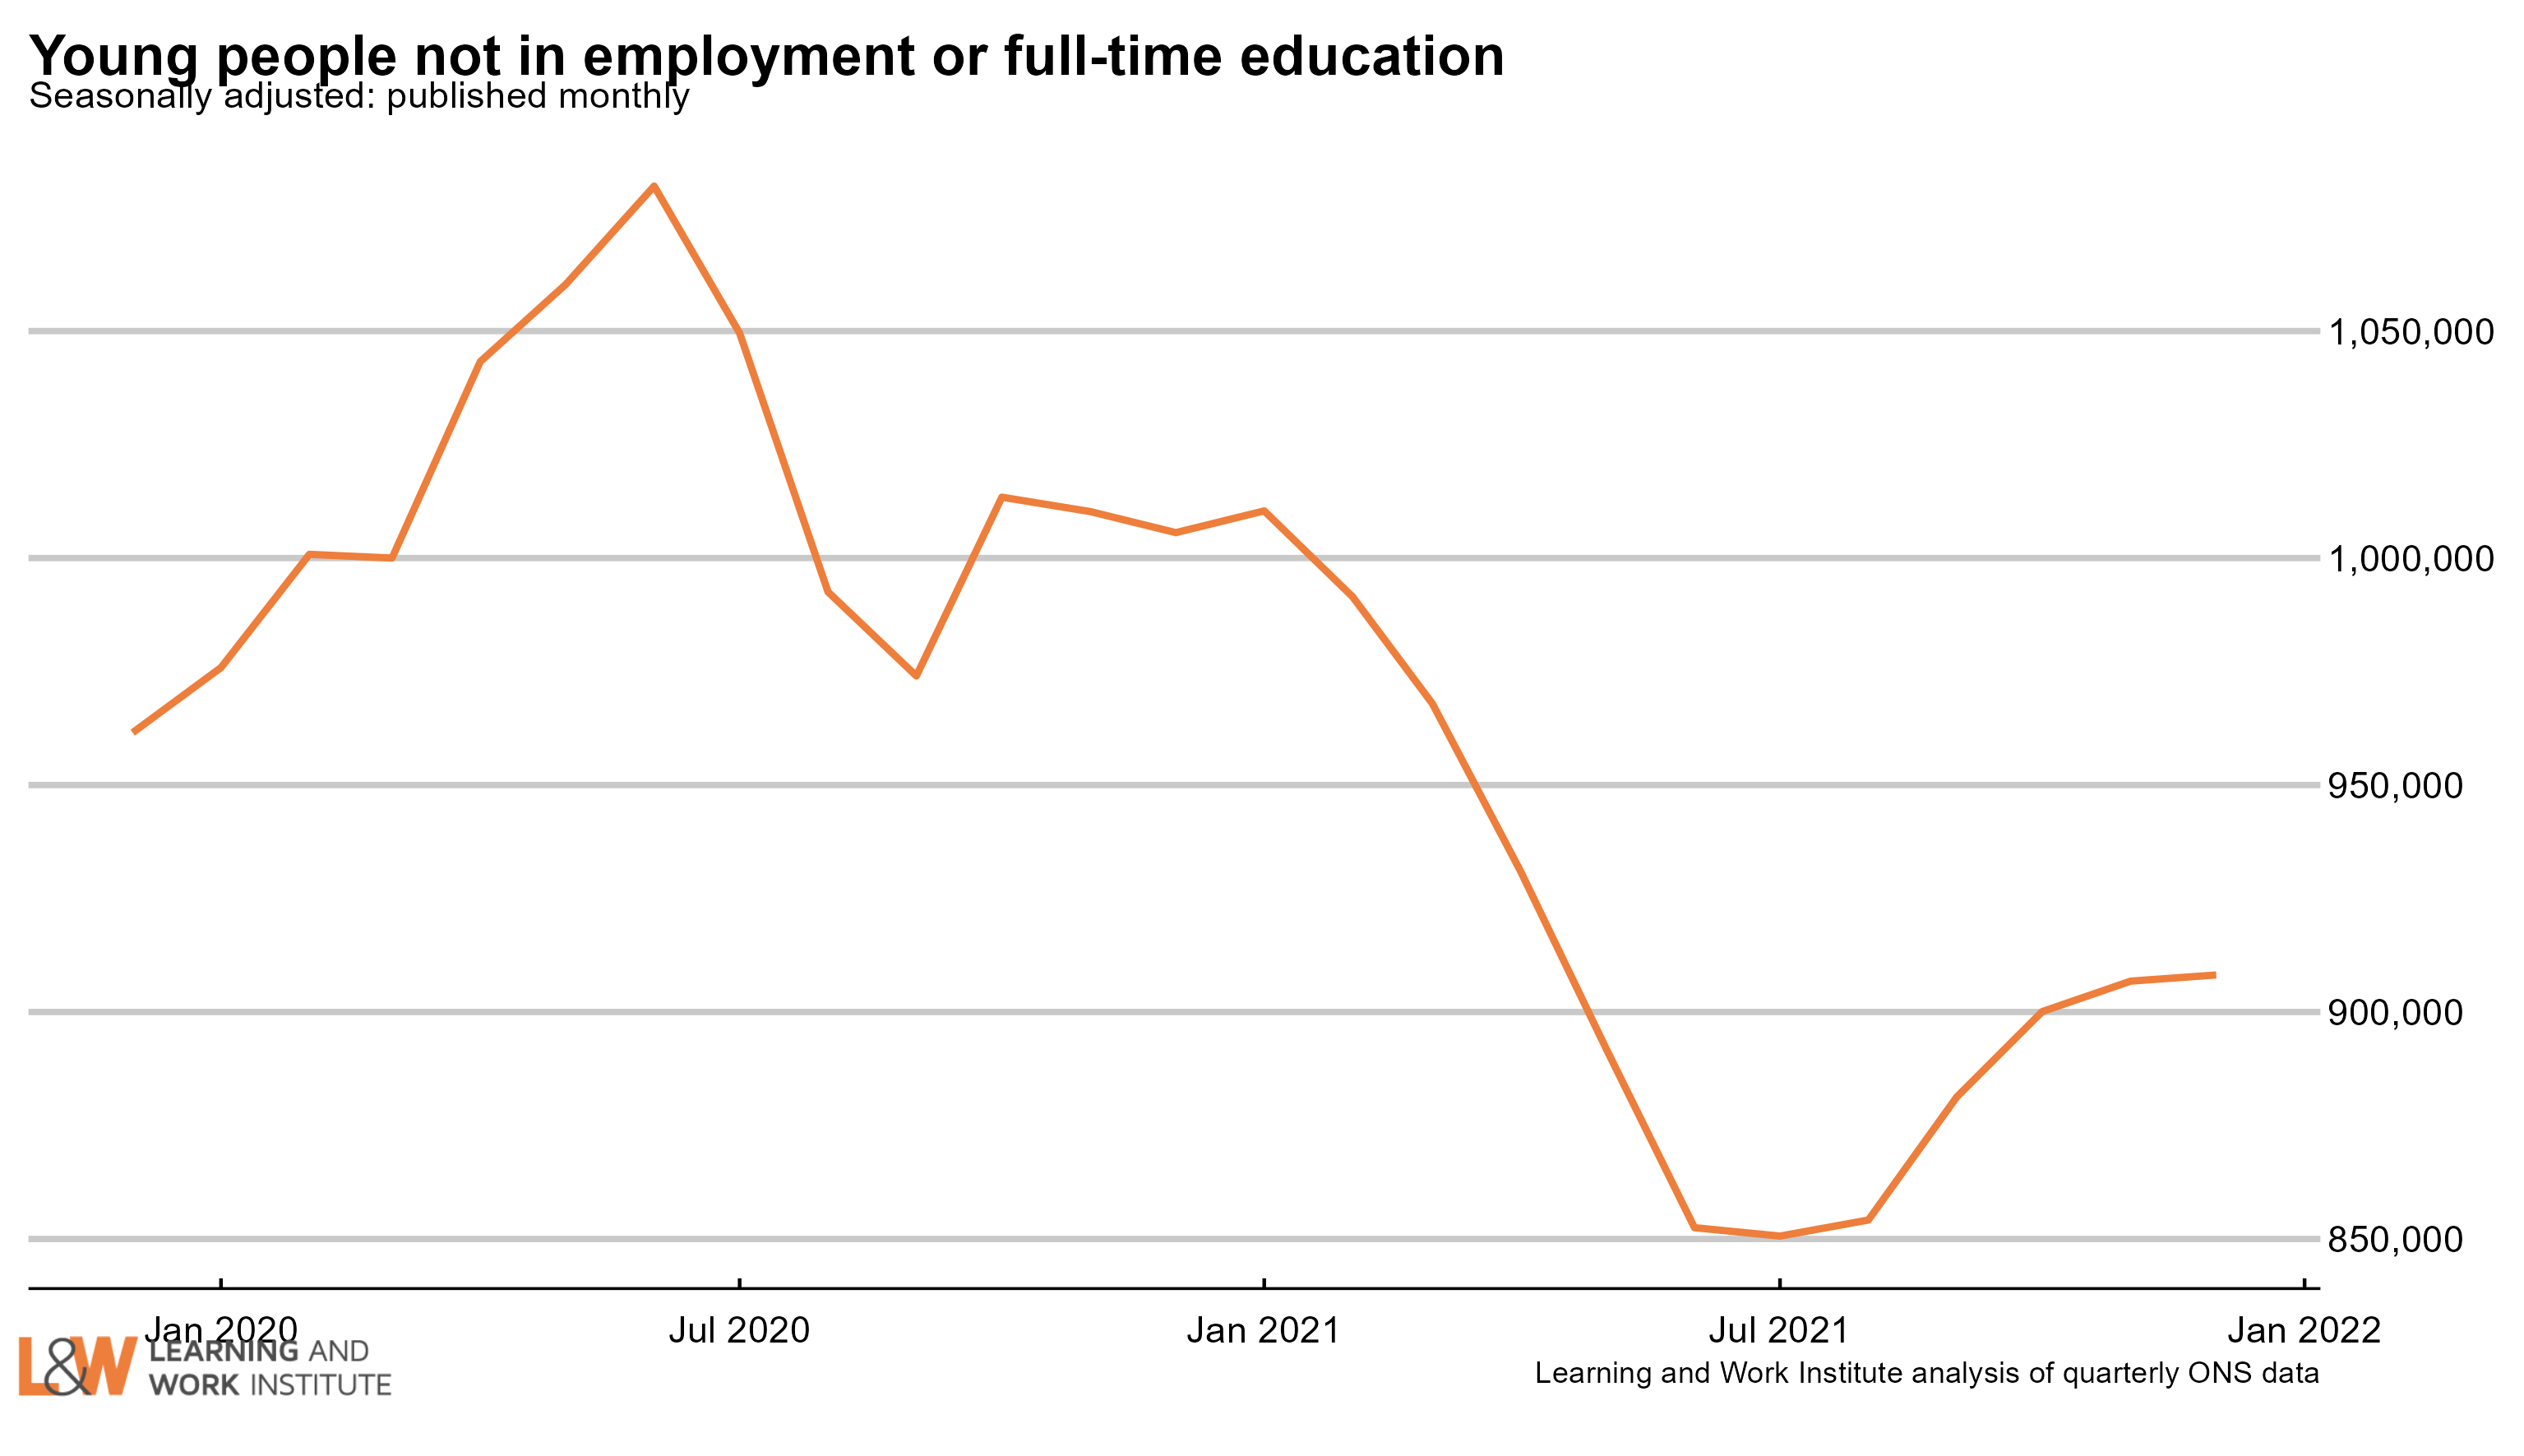 |
|
| Chart 5: Youth long-term unemployment (six months and over, 16-24) Youth long-term unemployment (which can include students) is down by 14,000 over the last quarter and is now 149,000. 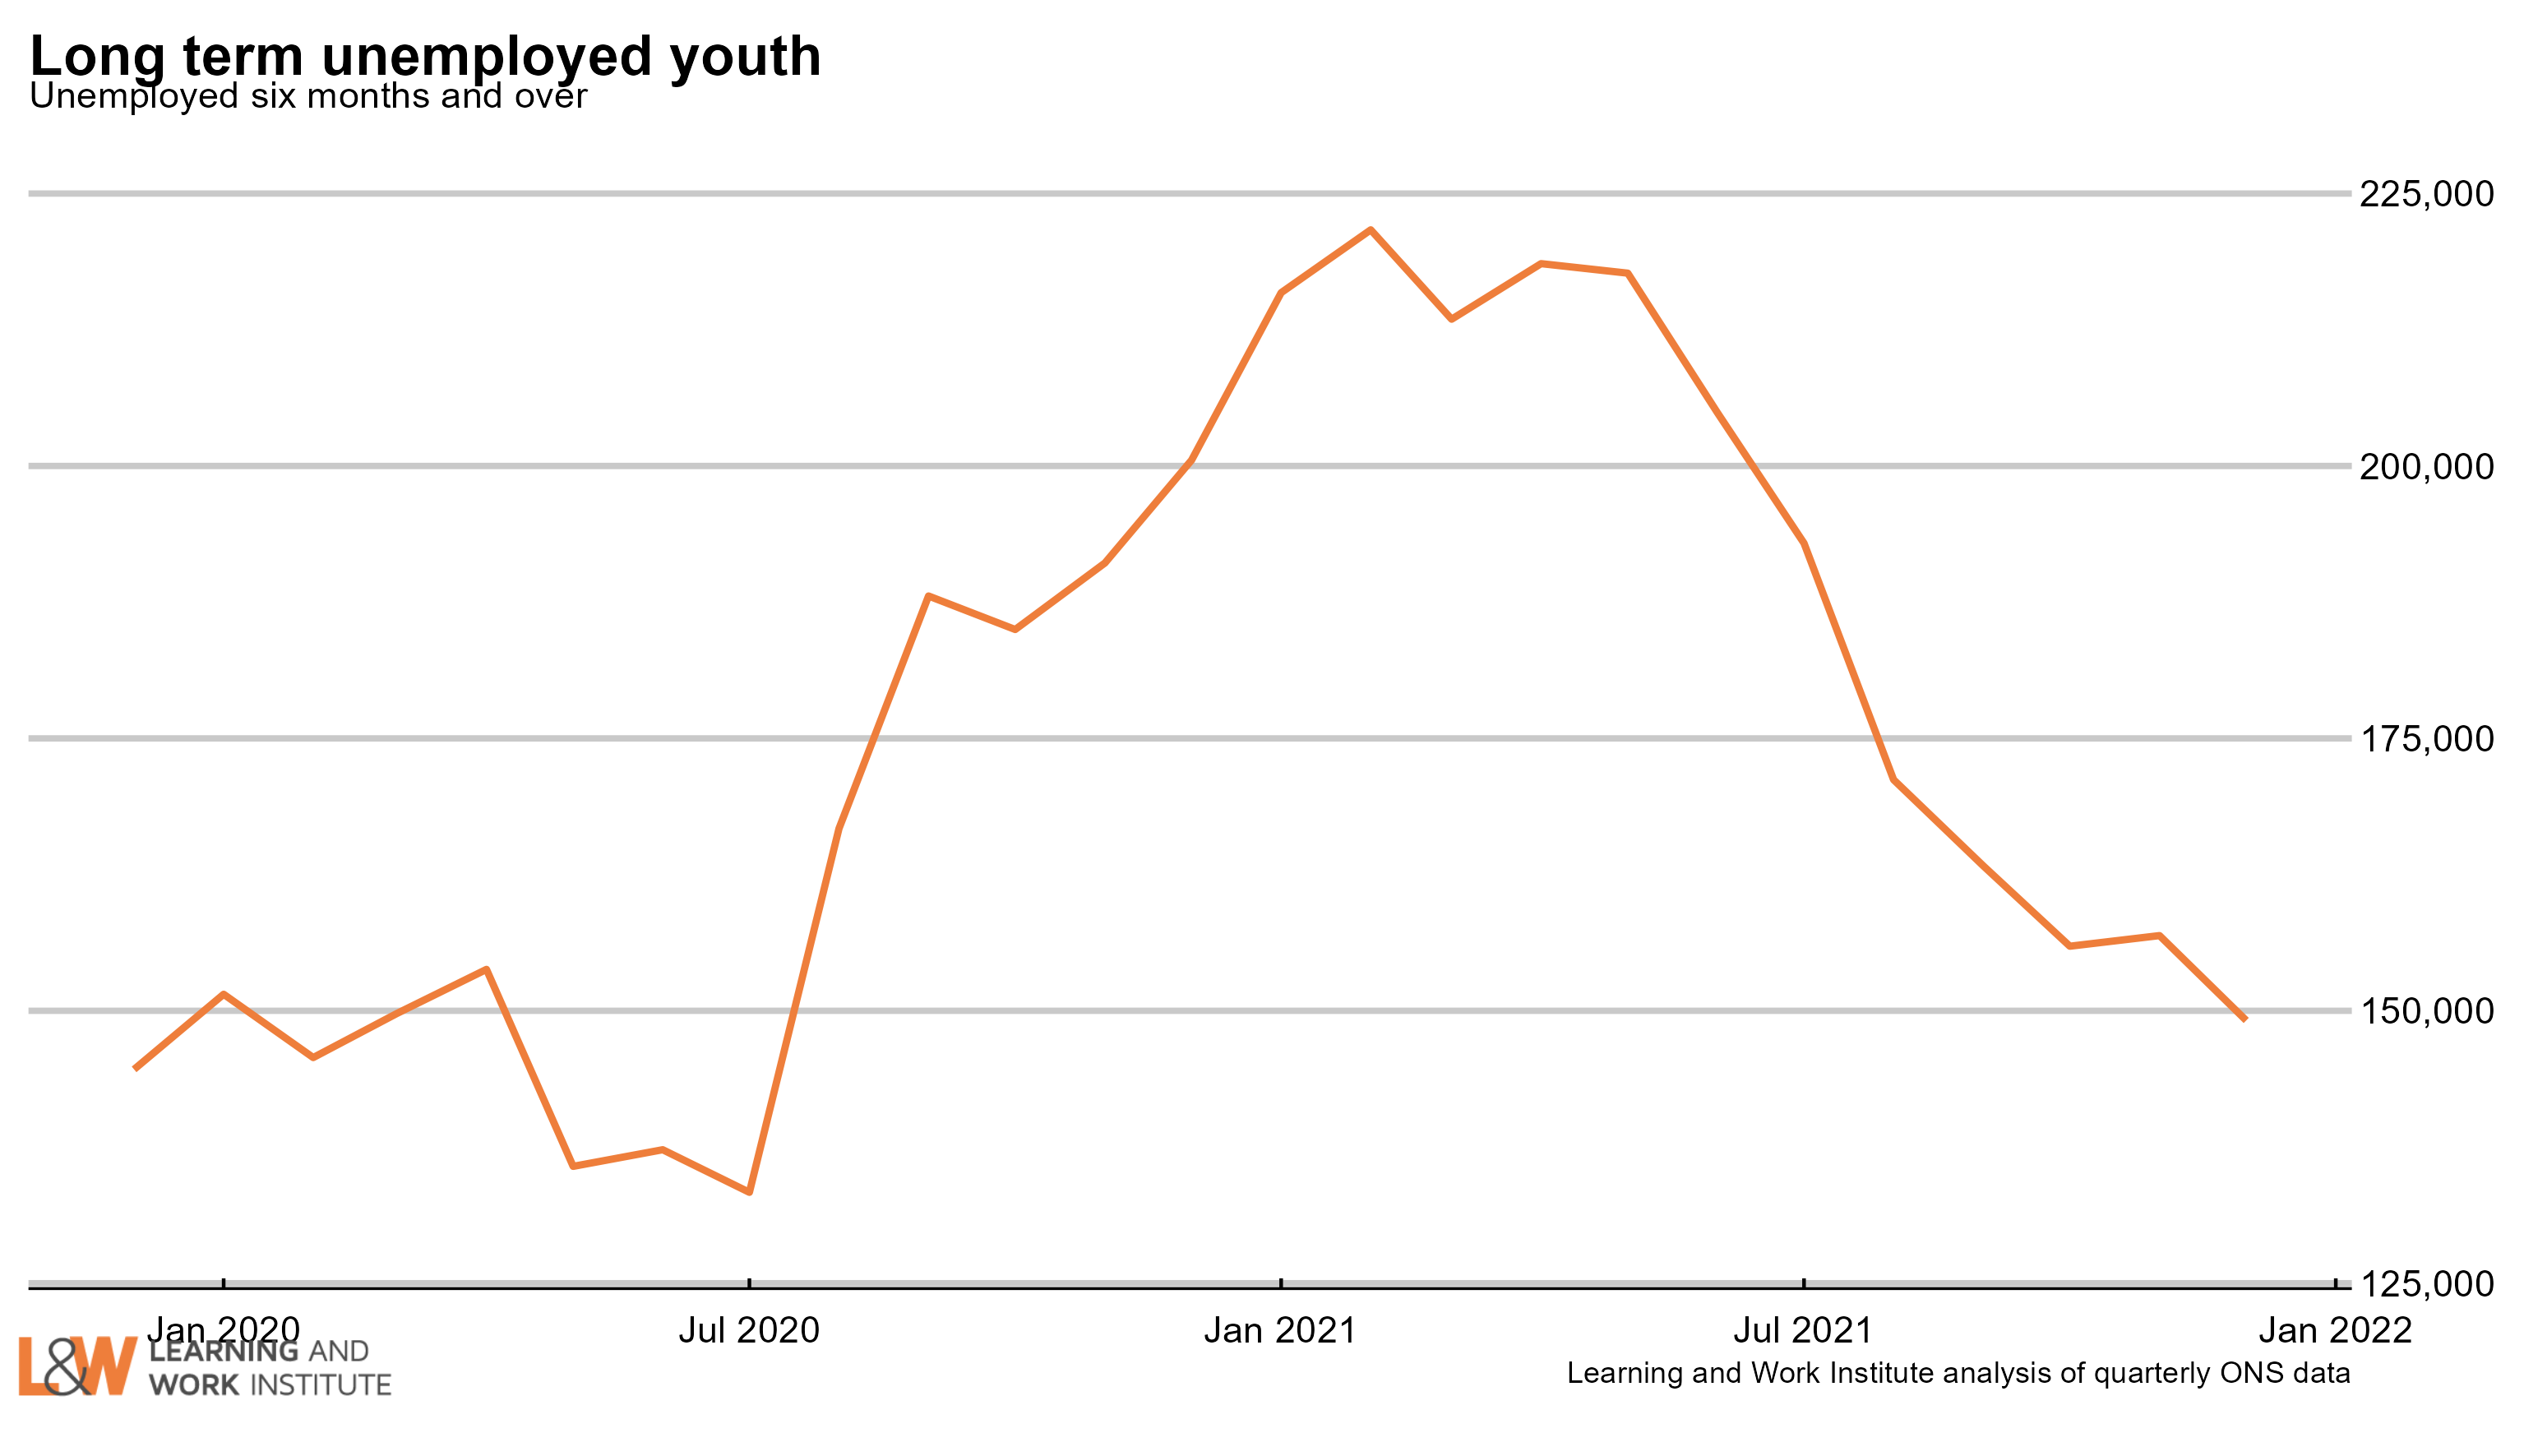 |
|
| Chart 6: Adult long-term unemployment (12 months and over, 25+) Adult long-term unemployment on the survey measure is now 322,000. There are 84,000 more people aged 25 and over out of work for 12 months or more than before the pandemic (Dec 19-Feb 20), though this is now falling (either due to people finding work or moving into economic inactivity). 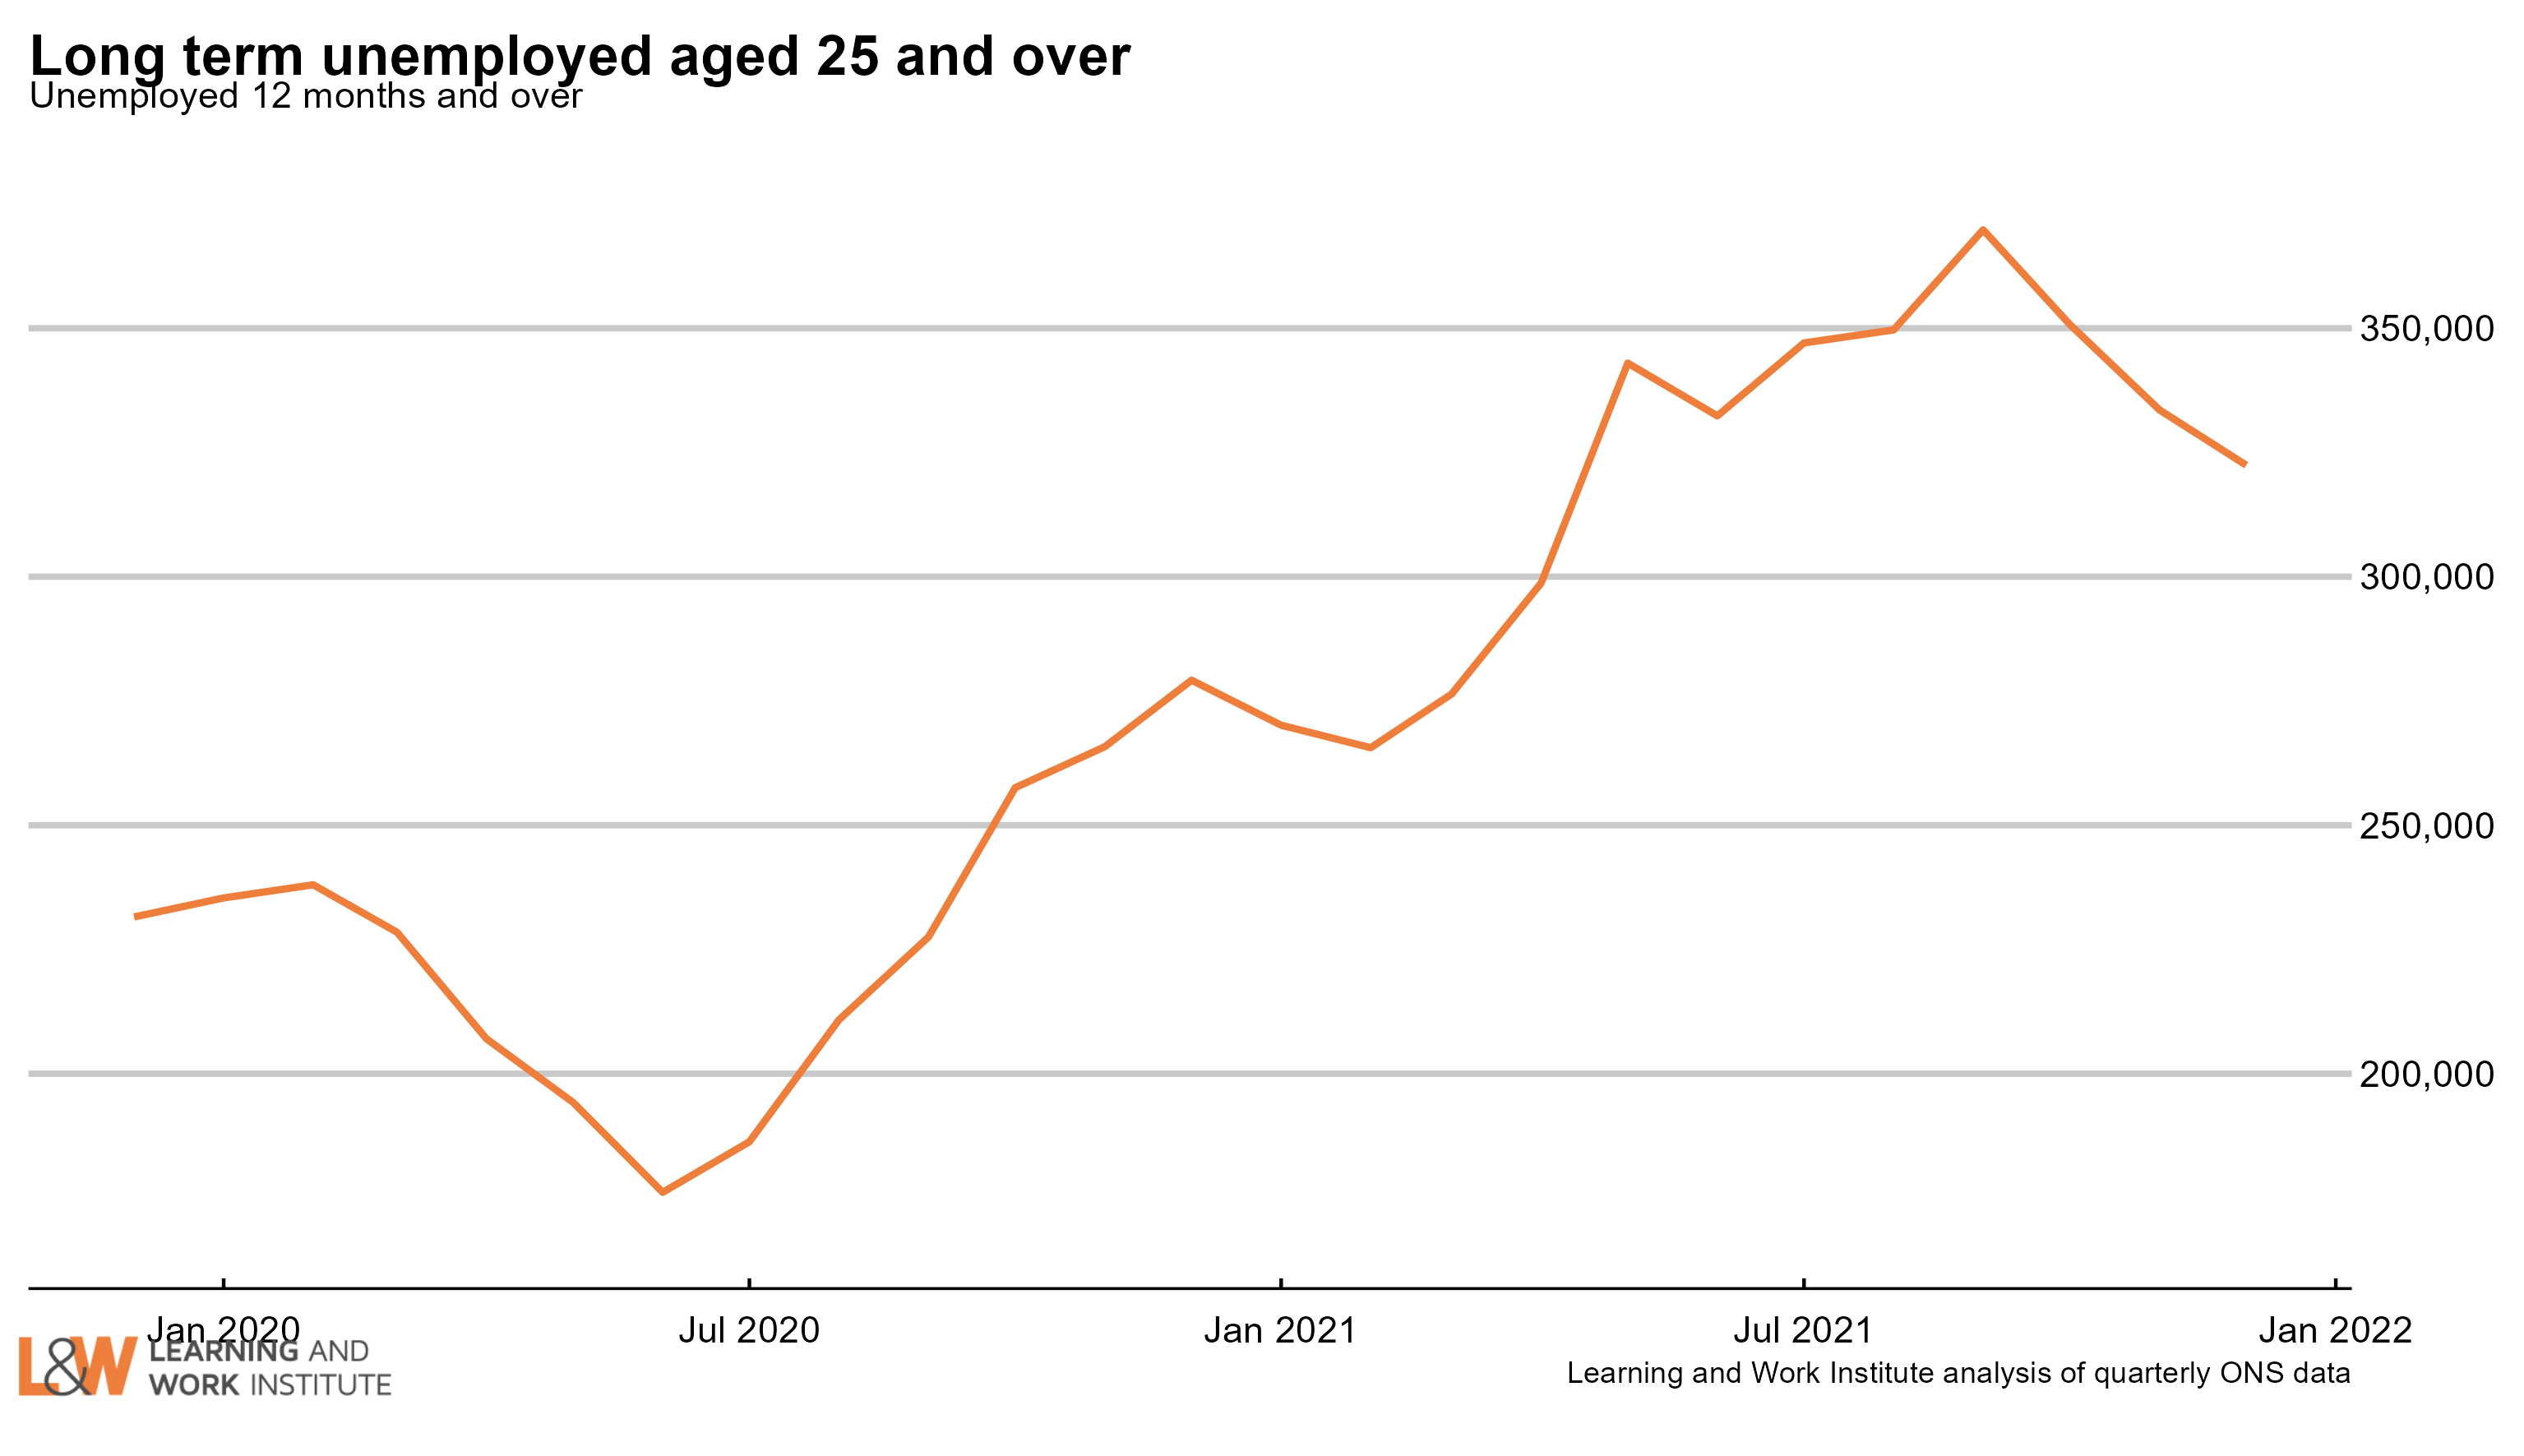 |
|
| Chart 7: Unemployment rates by age The 18 to 24 year old unemployment rate (including students) is 10.1% of the economically active – excluding one million economically inactive students from the calculation. The rate for those aged 25 to 49 is 3.1%. For those aged 50 and over it is 3.0%. The quarterly change is down 0.3 percentage points for 18 to 24 year olds, down 0.1 points for 25 to 49 year olds, and down 0.3 points for the over-50s. 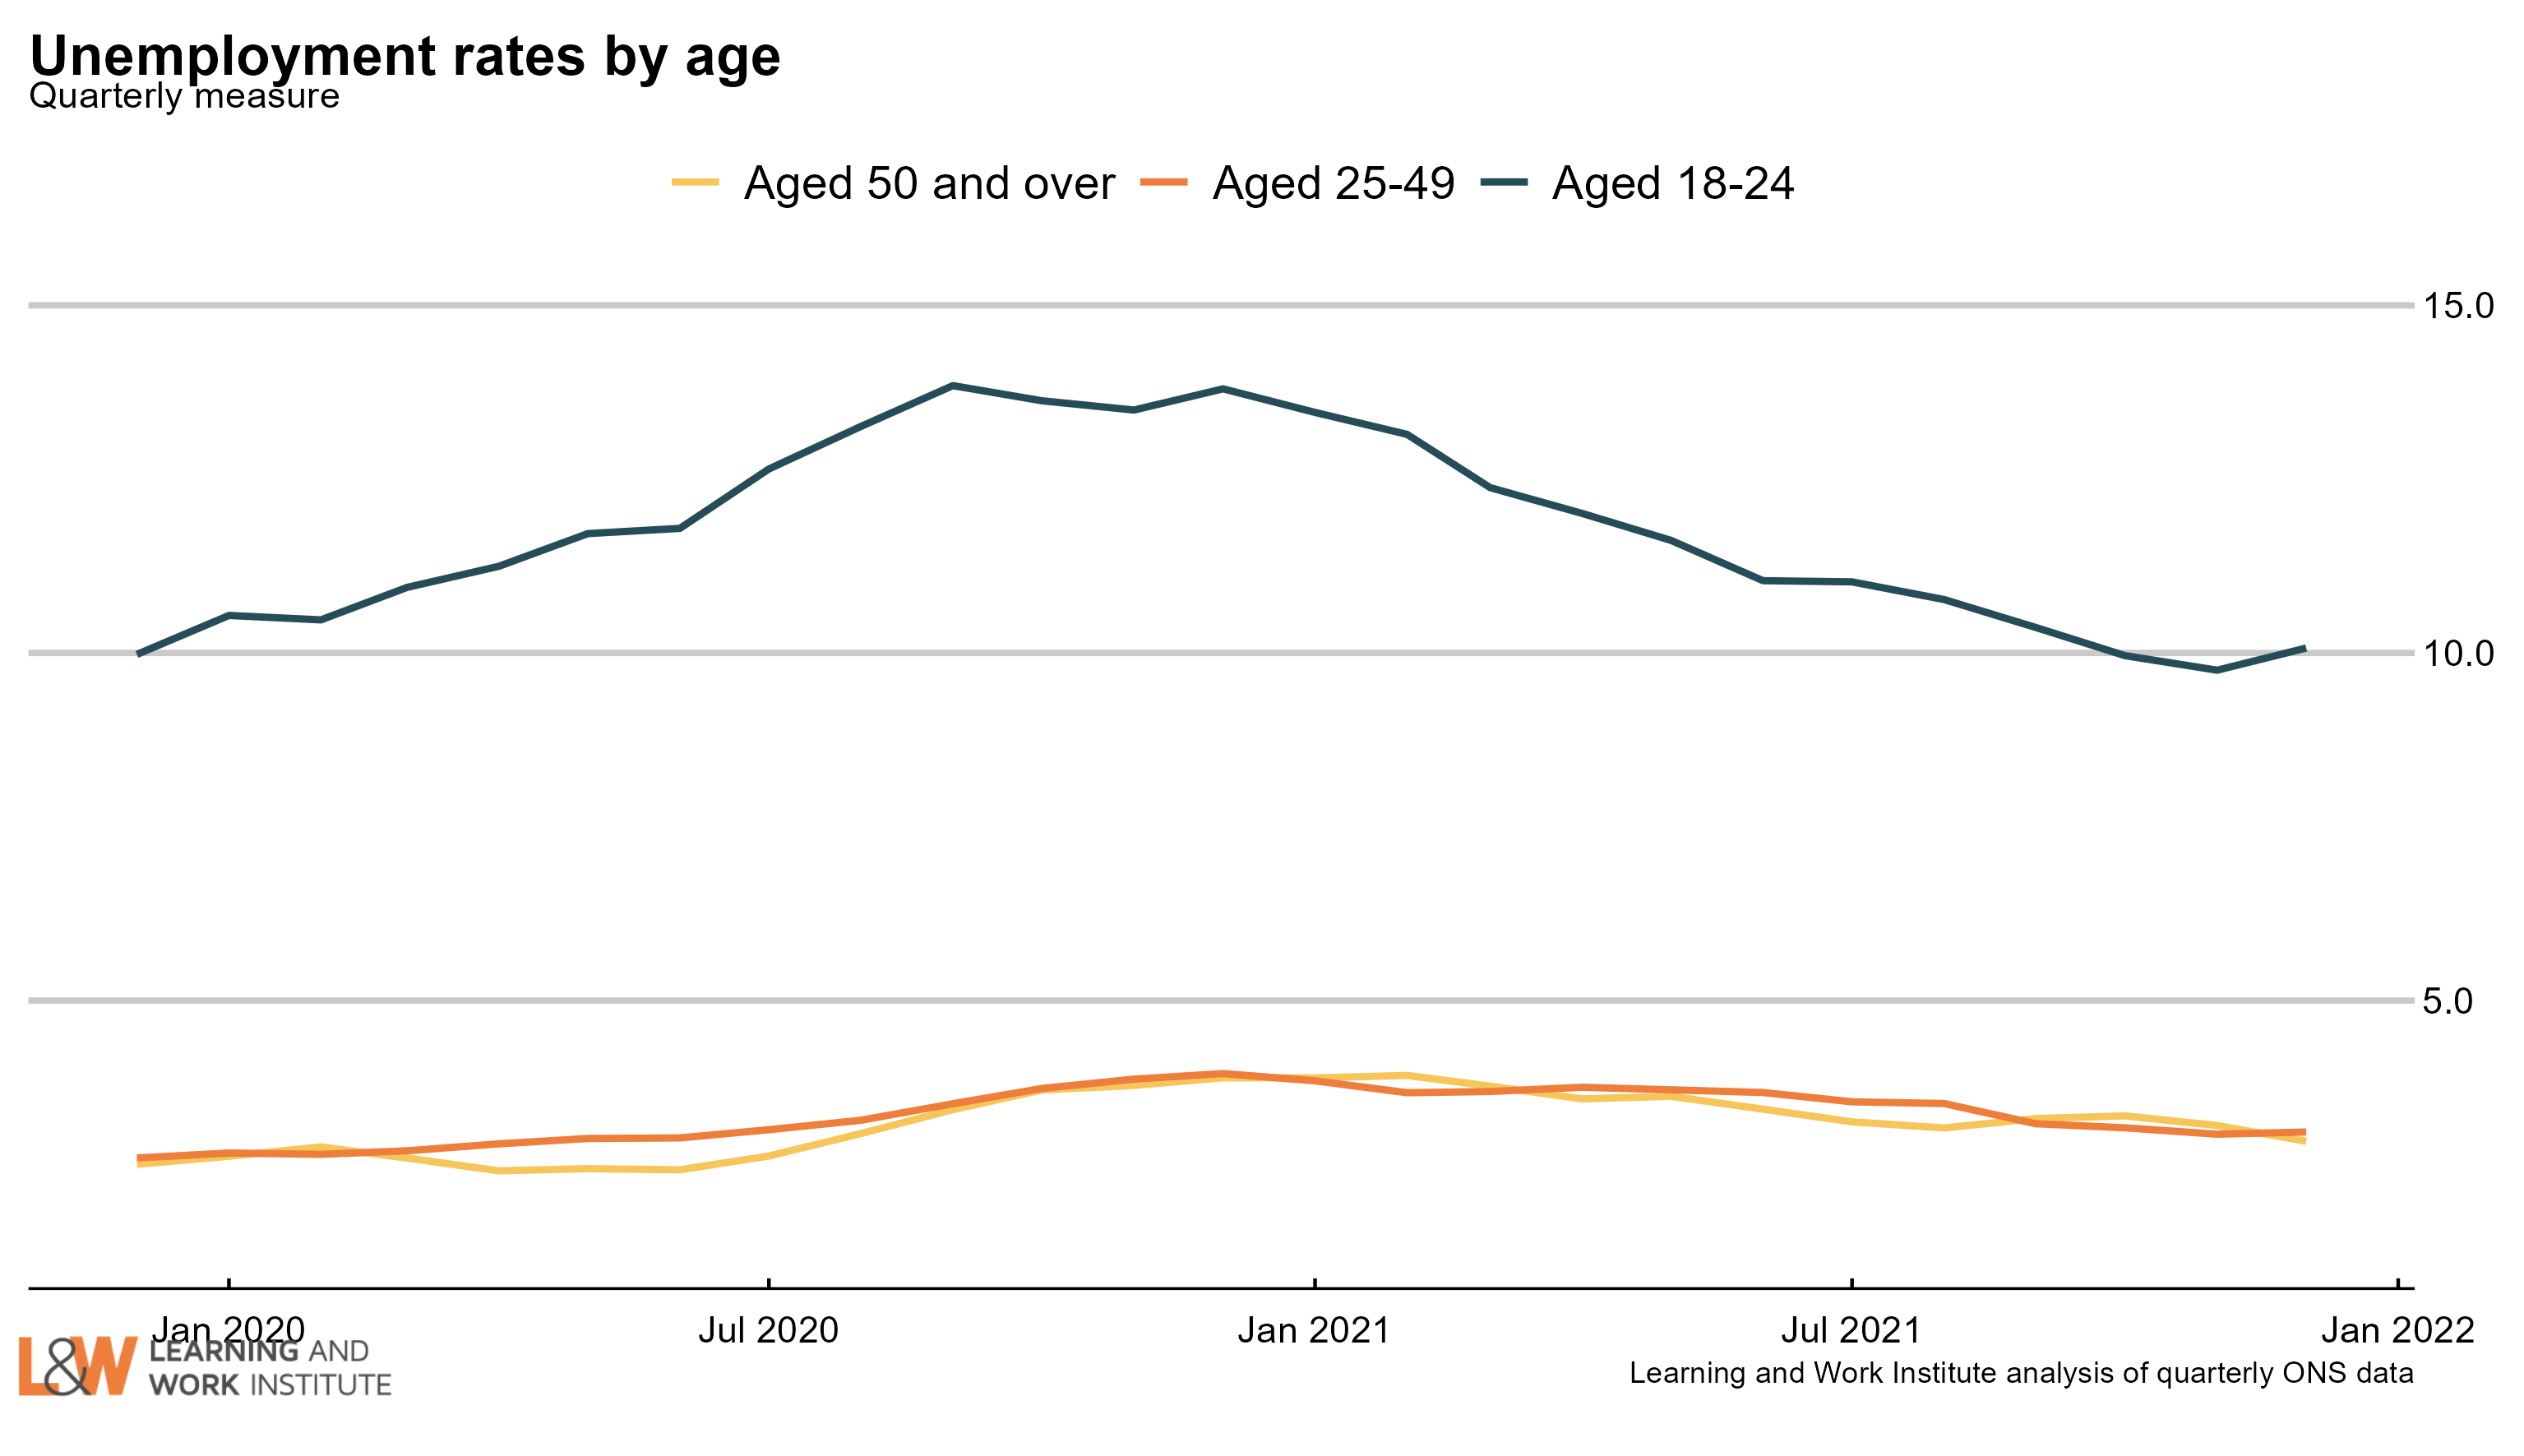 |
|
| Chart 8: Unemployment rate changes by age (counting February 2020 as 100) The 18 to 24 year old unemployment rate (including students) is 0.4 percentage points down on February 2020. The change for those aged 25 to 34 is up 0.4 points. The change for those aged 35 to 49 is up 0.3 points. The change for those aged 50 to 64 is up 0.1 points. The change for those aged over 65 is down 0.1 points. 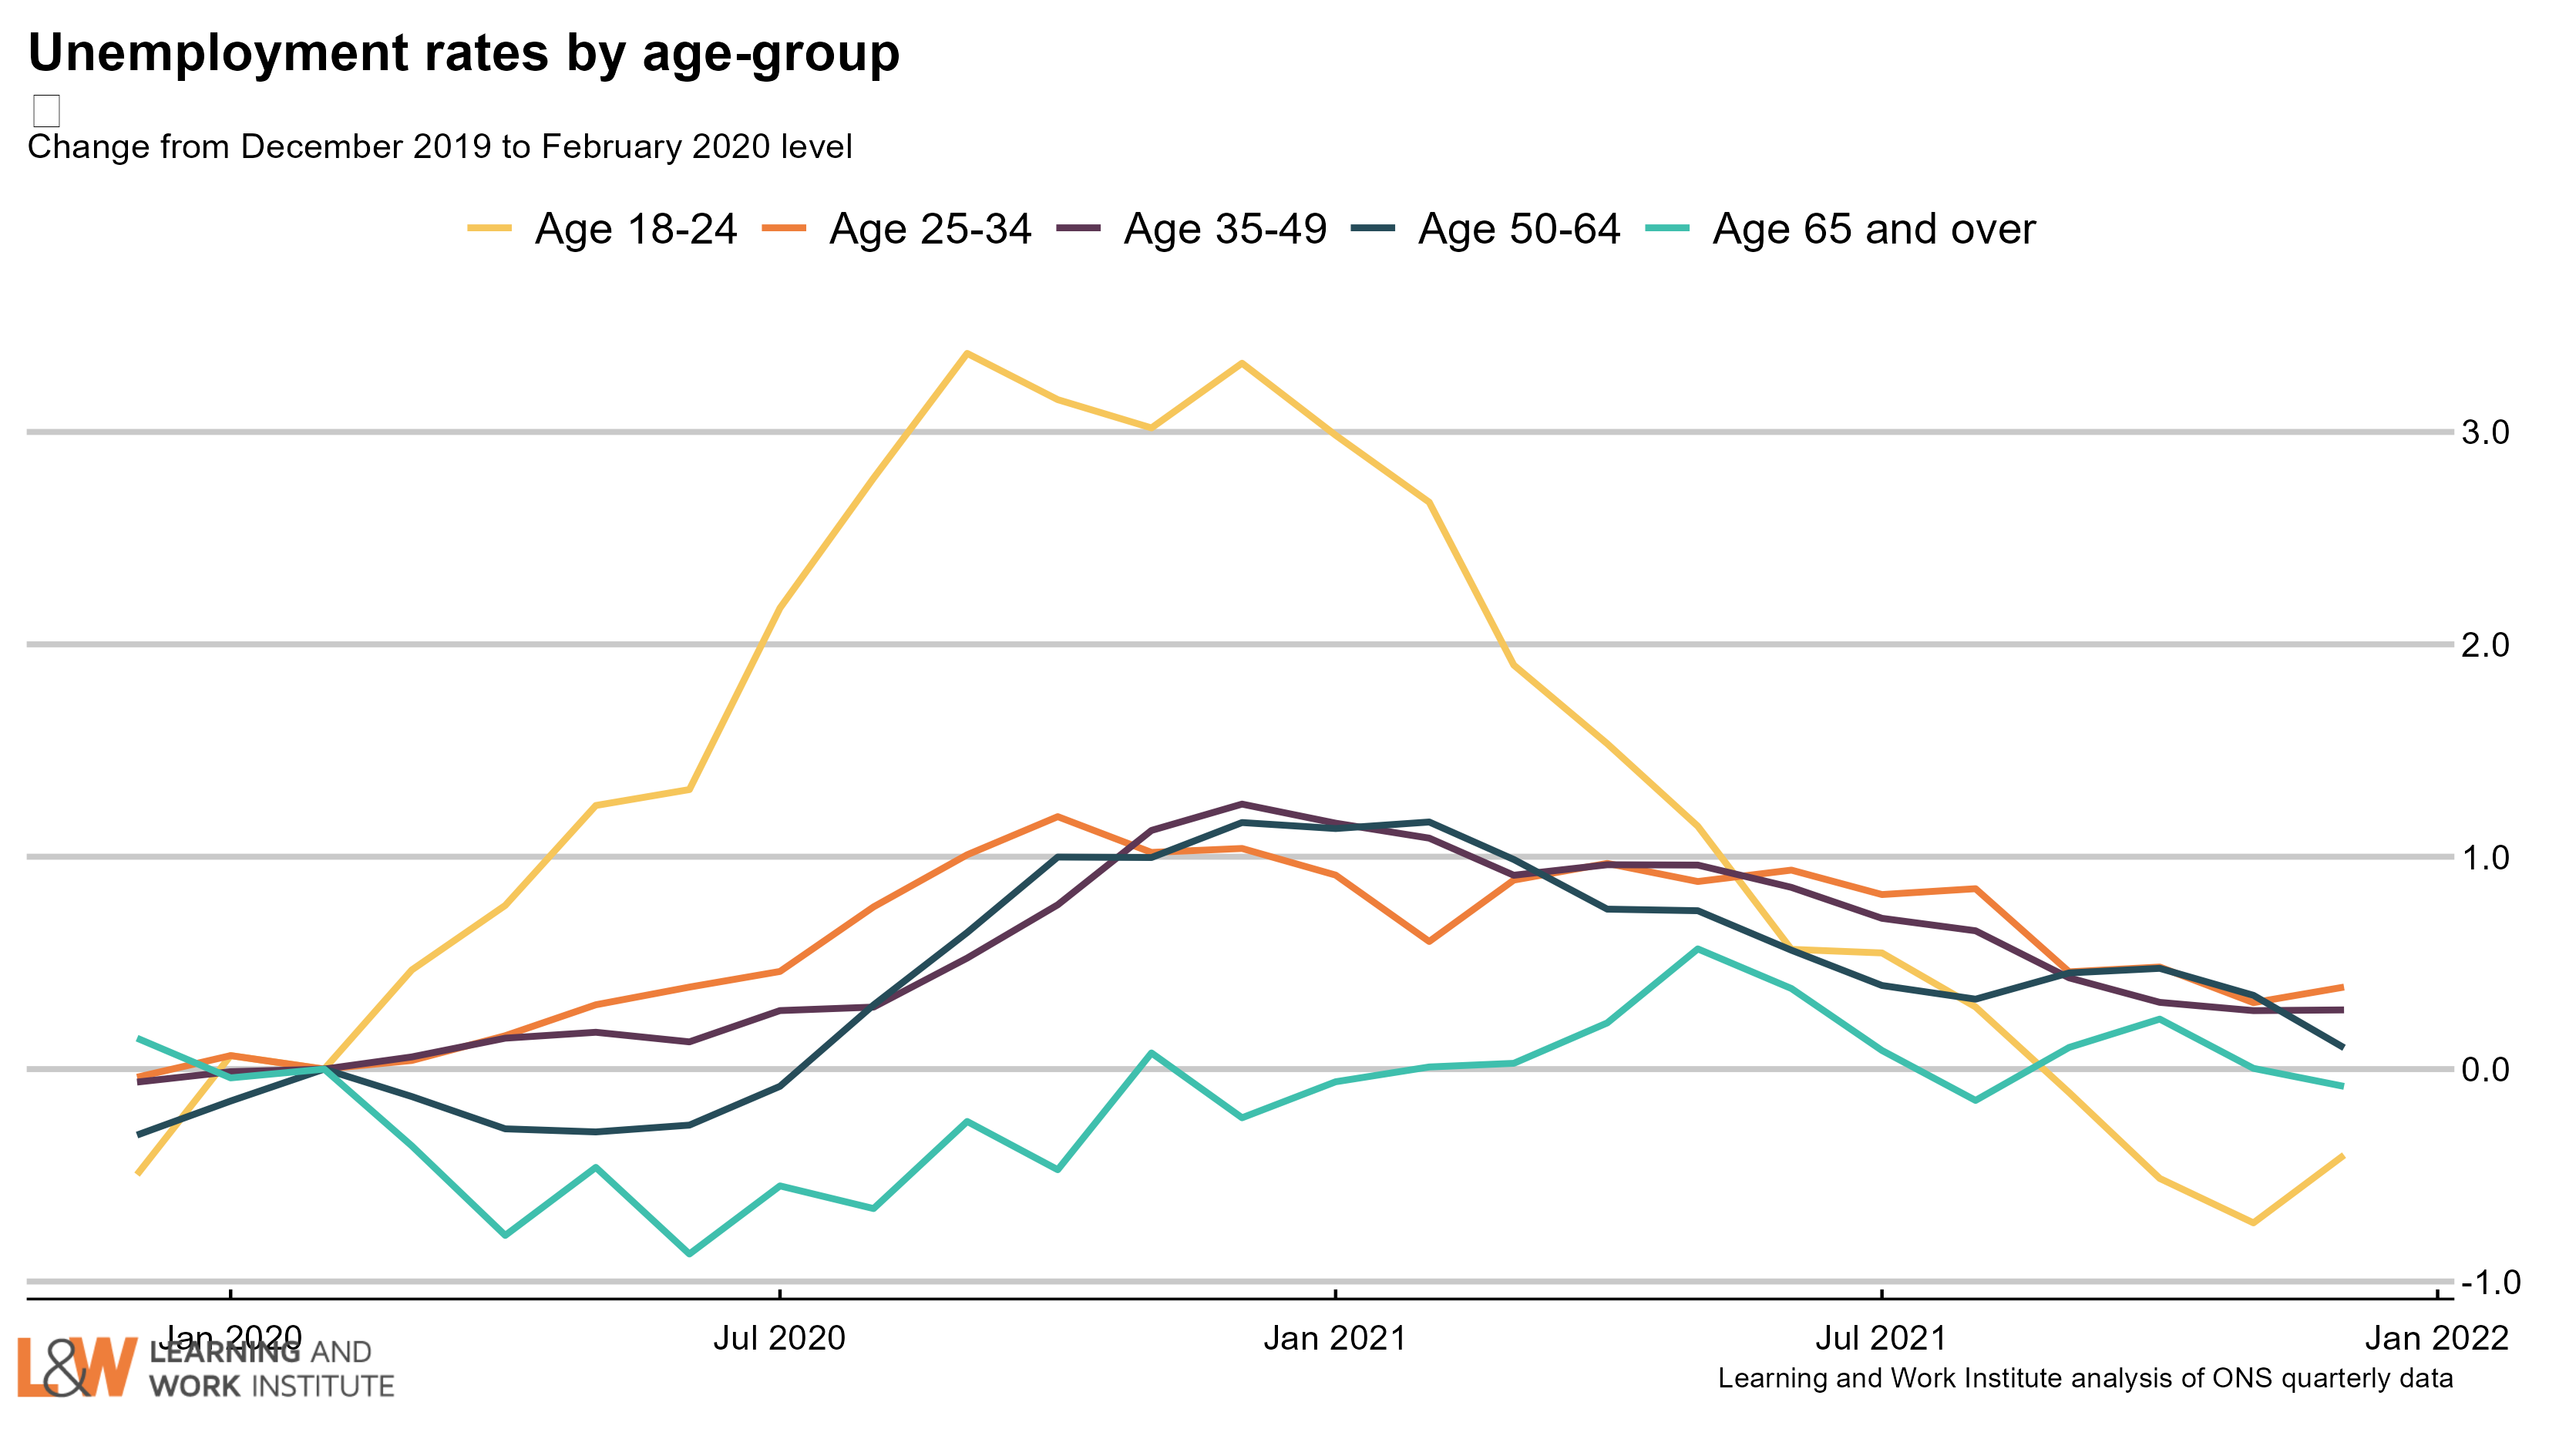 Chart 9: Vacancies – whole economy survey Headline vacancies this month increased by 43,000 to 1,298,000. The ONS' experimental single-month vacancy figures decreased by 71,000 in the last quarter. The headline ONS vacancy figure is both seasonally adjusted and a three-month average. The chart shows both series. 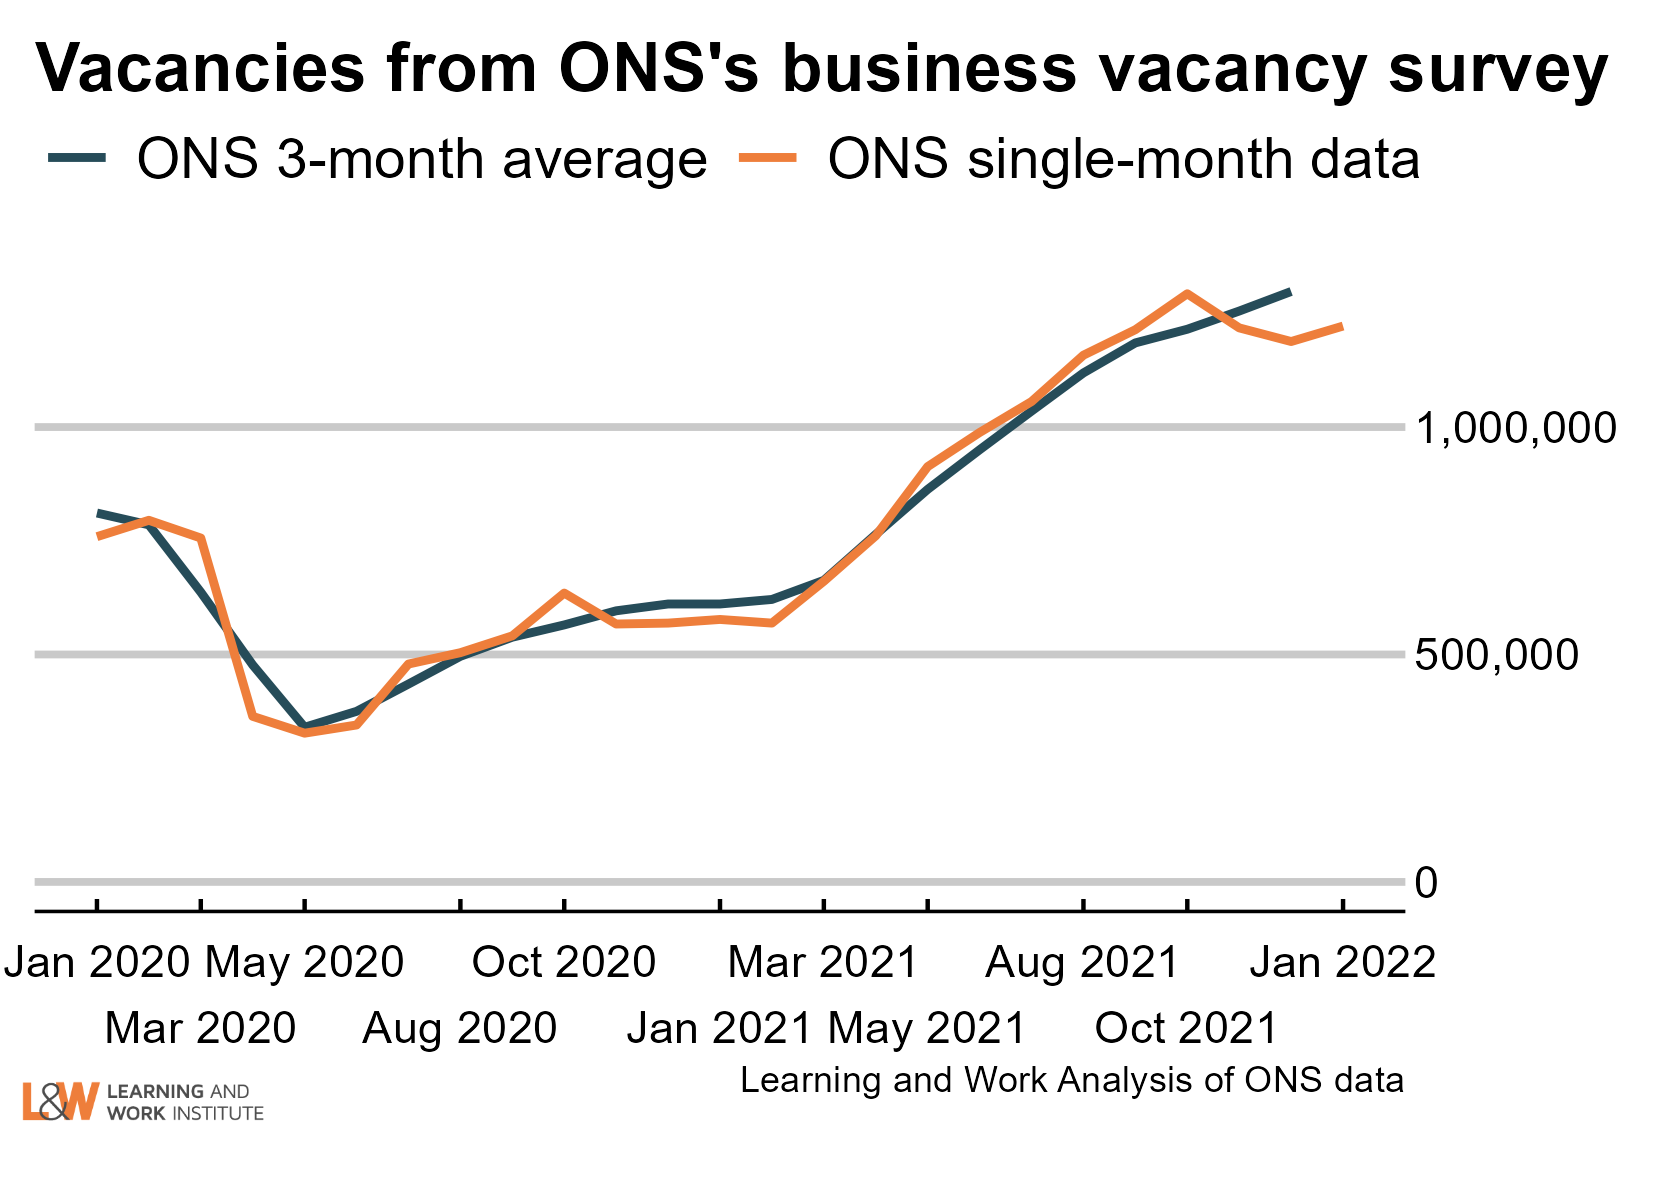 |
|
| Chart 10: Experimental single month vacancies – whole economy survey The Office for National Statistics' experimental single month vacancy estimates include sectoral information. As these are not seasonally adjusted, it is better to look at annual changes. The numbers are thousands of vacancies, under each number, and on the right, the annual change in thousands of vacancies. The 2020 figures are for January. Next month we will change the pre-pandemic comparison back a year to 2019. 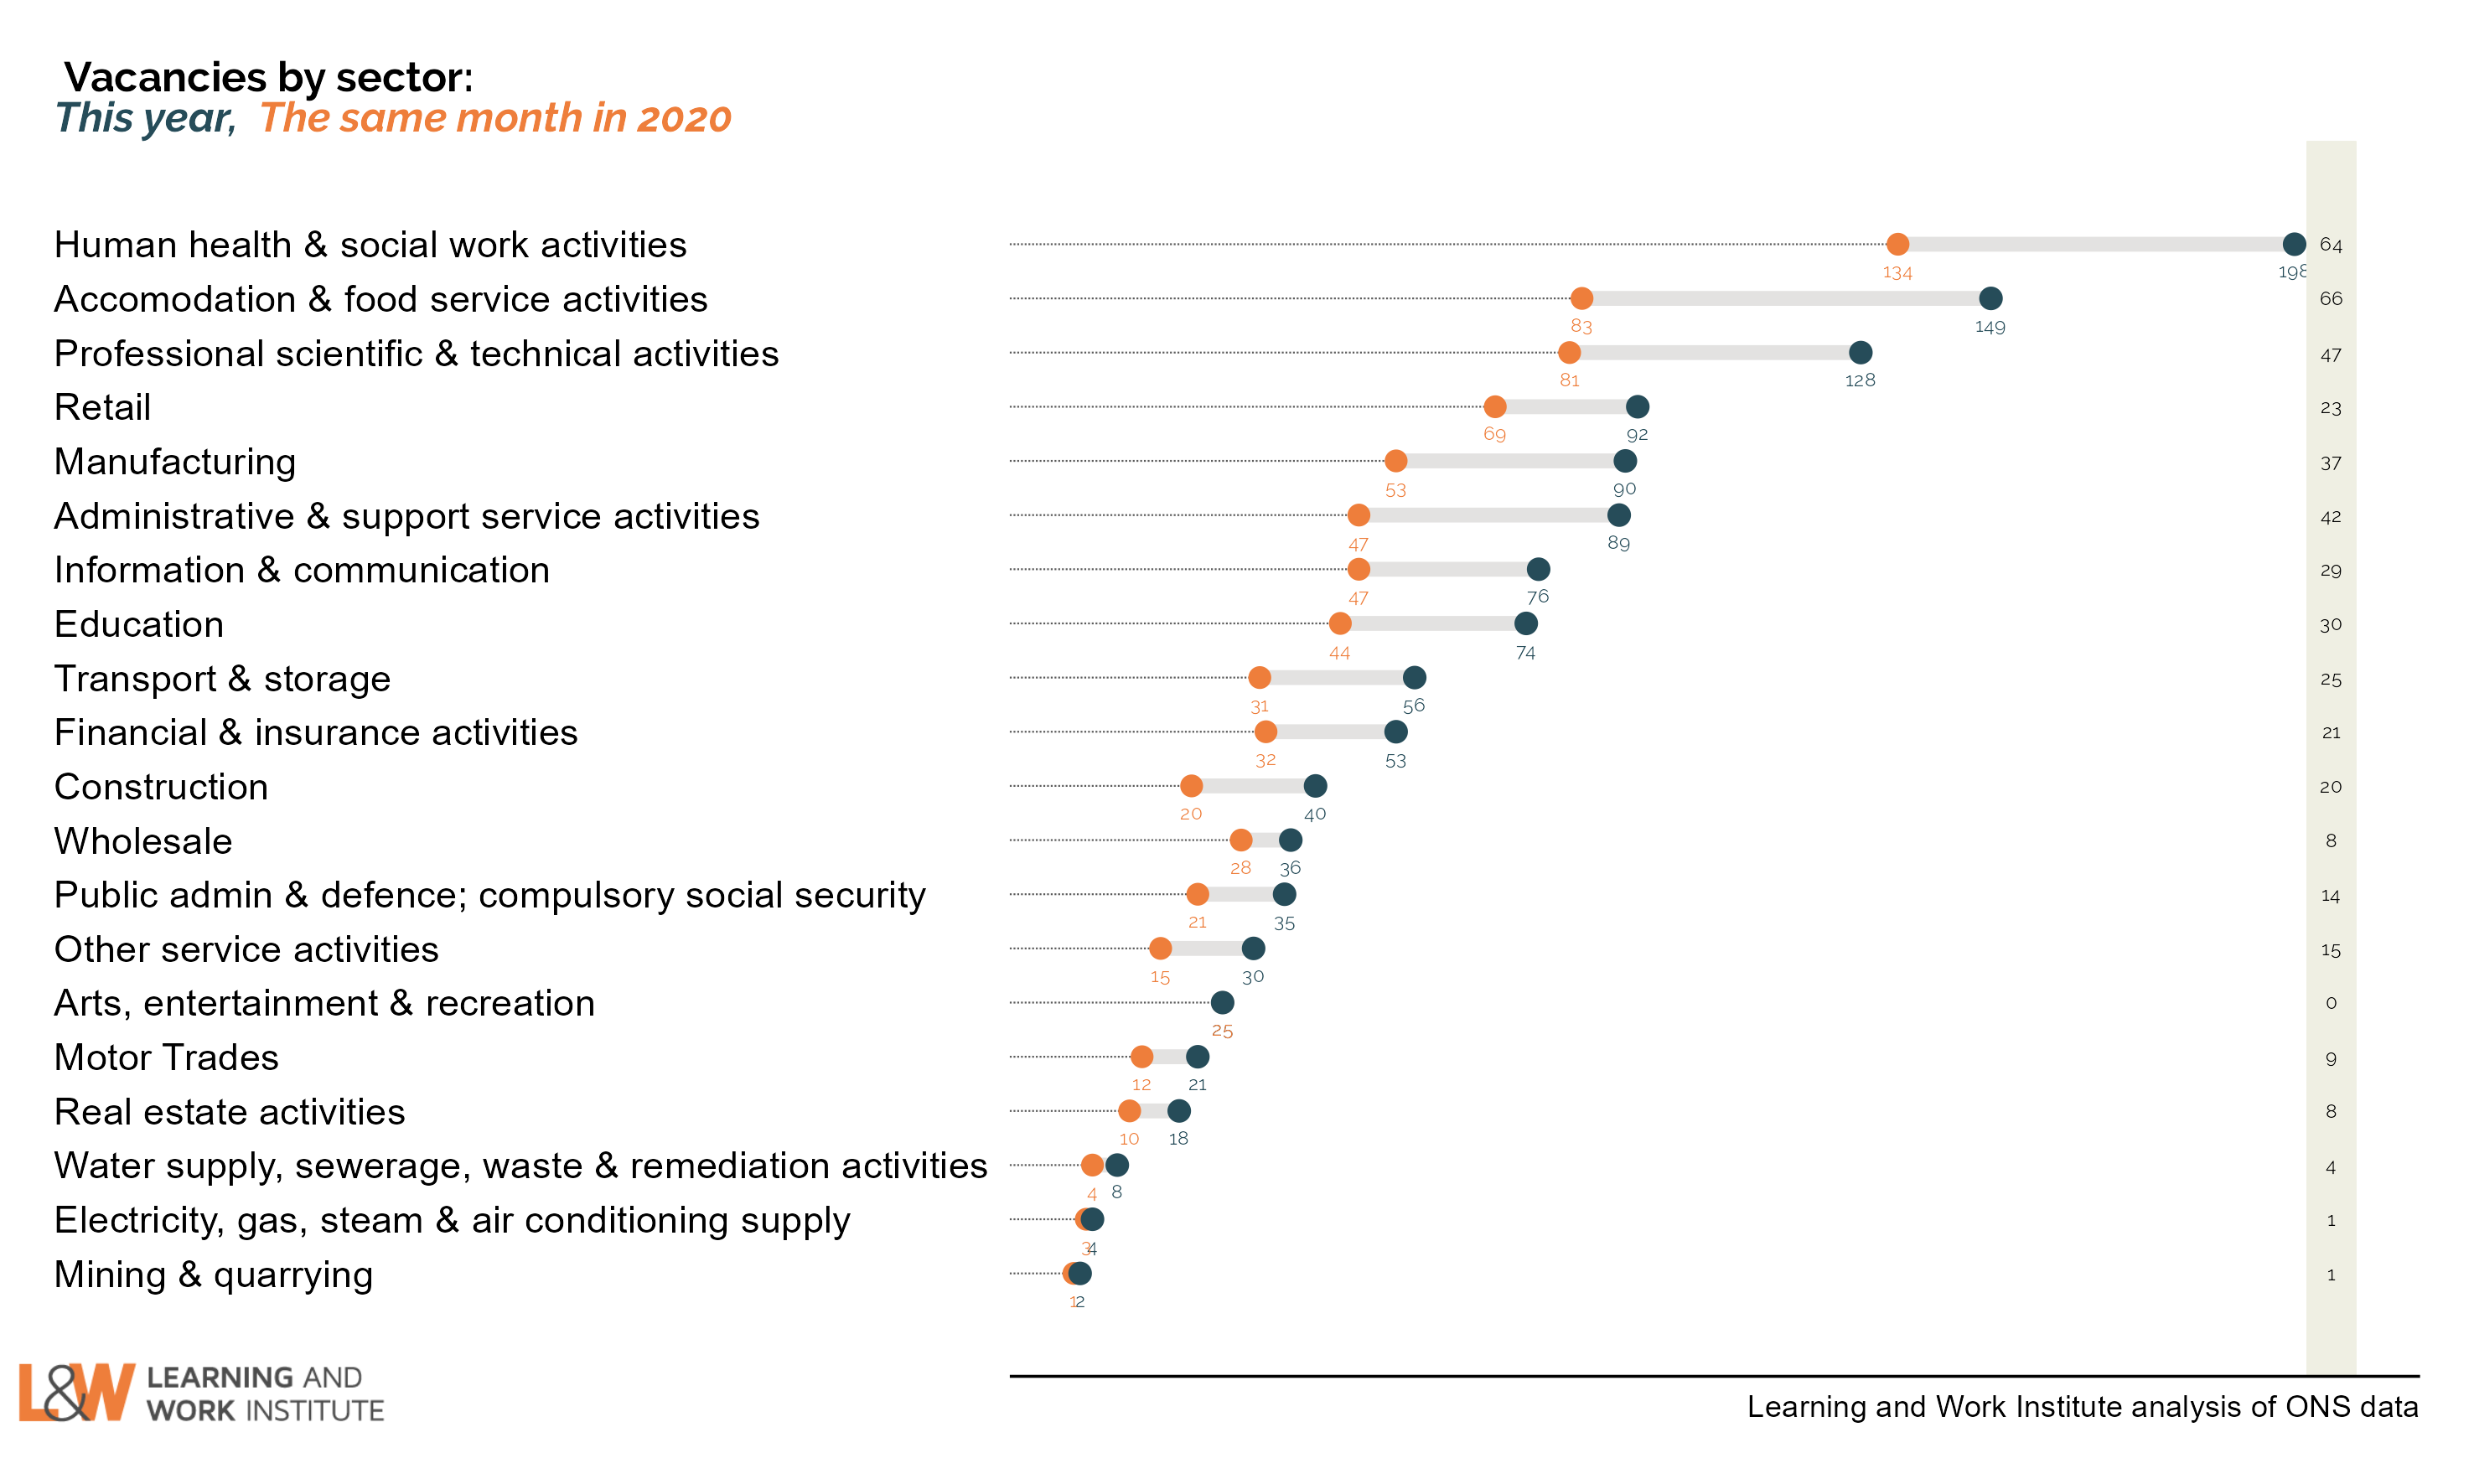 |
|
| Chart 11: Unemployed people per vacancy There are 1.1 unemployed people per vacancy. This is a record low figure, but the same as last month. 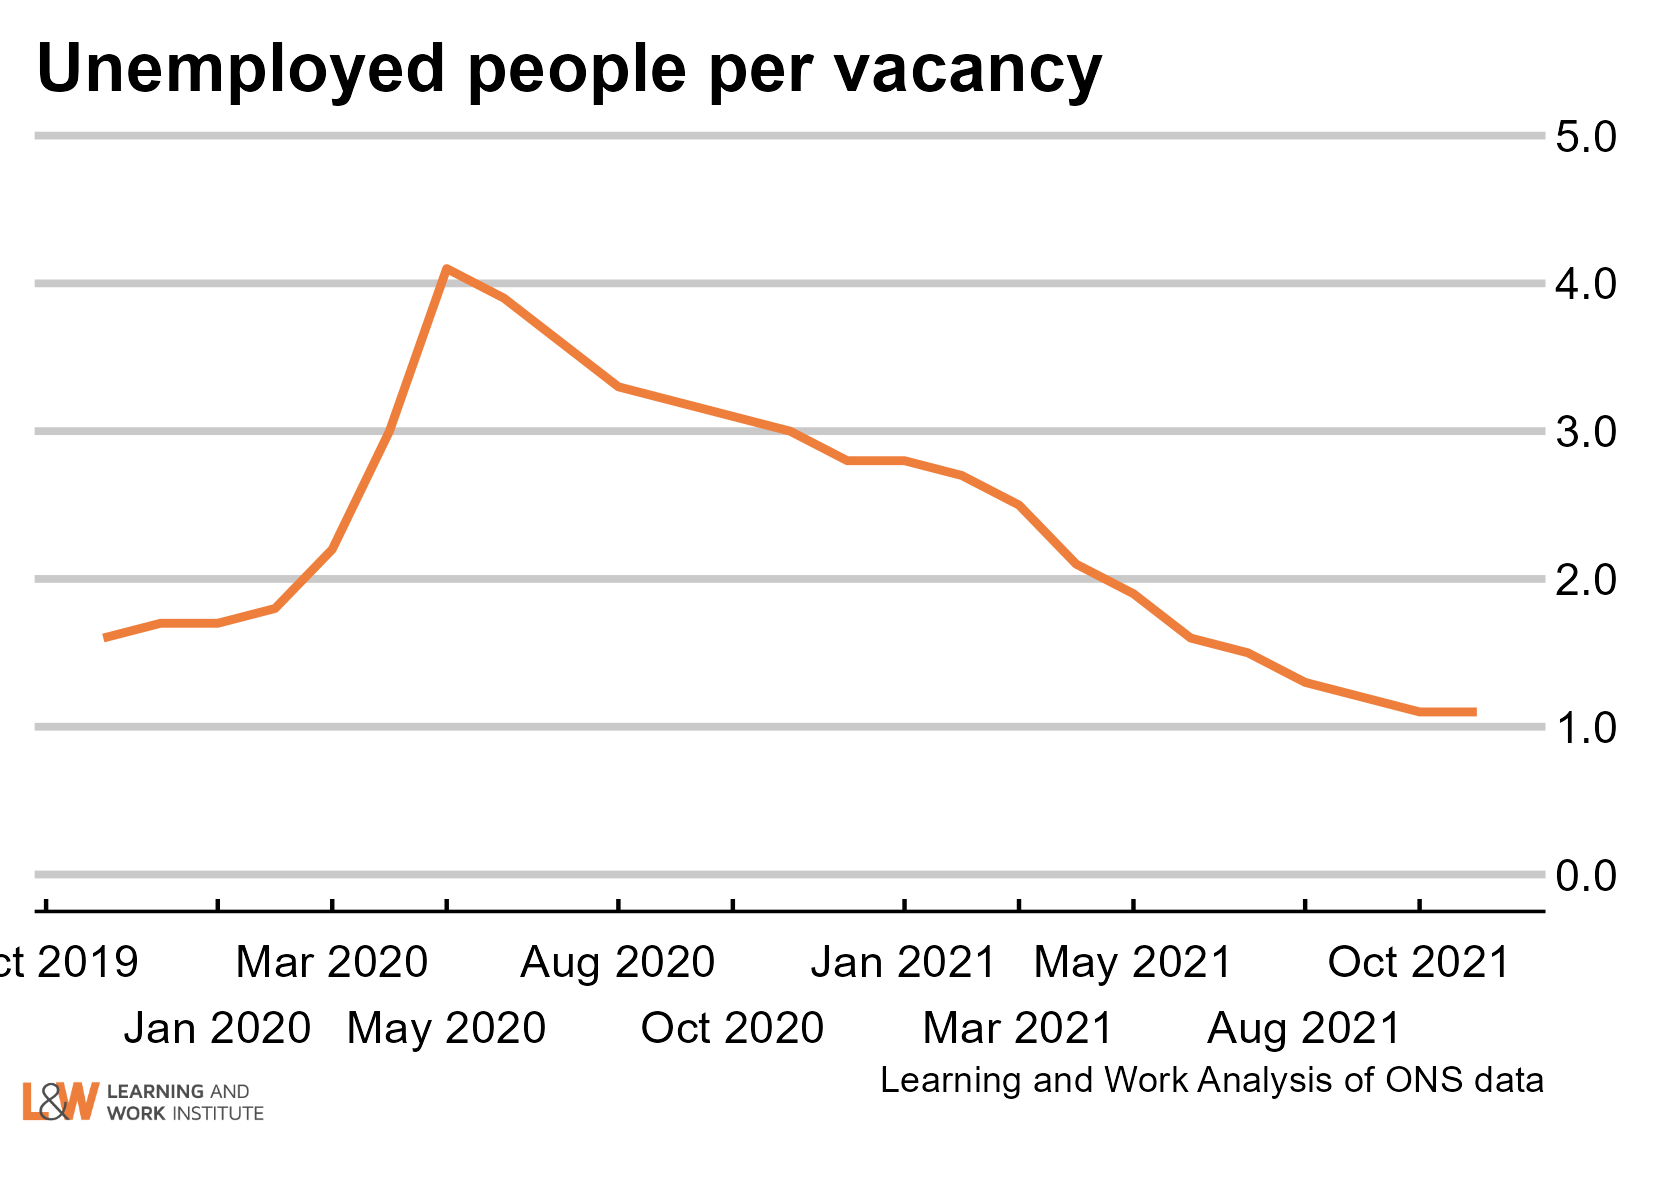 |
|
| Chart 12: Online vacancies to early March from Adzuna The online vacancies figures cover the period up to Friday February 4, 2022 are dominated by the recovery from the annual seasonal fall in recruiting, which varies across sectors and regions. Overall online vacancies are 145% of Feb 2020. They are still 1% down on their pre-Christmas maximum. Compared with the same week in 2019, the overall vacancy level is up 24%. Of regions, London is 10% up on the same week in 2019. The South East is 8% up on the same week in 2019. Wales is 38% up on 2019. The North East is 43% up on 2019. Manufacturing is 20% up on 2019, while wholesale and retail is 38% up. Transport/logistics/warehouse is 141% up, hospitality 40% up, admin/secretarial 21% up, facilities/maintenance 565% up, healthcare 47% up, education 27% up. 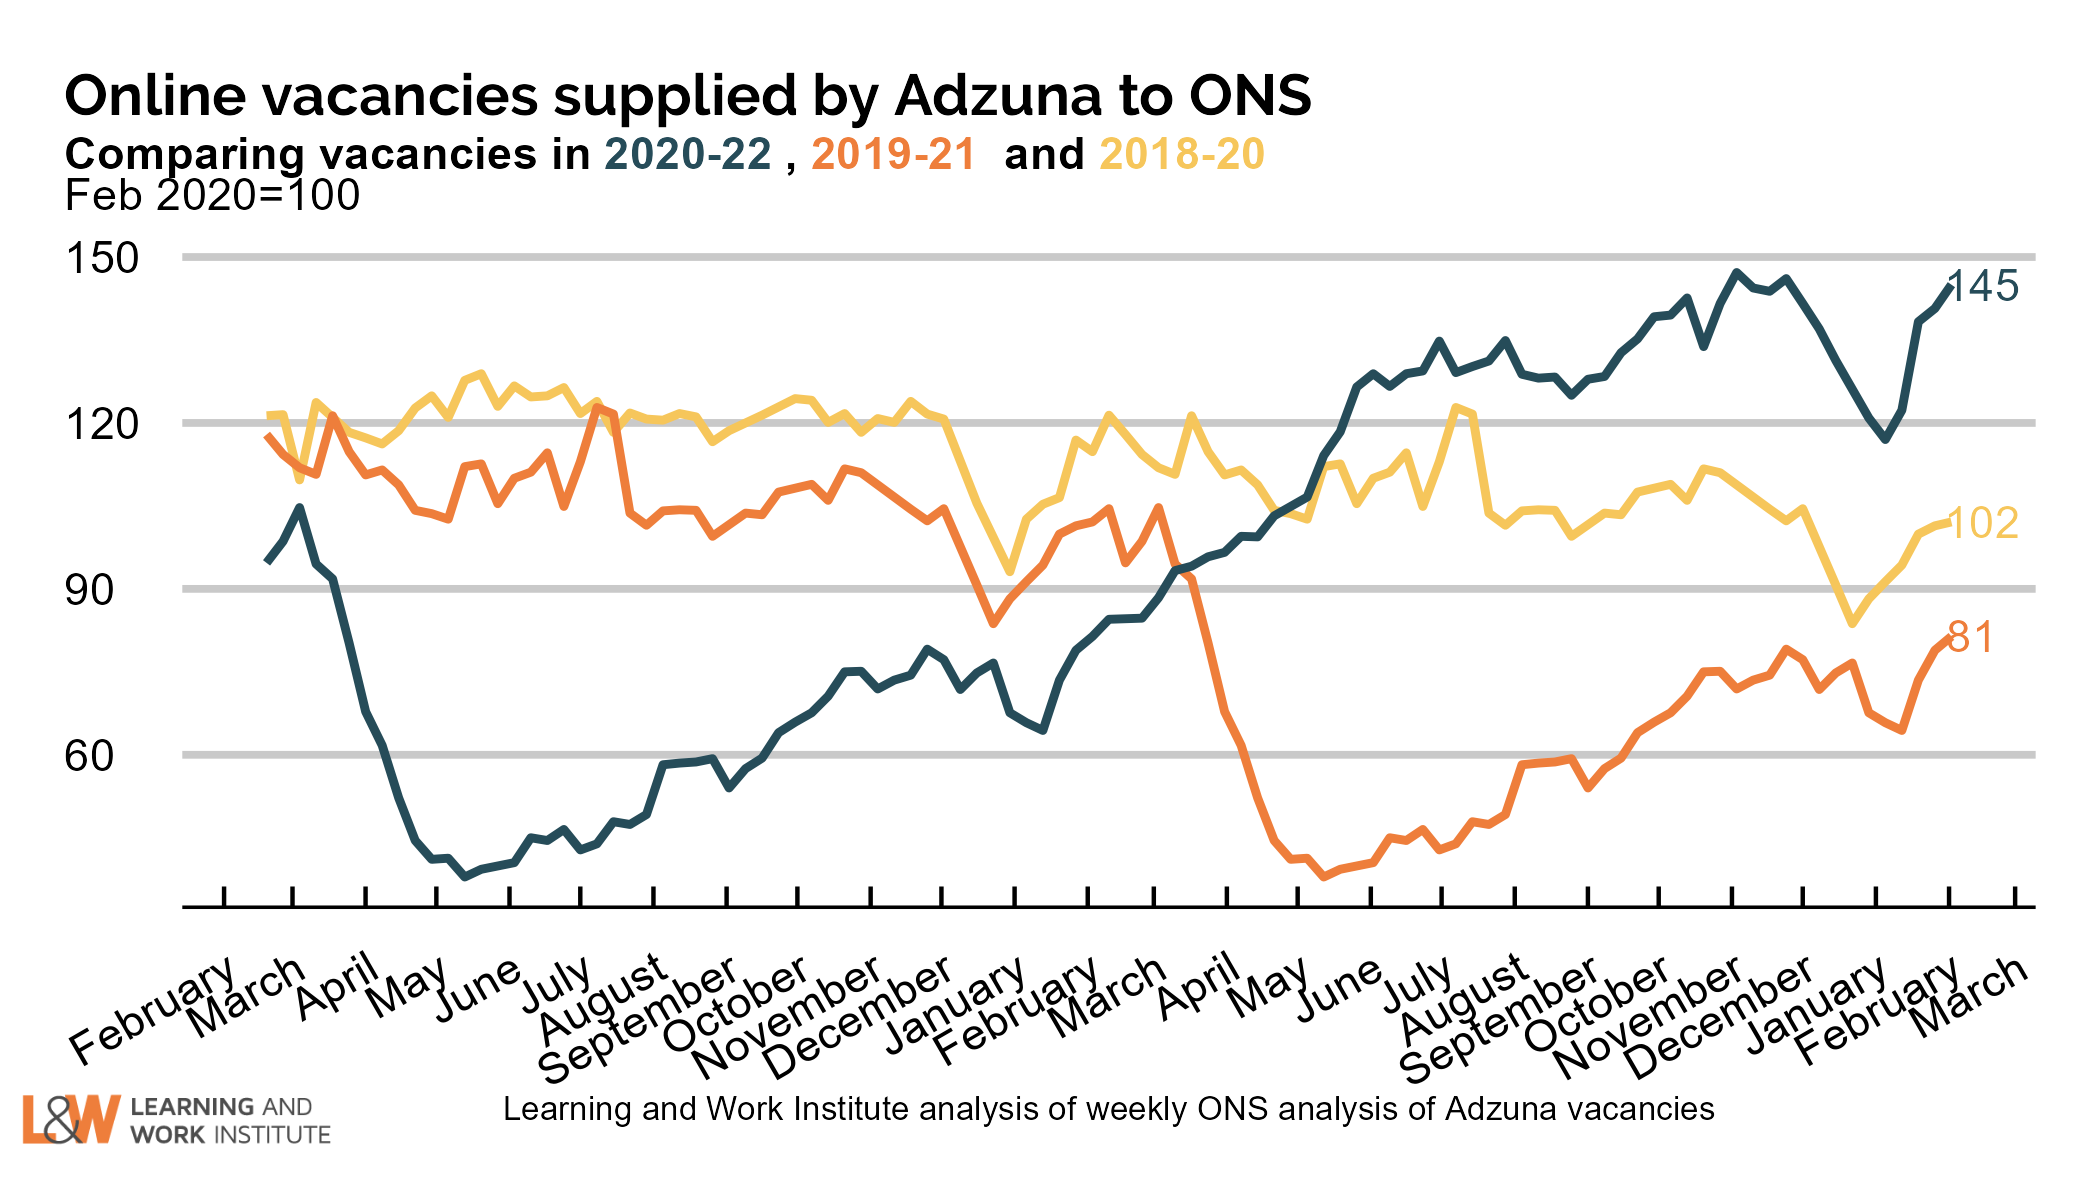 |
|
| Chart 13: UK employment Employment has risen by 10,000 on the figure published last month, to 32,485,000. The chart shows both the official figures and the experimental weekly figures. The trend is likely to be upwards. 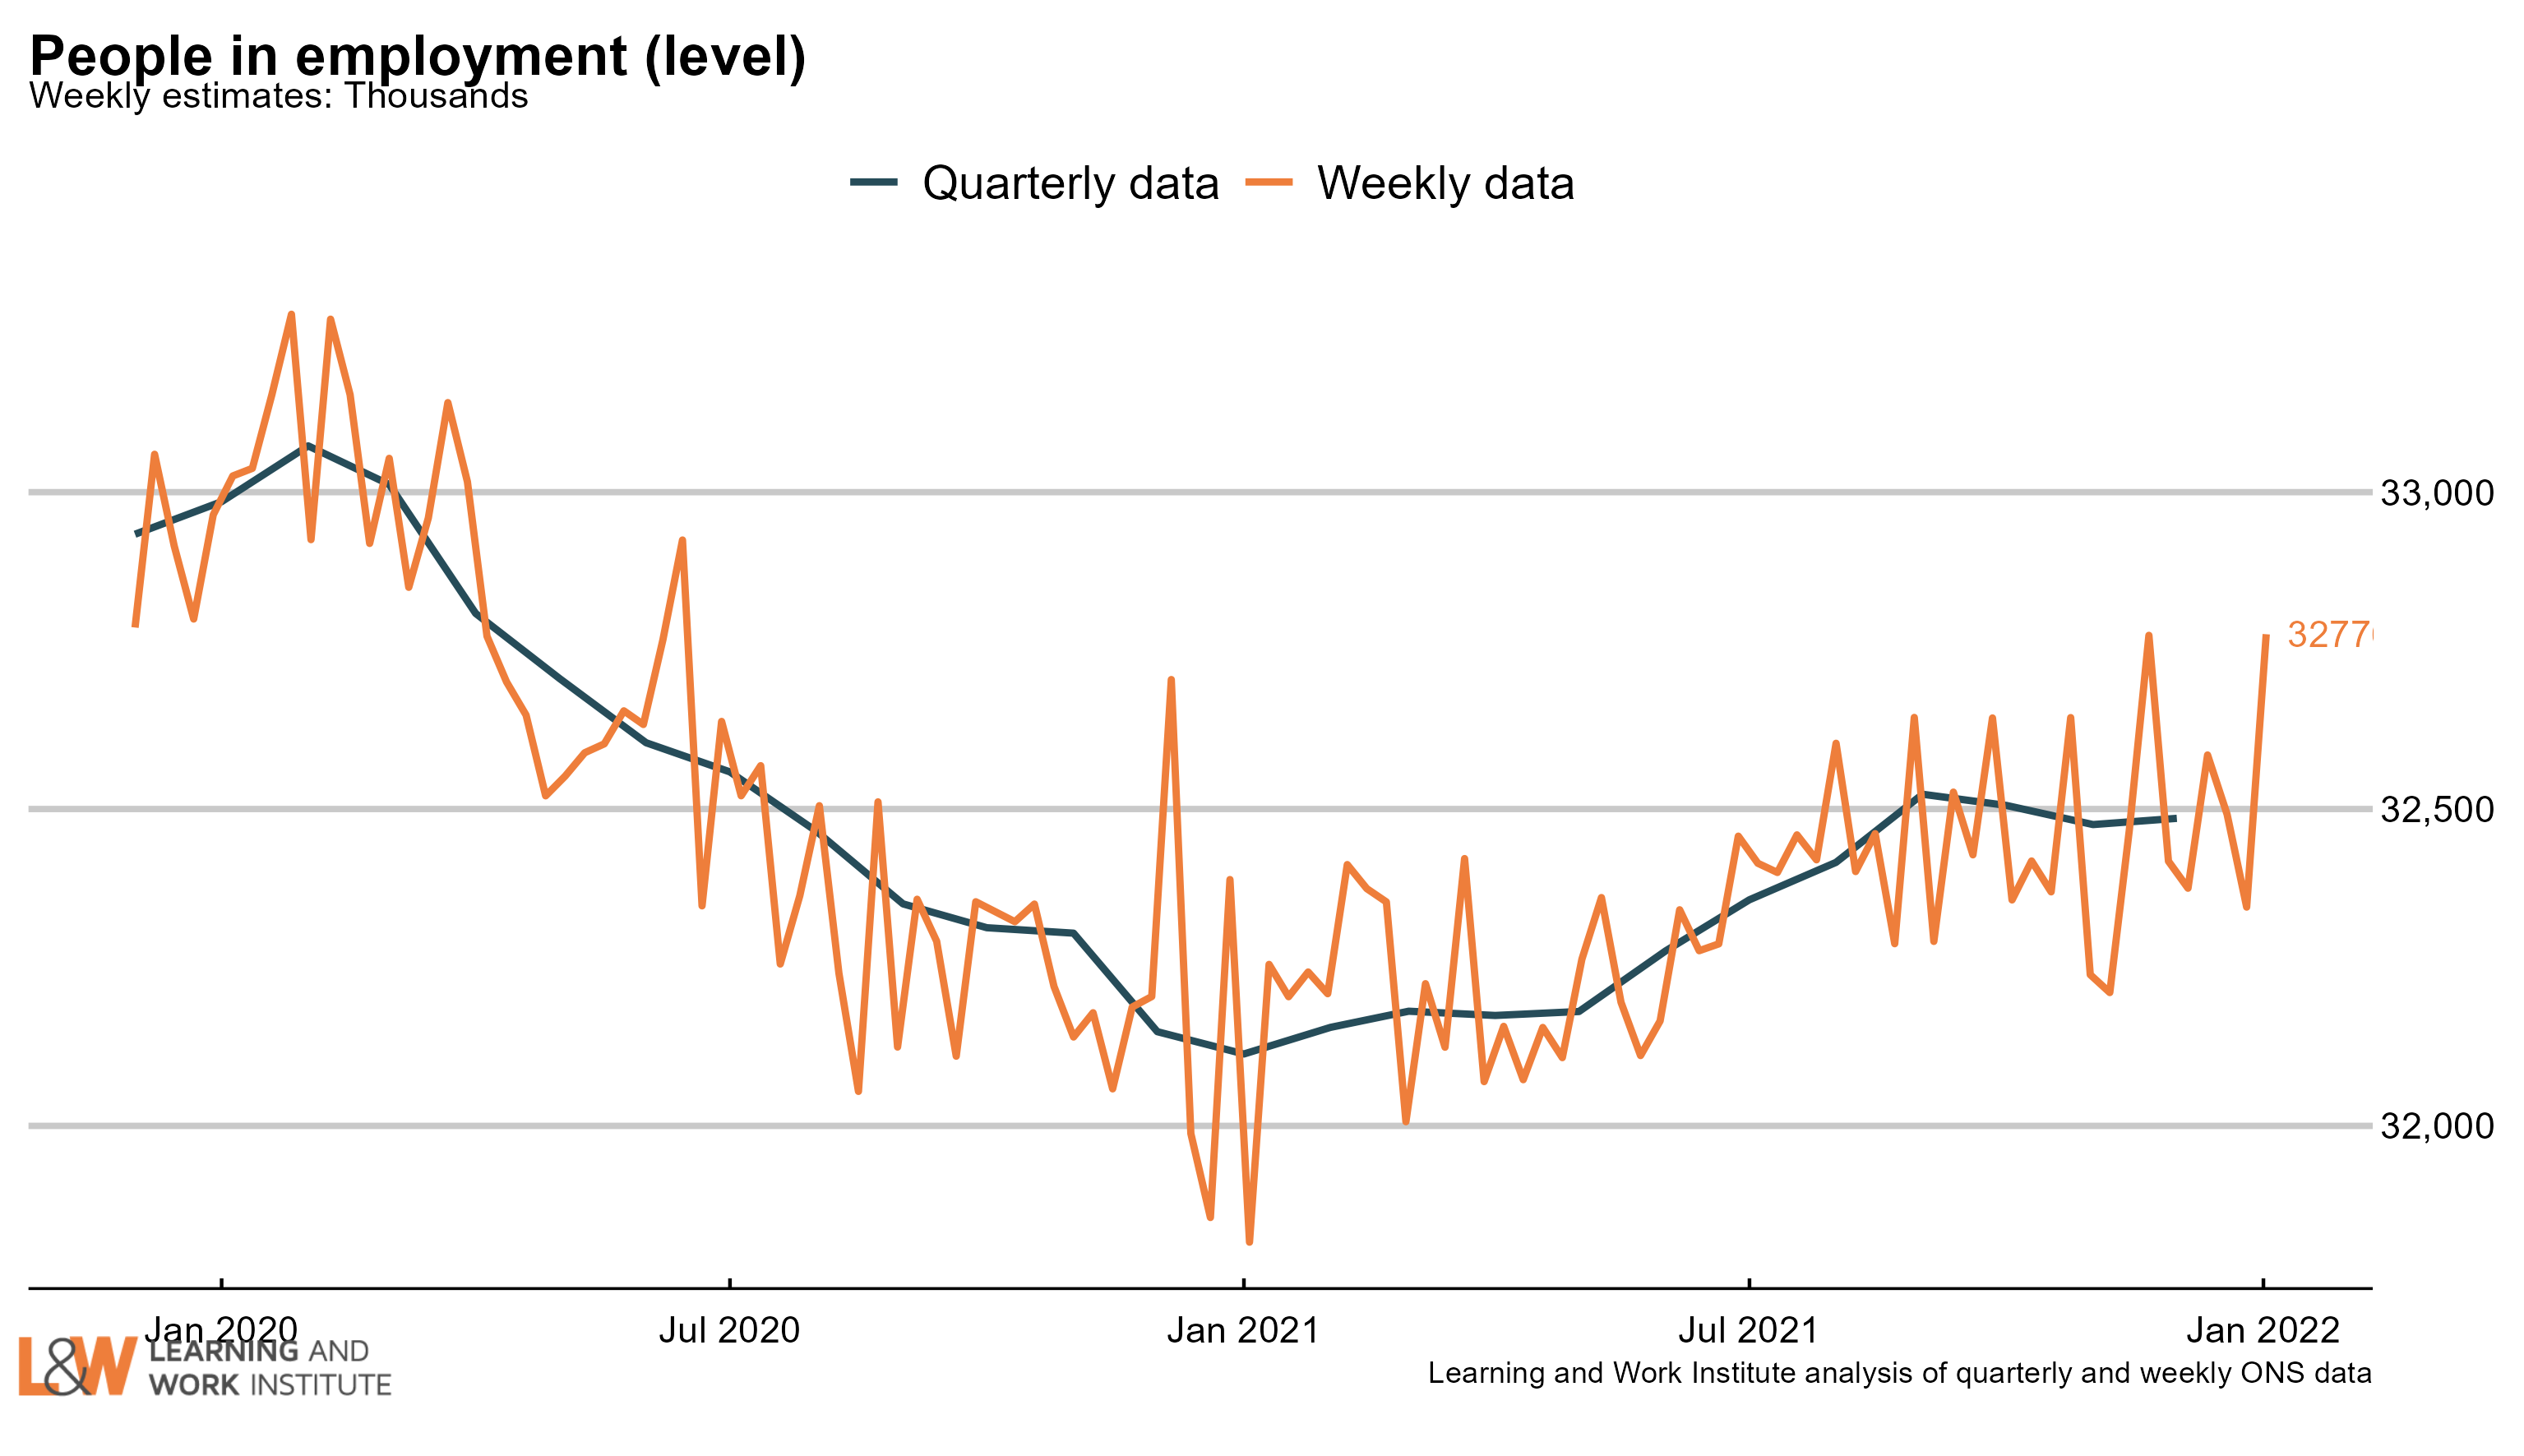 |
|
| Chart 14: Employment rate in the UK The employment rate rose by 0.1 percentage points over the quarter, to 75.5%. The chart shows both the official figures and the experimental weekly figures. The trend is likely to be upwards. 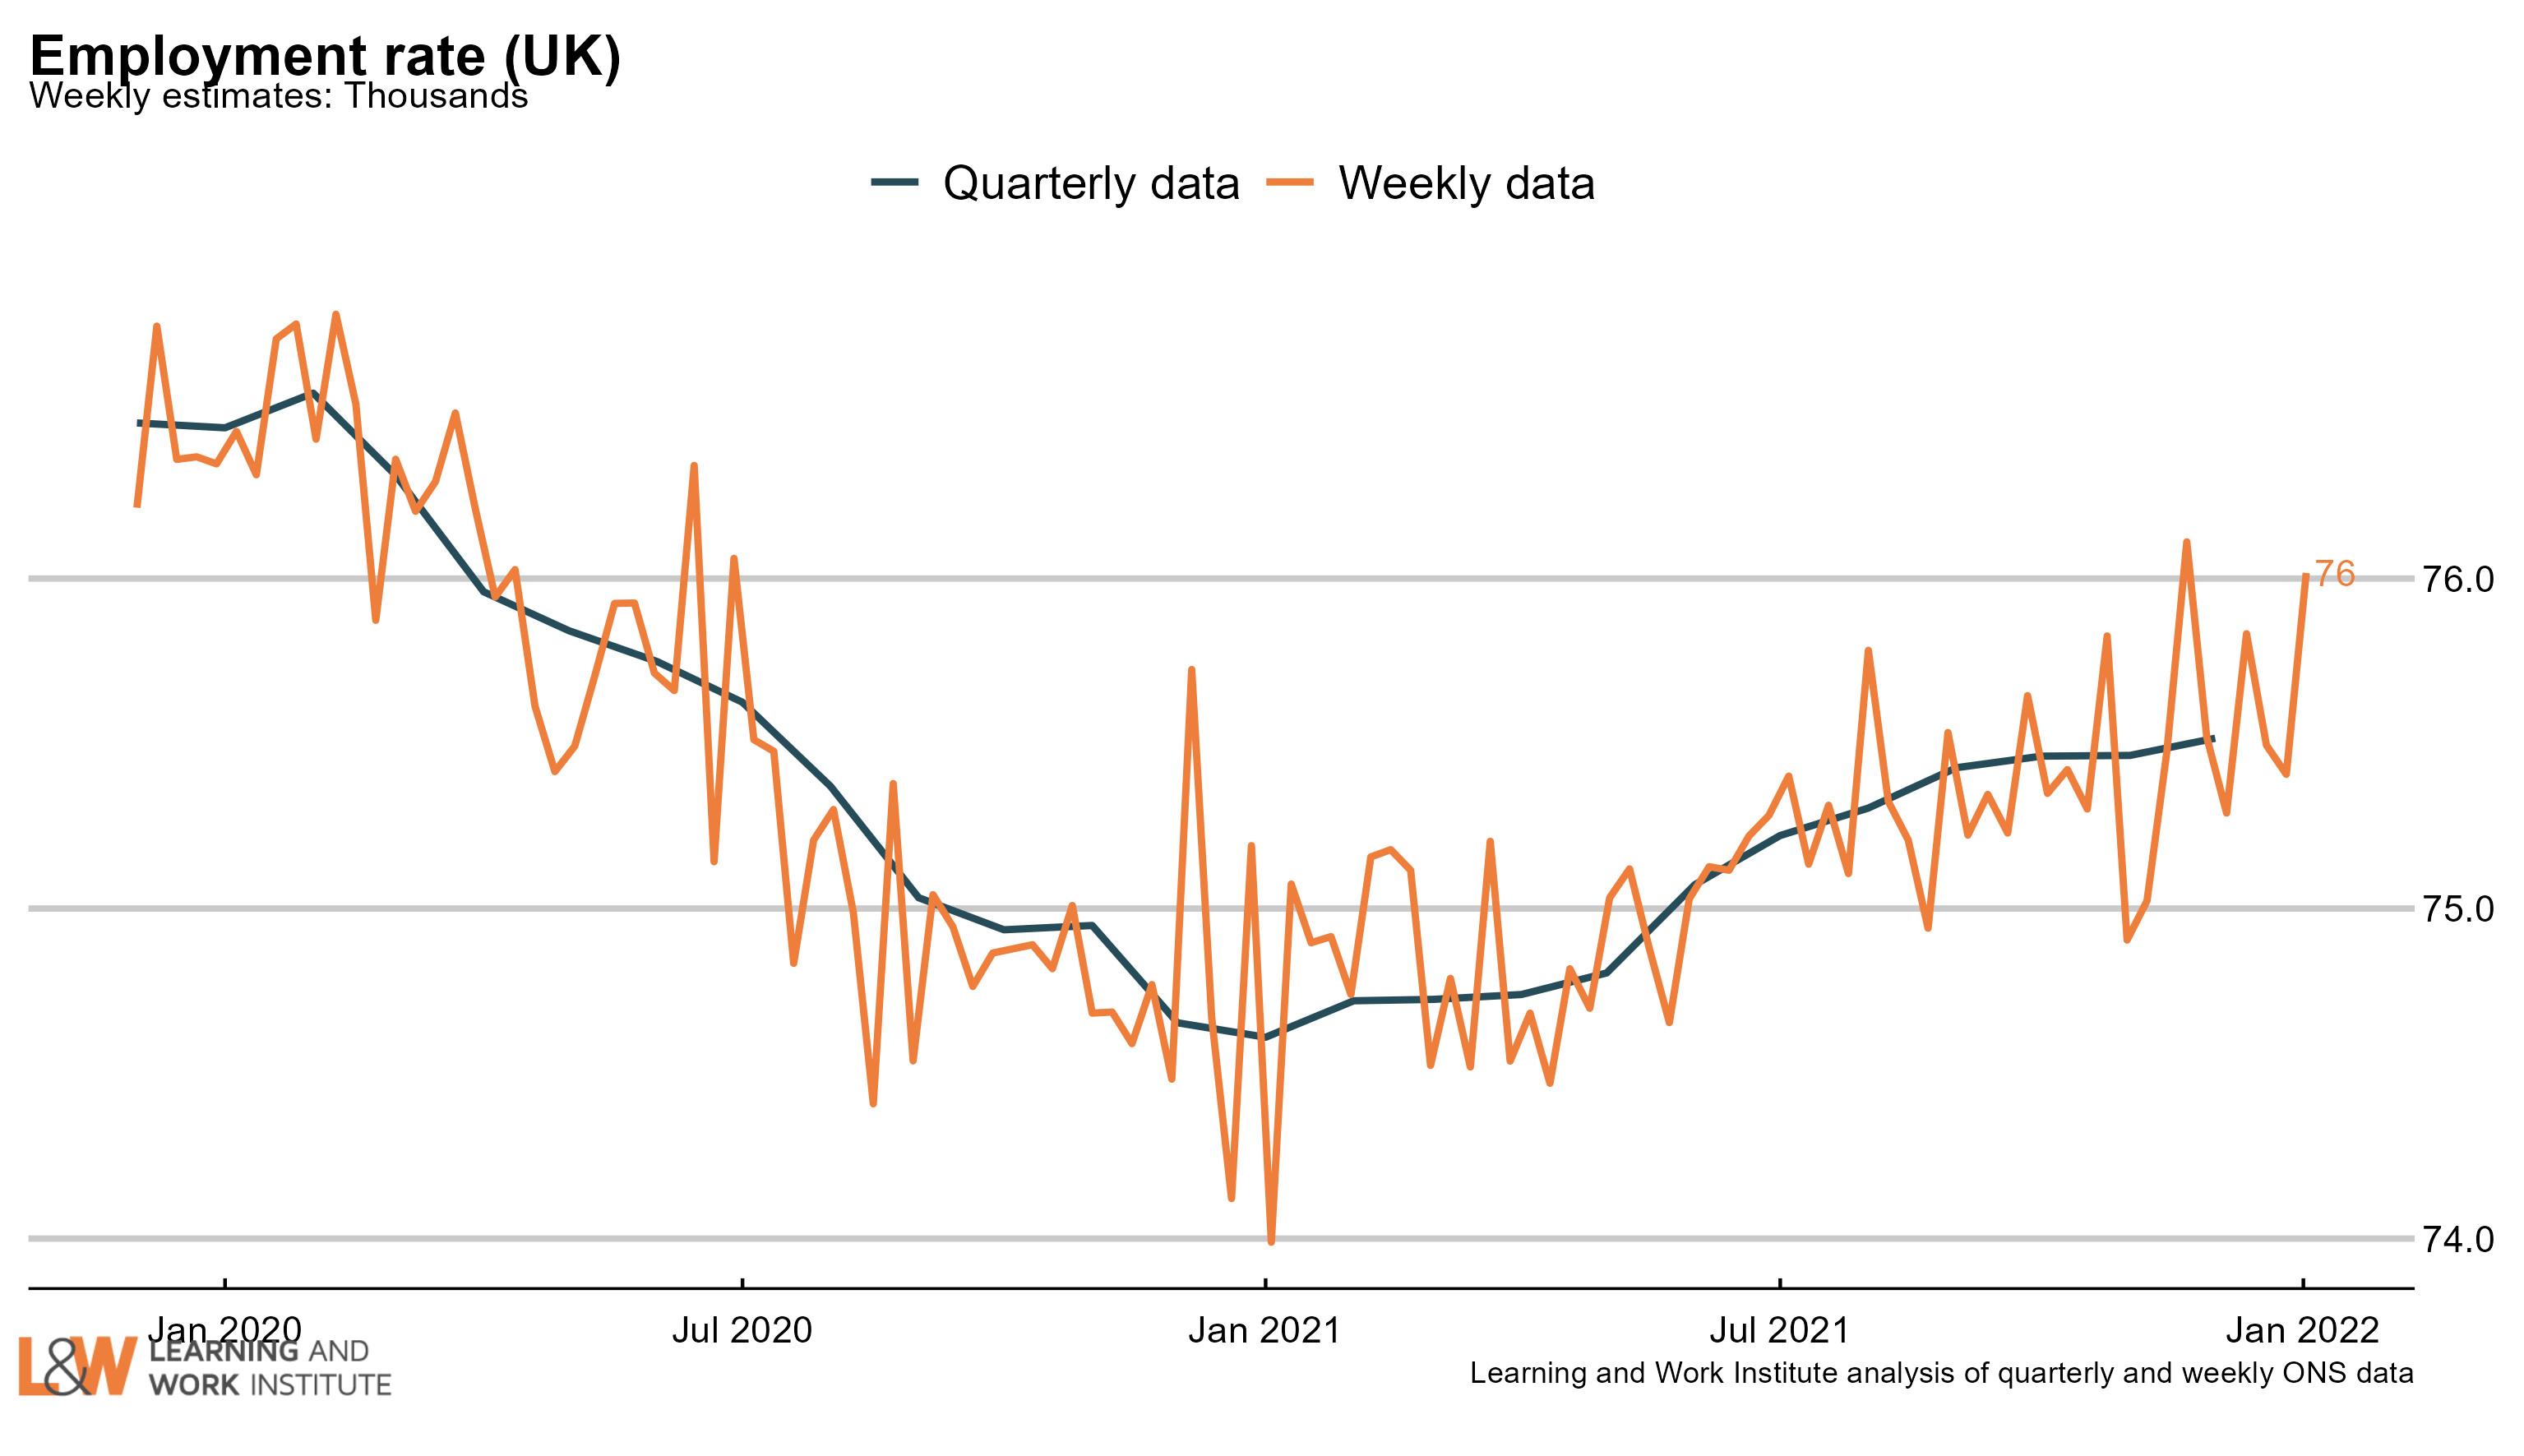 |
|
| Chart 15: Economic inactivity – the long-term sick or disabled The numbers of people who are economically inactive (that is, not working and not currently looking for work) who are long-term sick or disabled has risen sharply in the last three months to 2.31 million working age people. 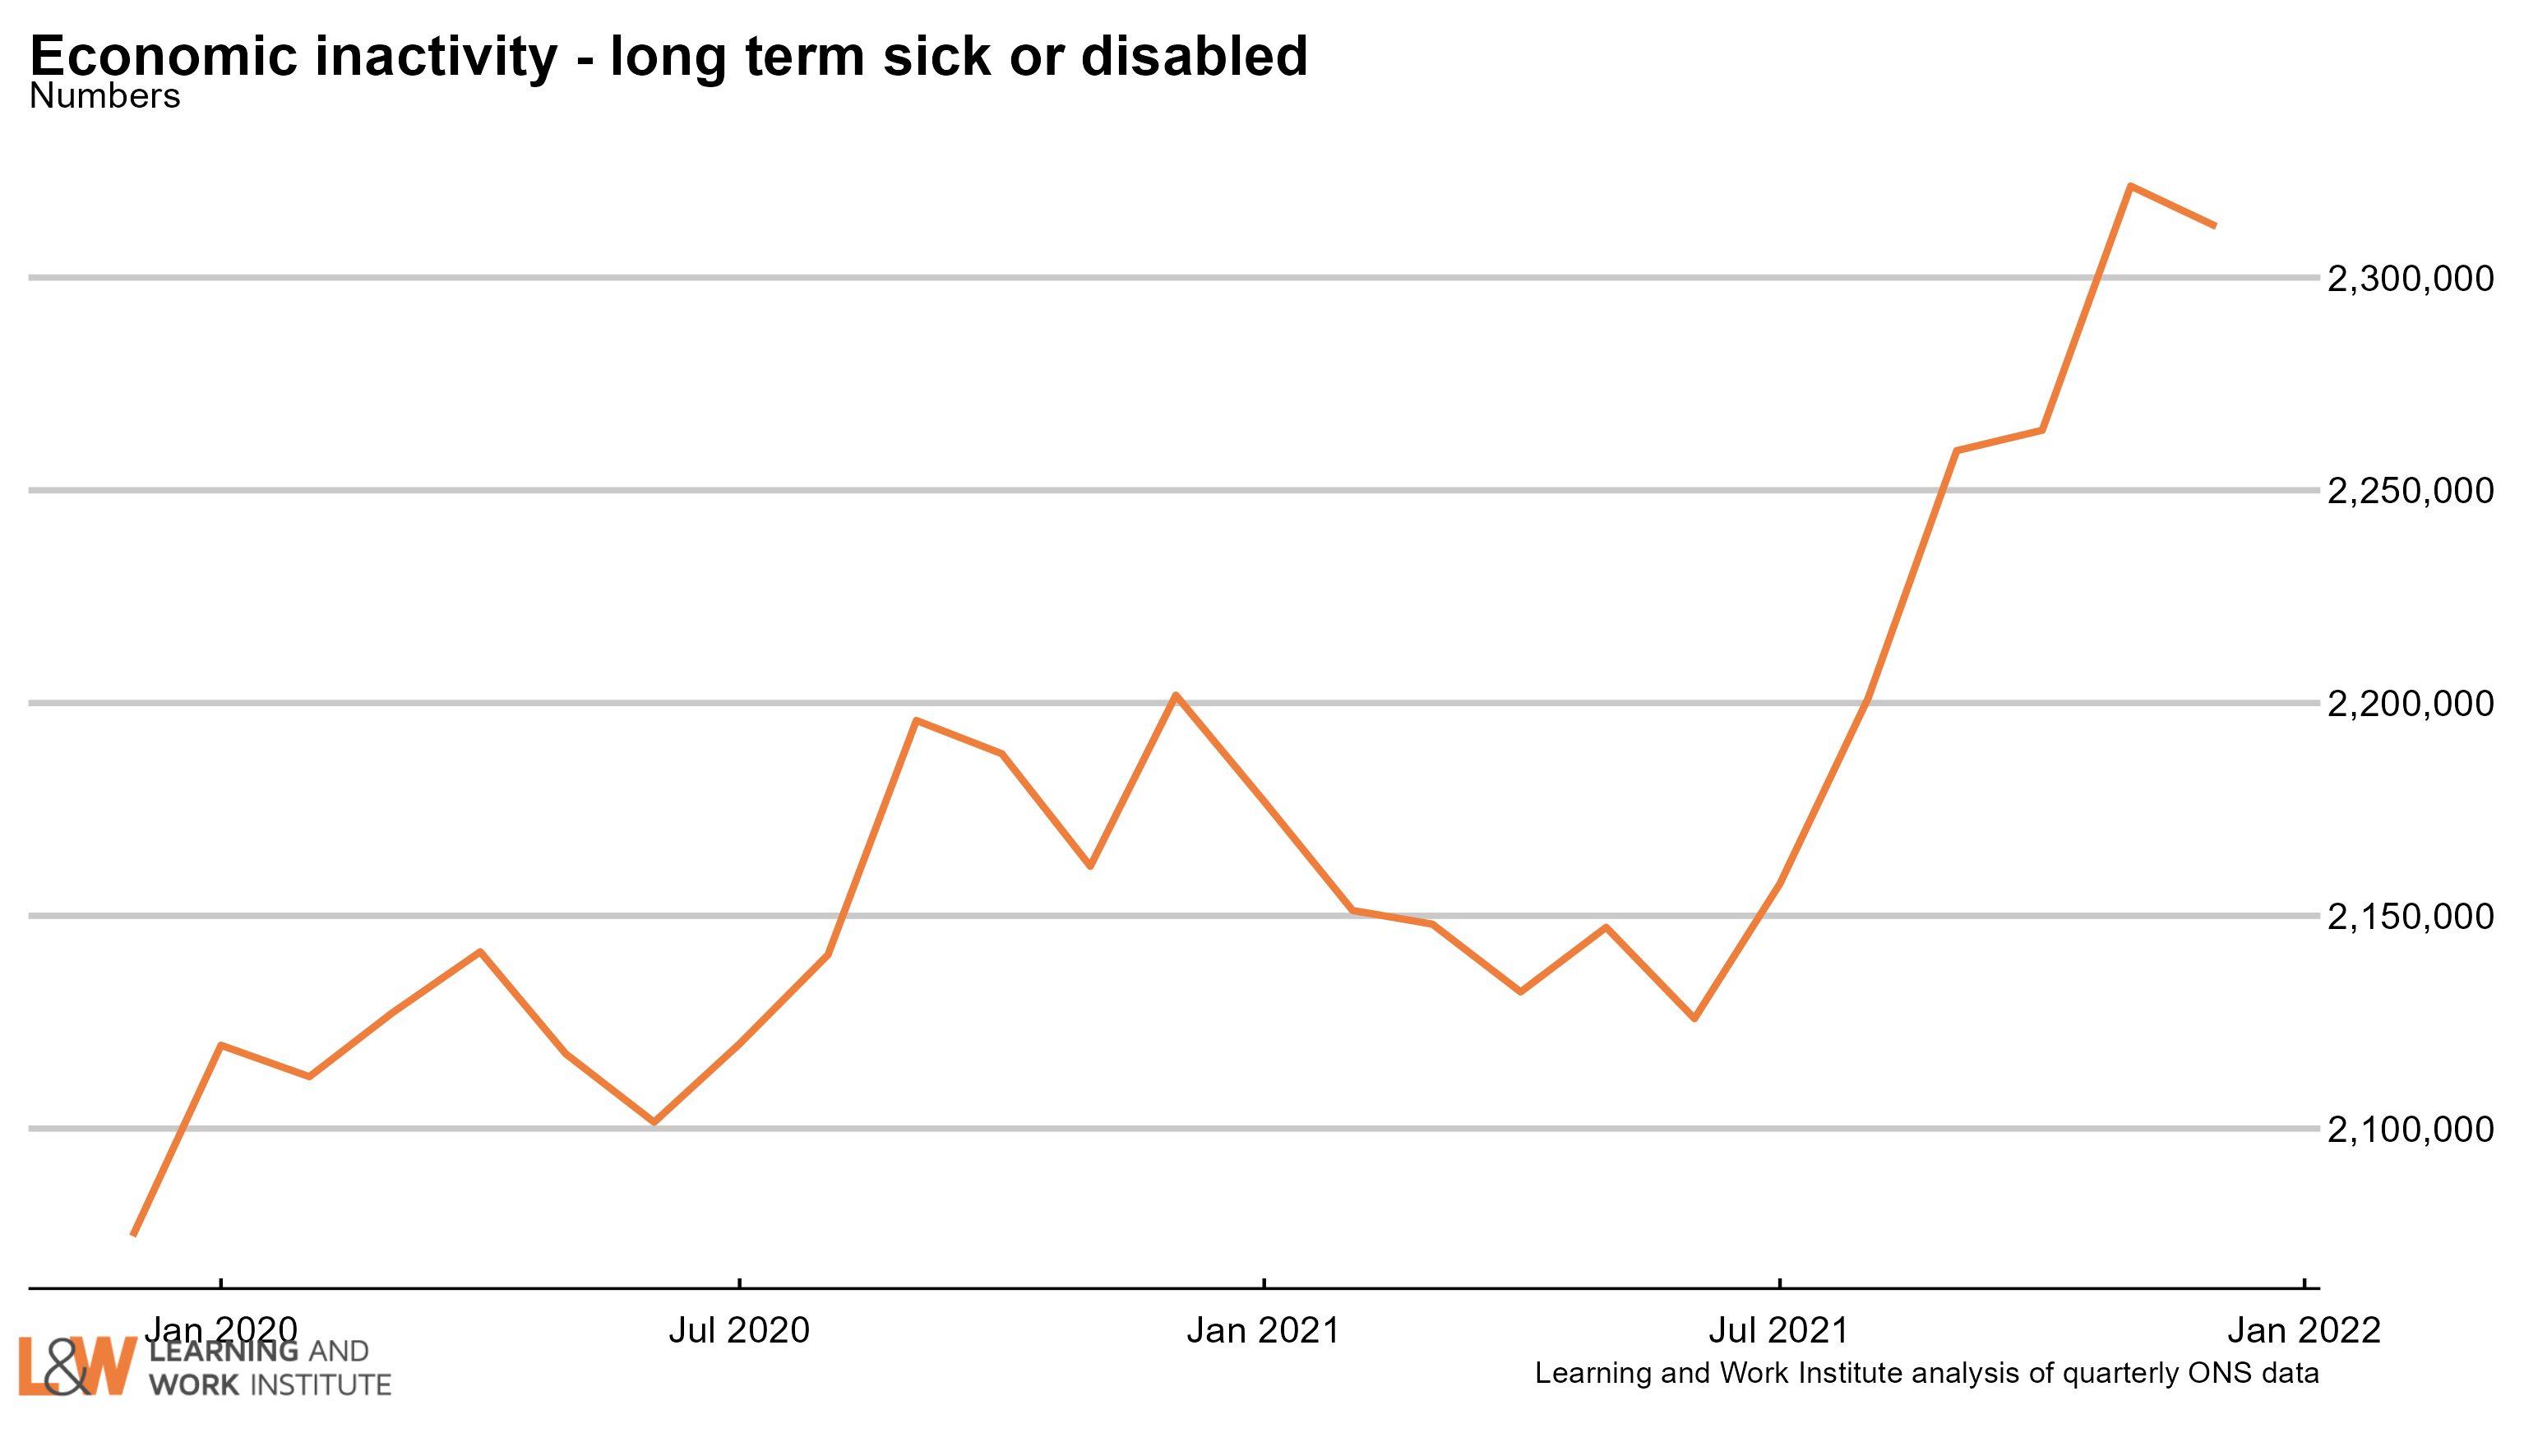 |
|
| Chart 16: Economic inactivity – people looking after family The survey figures showing those looking after family and not doing paid work or looking for paid work had been trending downwards but has started rising. 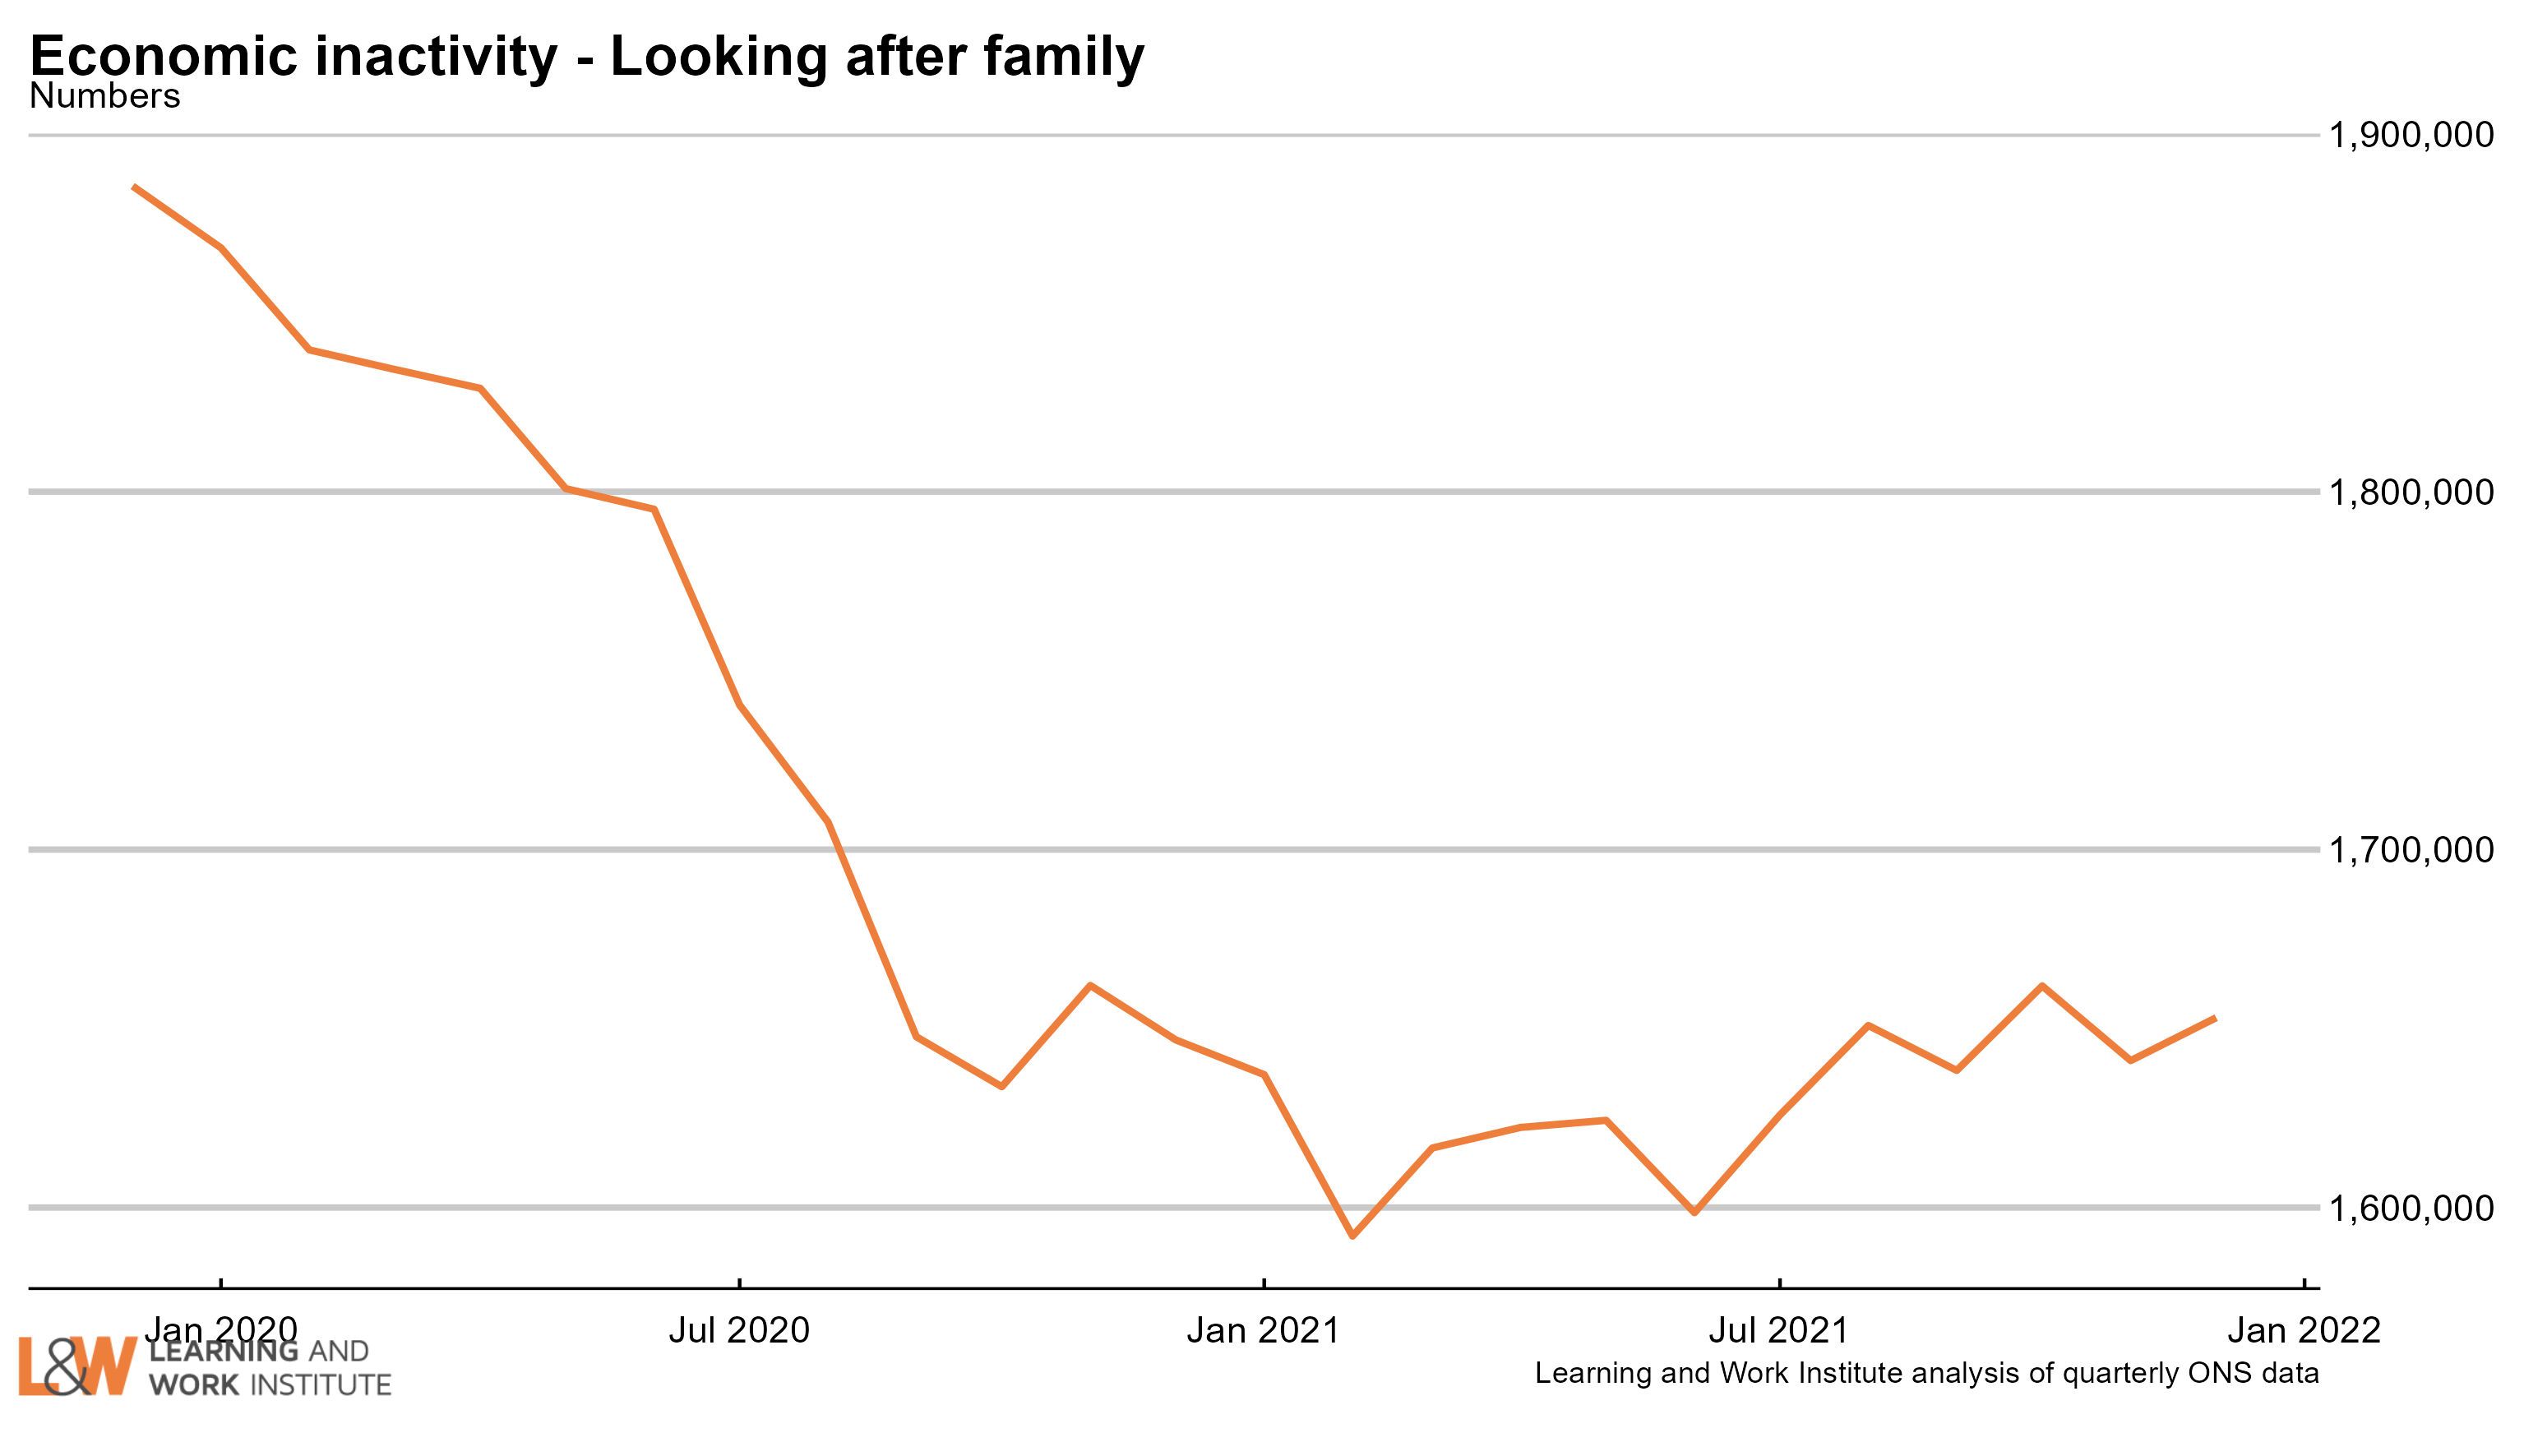 |
|
| Chart 17: Economic inactivity – other inactive In the Coronavirus period, people who were not working or looking for work due to Covid were included in this group. The number in this category increased sharply at the time, and has continued at a higher level than before the pandemic. The increase over the pre-pandemic level is now 187,000. 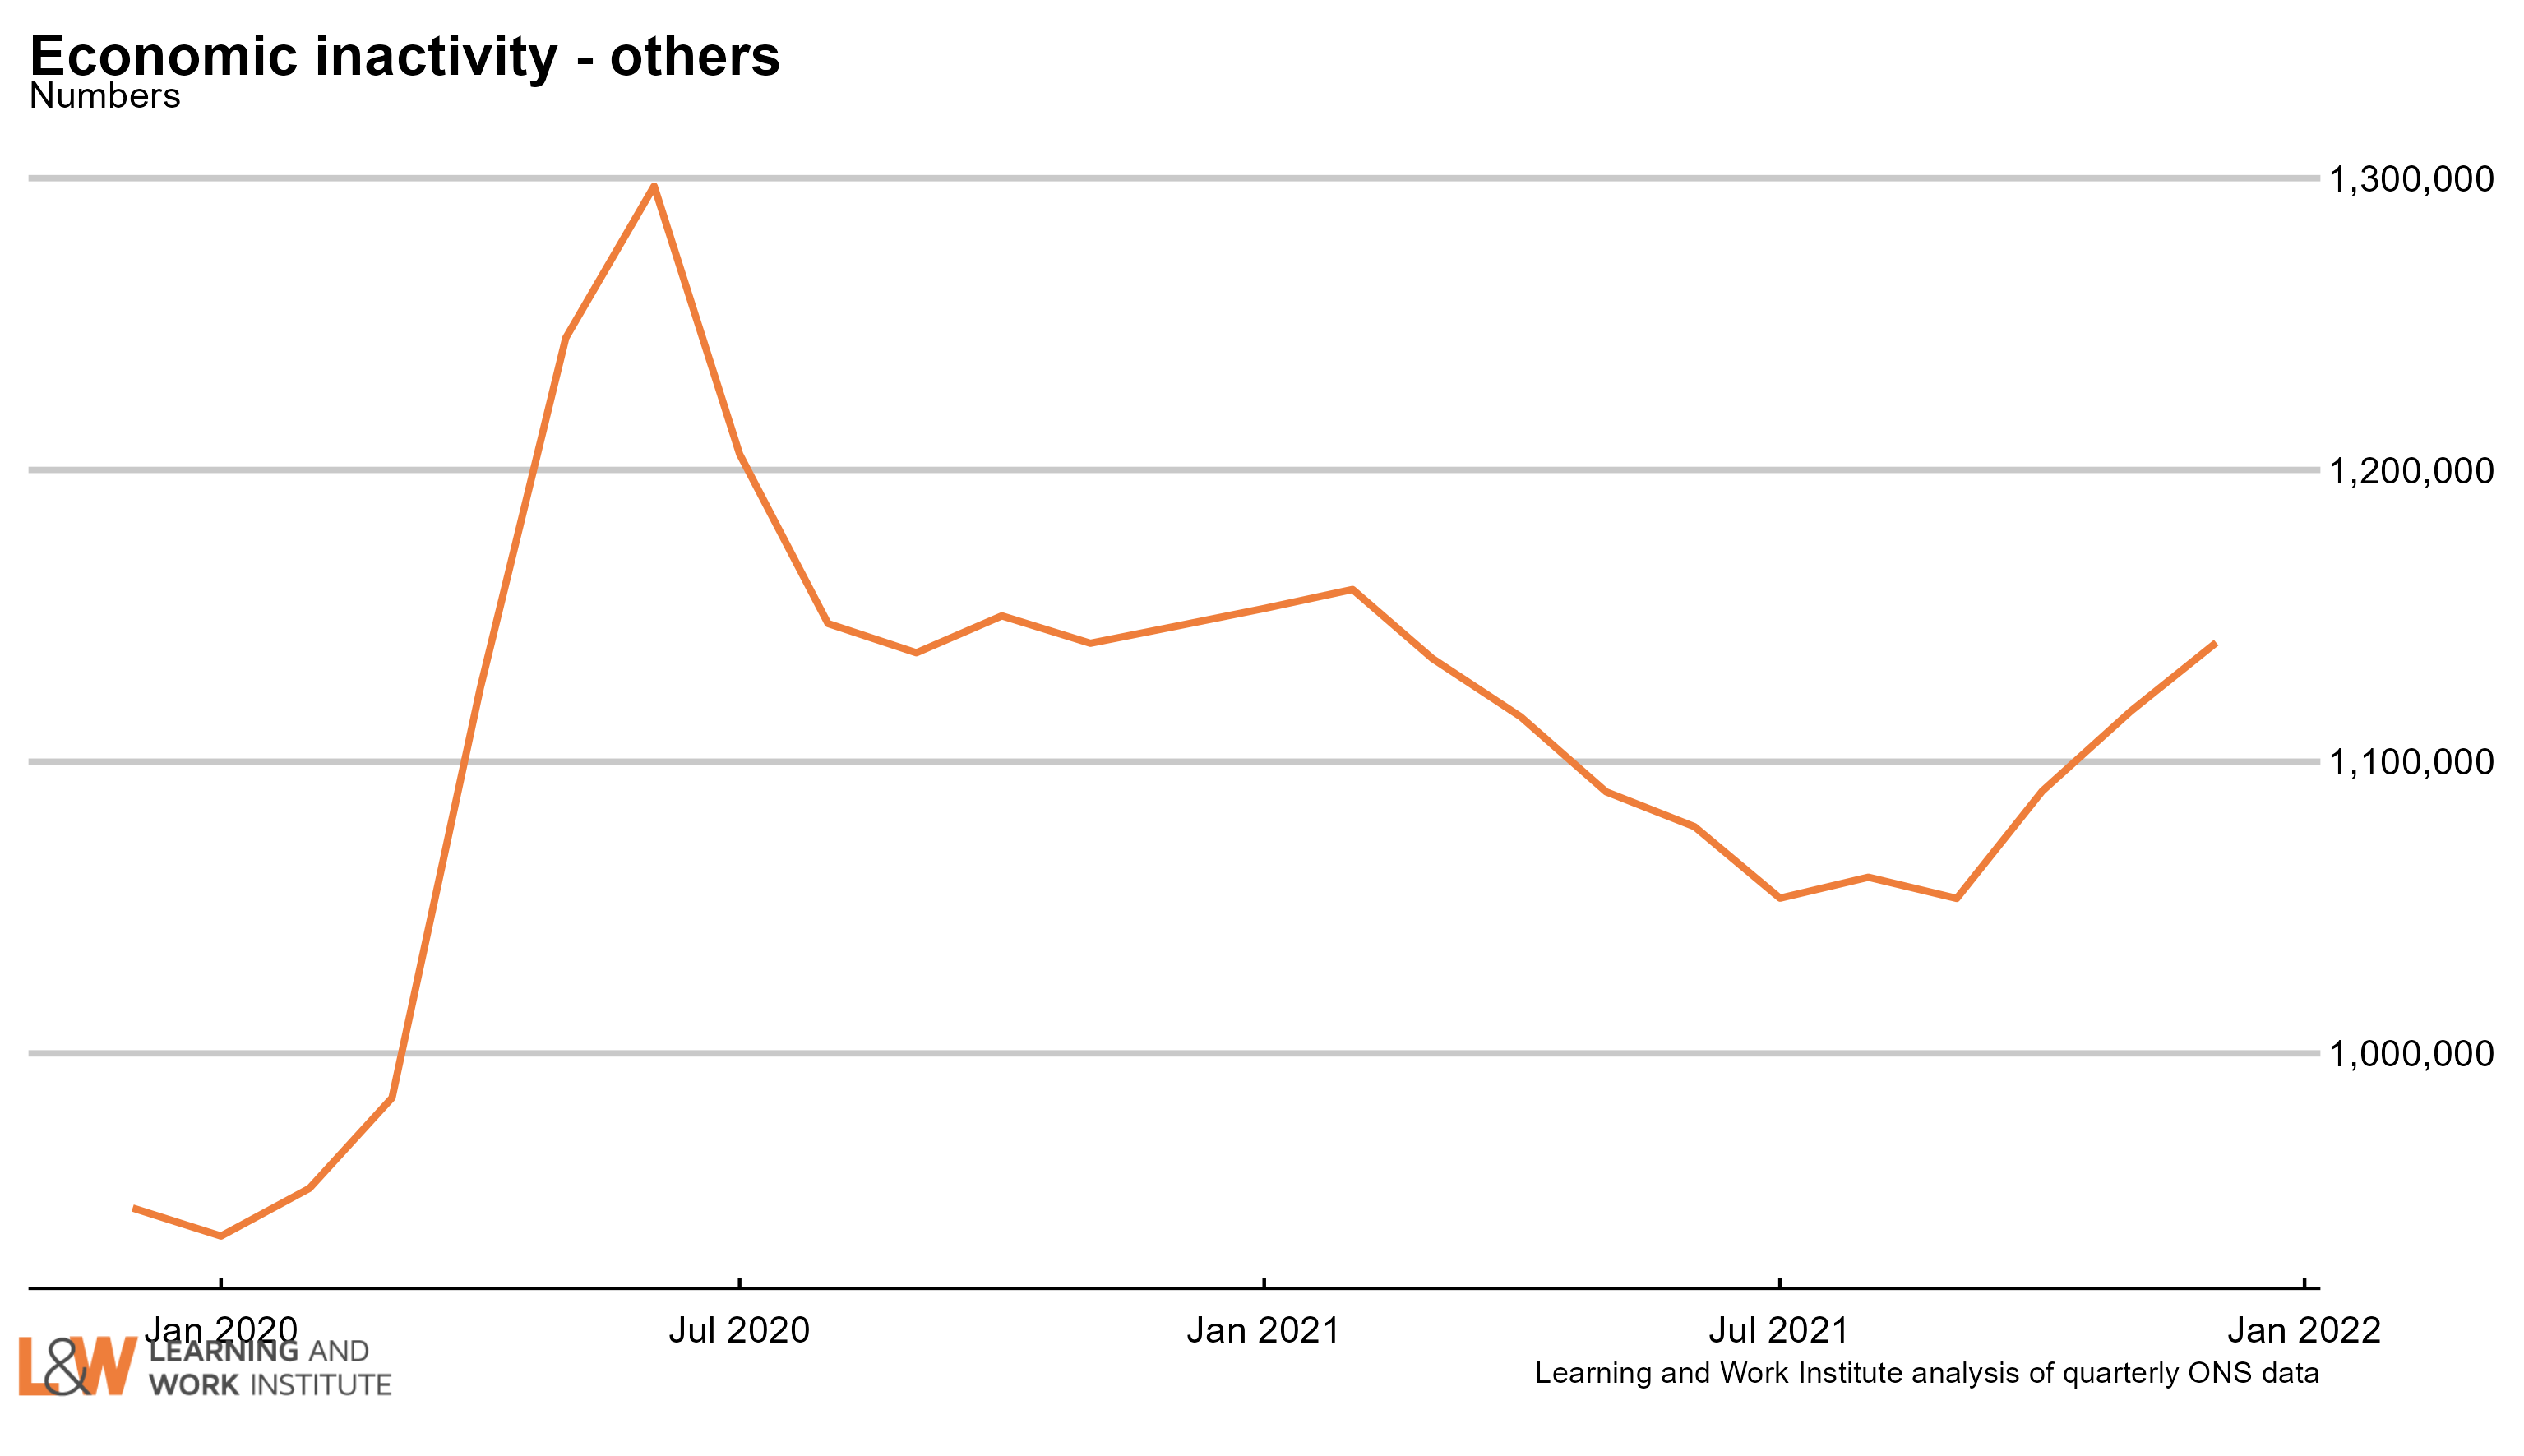 |
|
| Chart 18: Employment rate two-year change in regions – October to December 2021 This quarter, two regions showed a rise in the employment rate, led by London and Wales. The employment rate fell in 11 regions, led by the East Midlands and the South East. 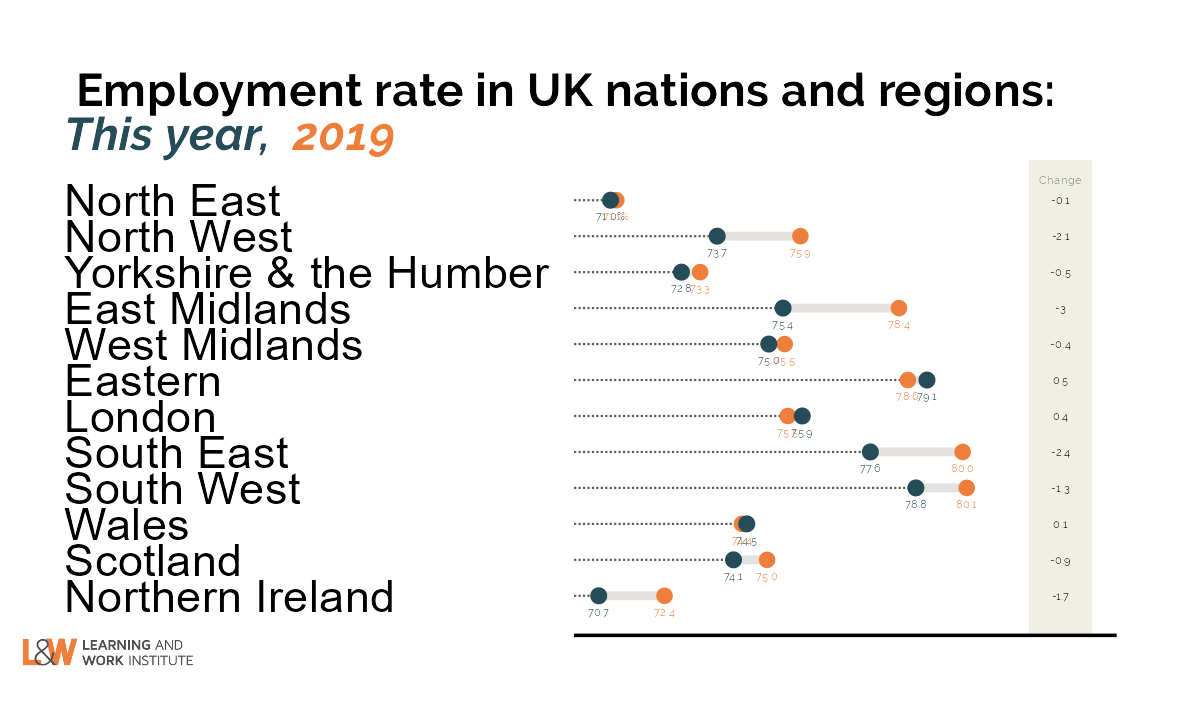 |
|
| Chart 19: Unemployment rate two-year change in regions – October to December 2021 This quarter, 8 regions showed a rise in the unemployment rate, led by London and the South East. The unemployment rate fell in 4 regions, led by Yorkshire & the Humber and the North East. 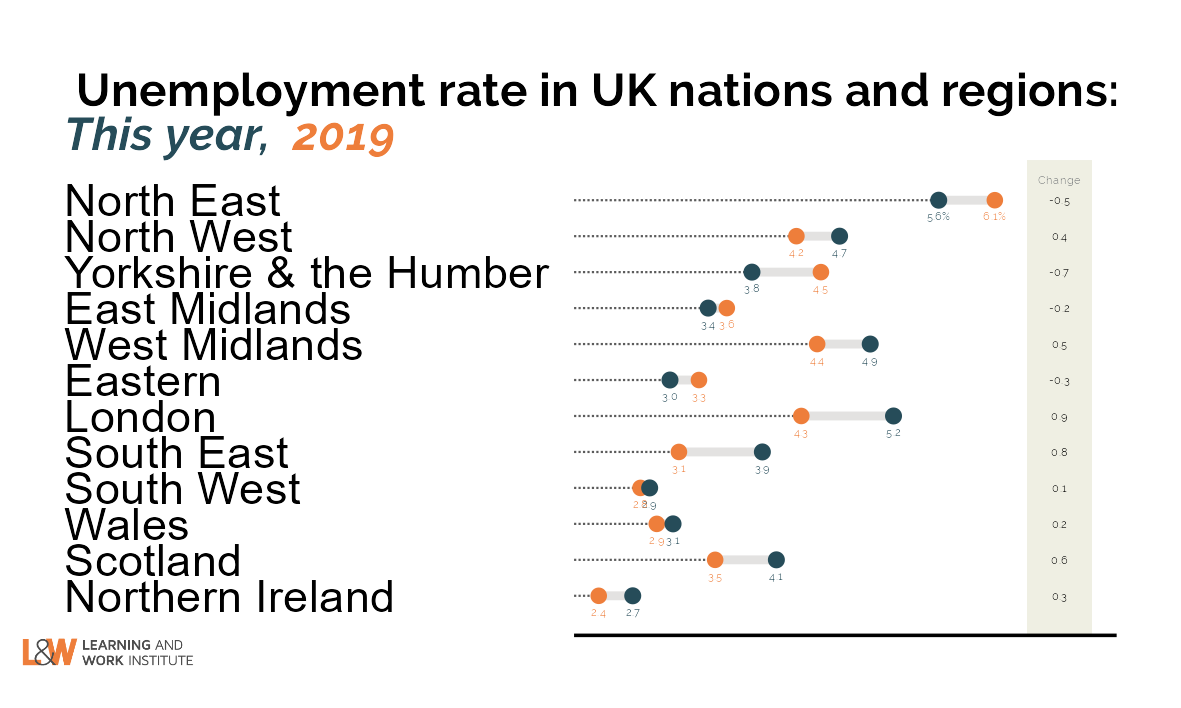 |
|
| Chart 20: Inactivity rate two-year change in regions – October to December 2021 This quarter, 9 regions showed a rise in the inactivity rate, led by the East Midlands and the North West. The inactivity rate fell in 3 regions, led by London and the Eastern region. 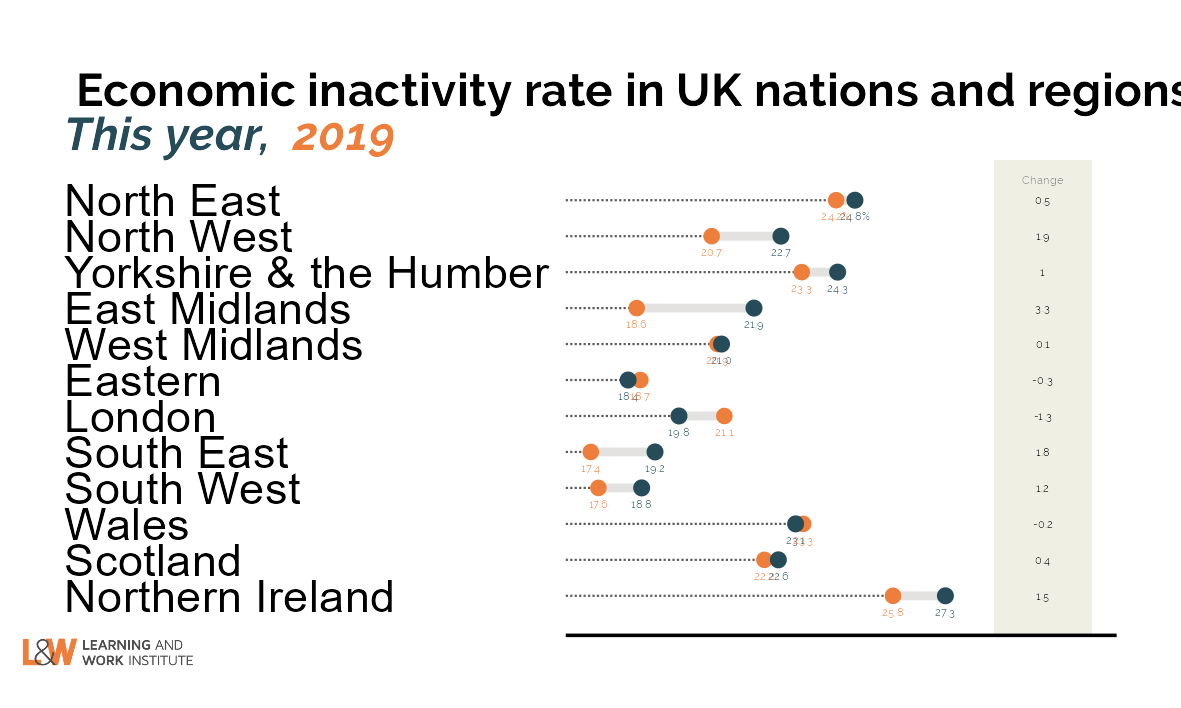 |
|
|
This newsletter is produced by Learning and Work Institute and keeps readers up to date on a wide range of learning and work issues. |
|
 |
|