 |
|
| Making learning and work count Labour market LIVE from Learning and Work Institute 18 May 2021
Learning and Work Institute comment |
|
| Chart 1: UK unemployment (ILO) The latest unemployment rate has fallen by 0.3 percentage points to 4.8%. 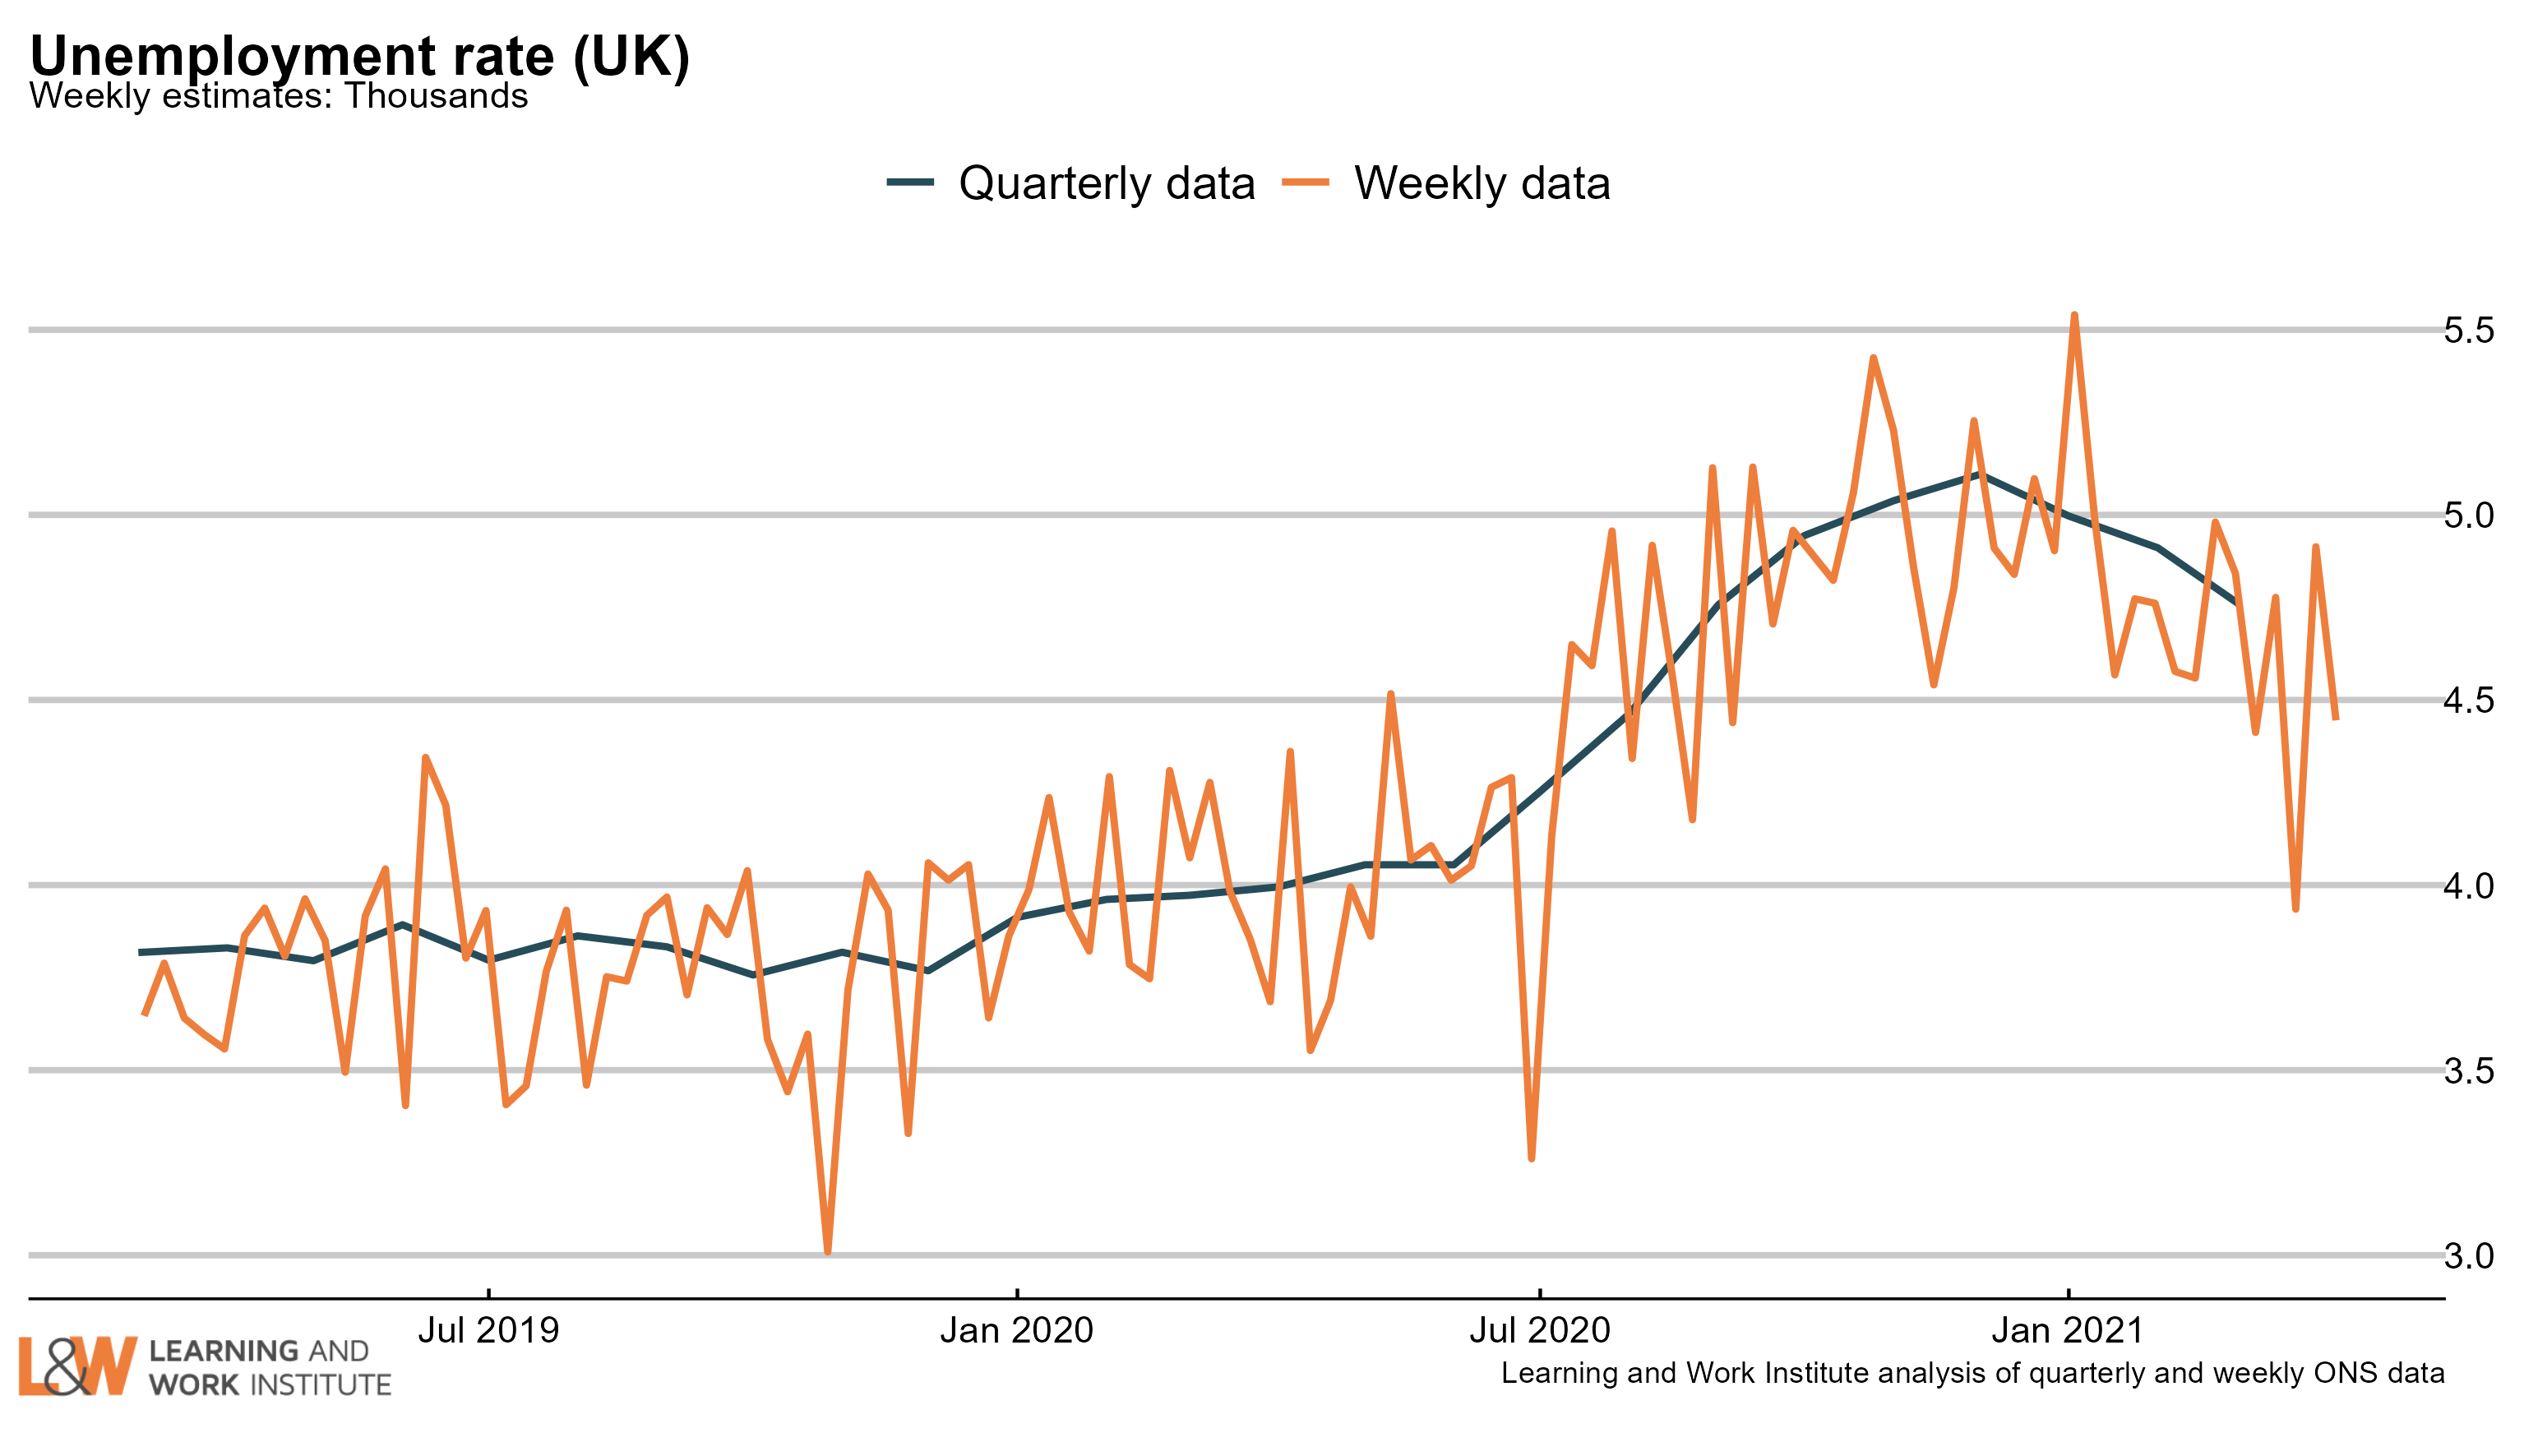 |
|
| Chart 2: The claimant count and UK unemployment compared The number of unemployed people who are claiming unemployment-related benefits is now 1,005,800 higher than the number of unemployed in the official measure. 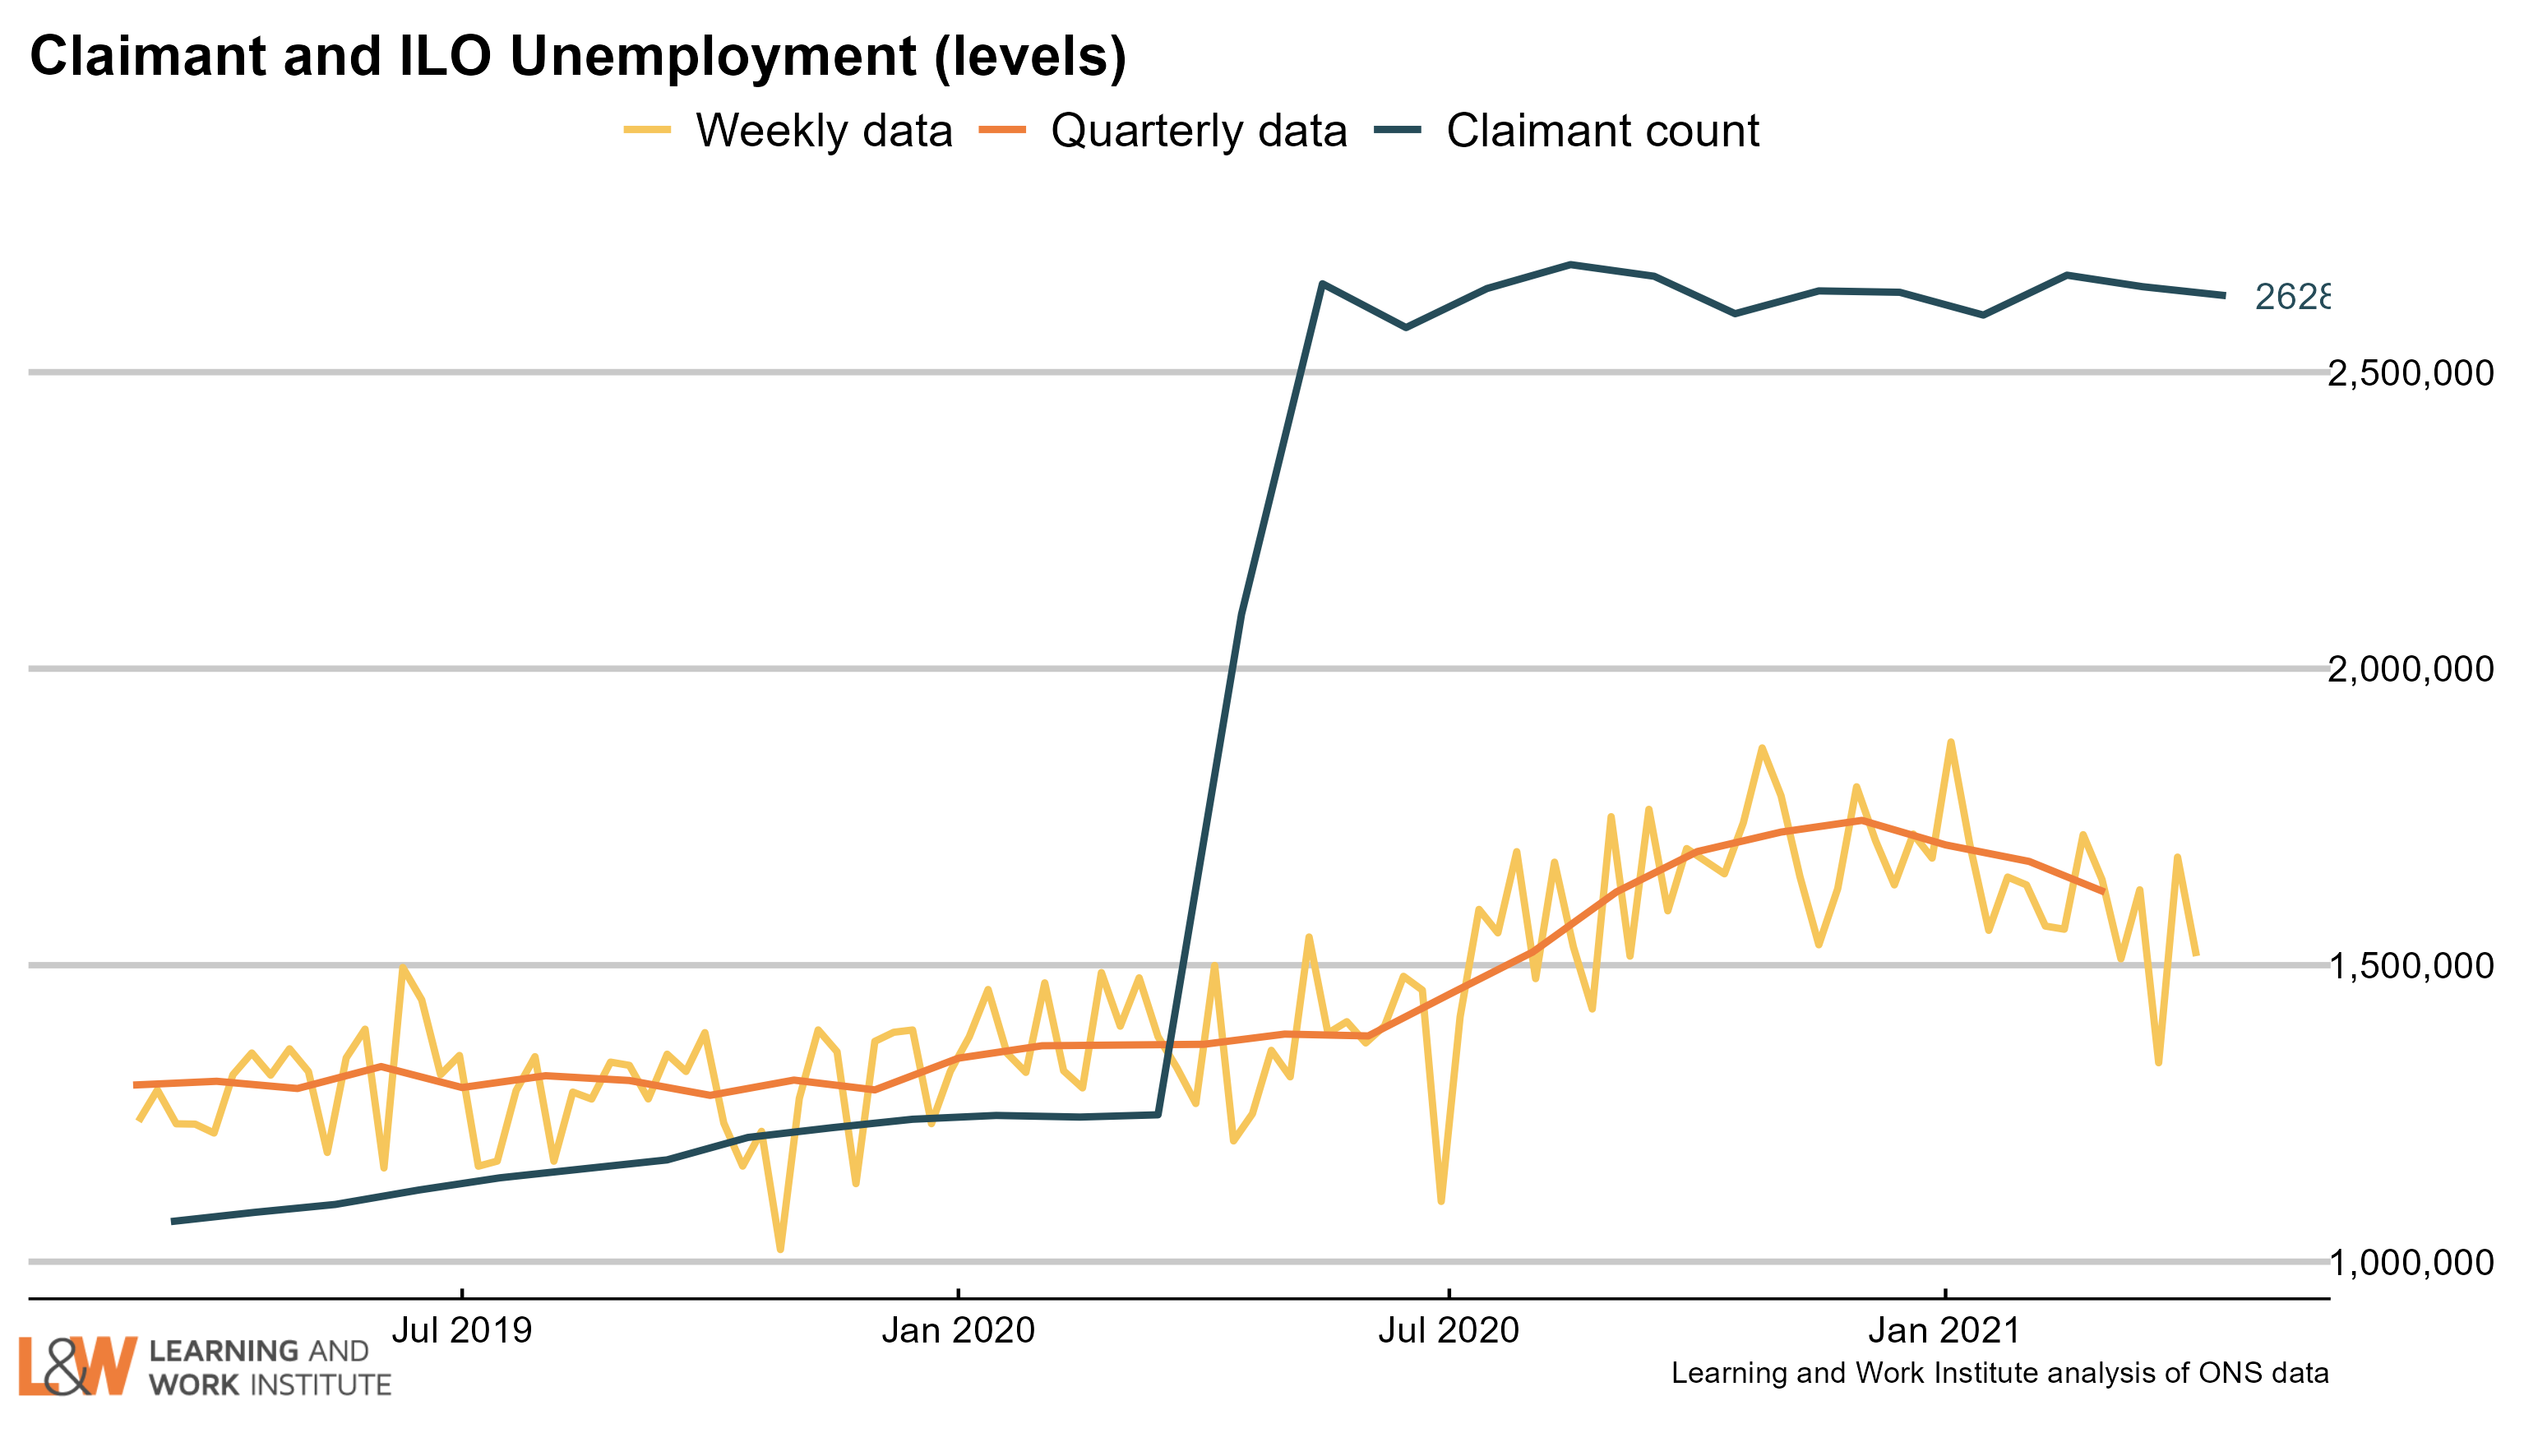 |
|
| Chart 3: Youth unemployment The number of unemployed young people fell by 39,000 since last month’s figures, to 536,000. Meanwhile, the number of young Universal Credit or Jobseeker’s Allowance claimants is down by last month by just 7,300, to 502,900. 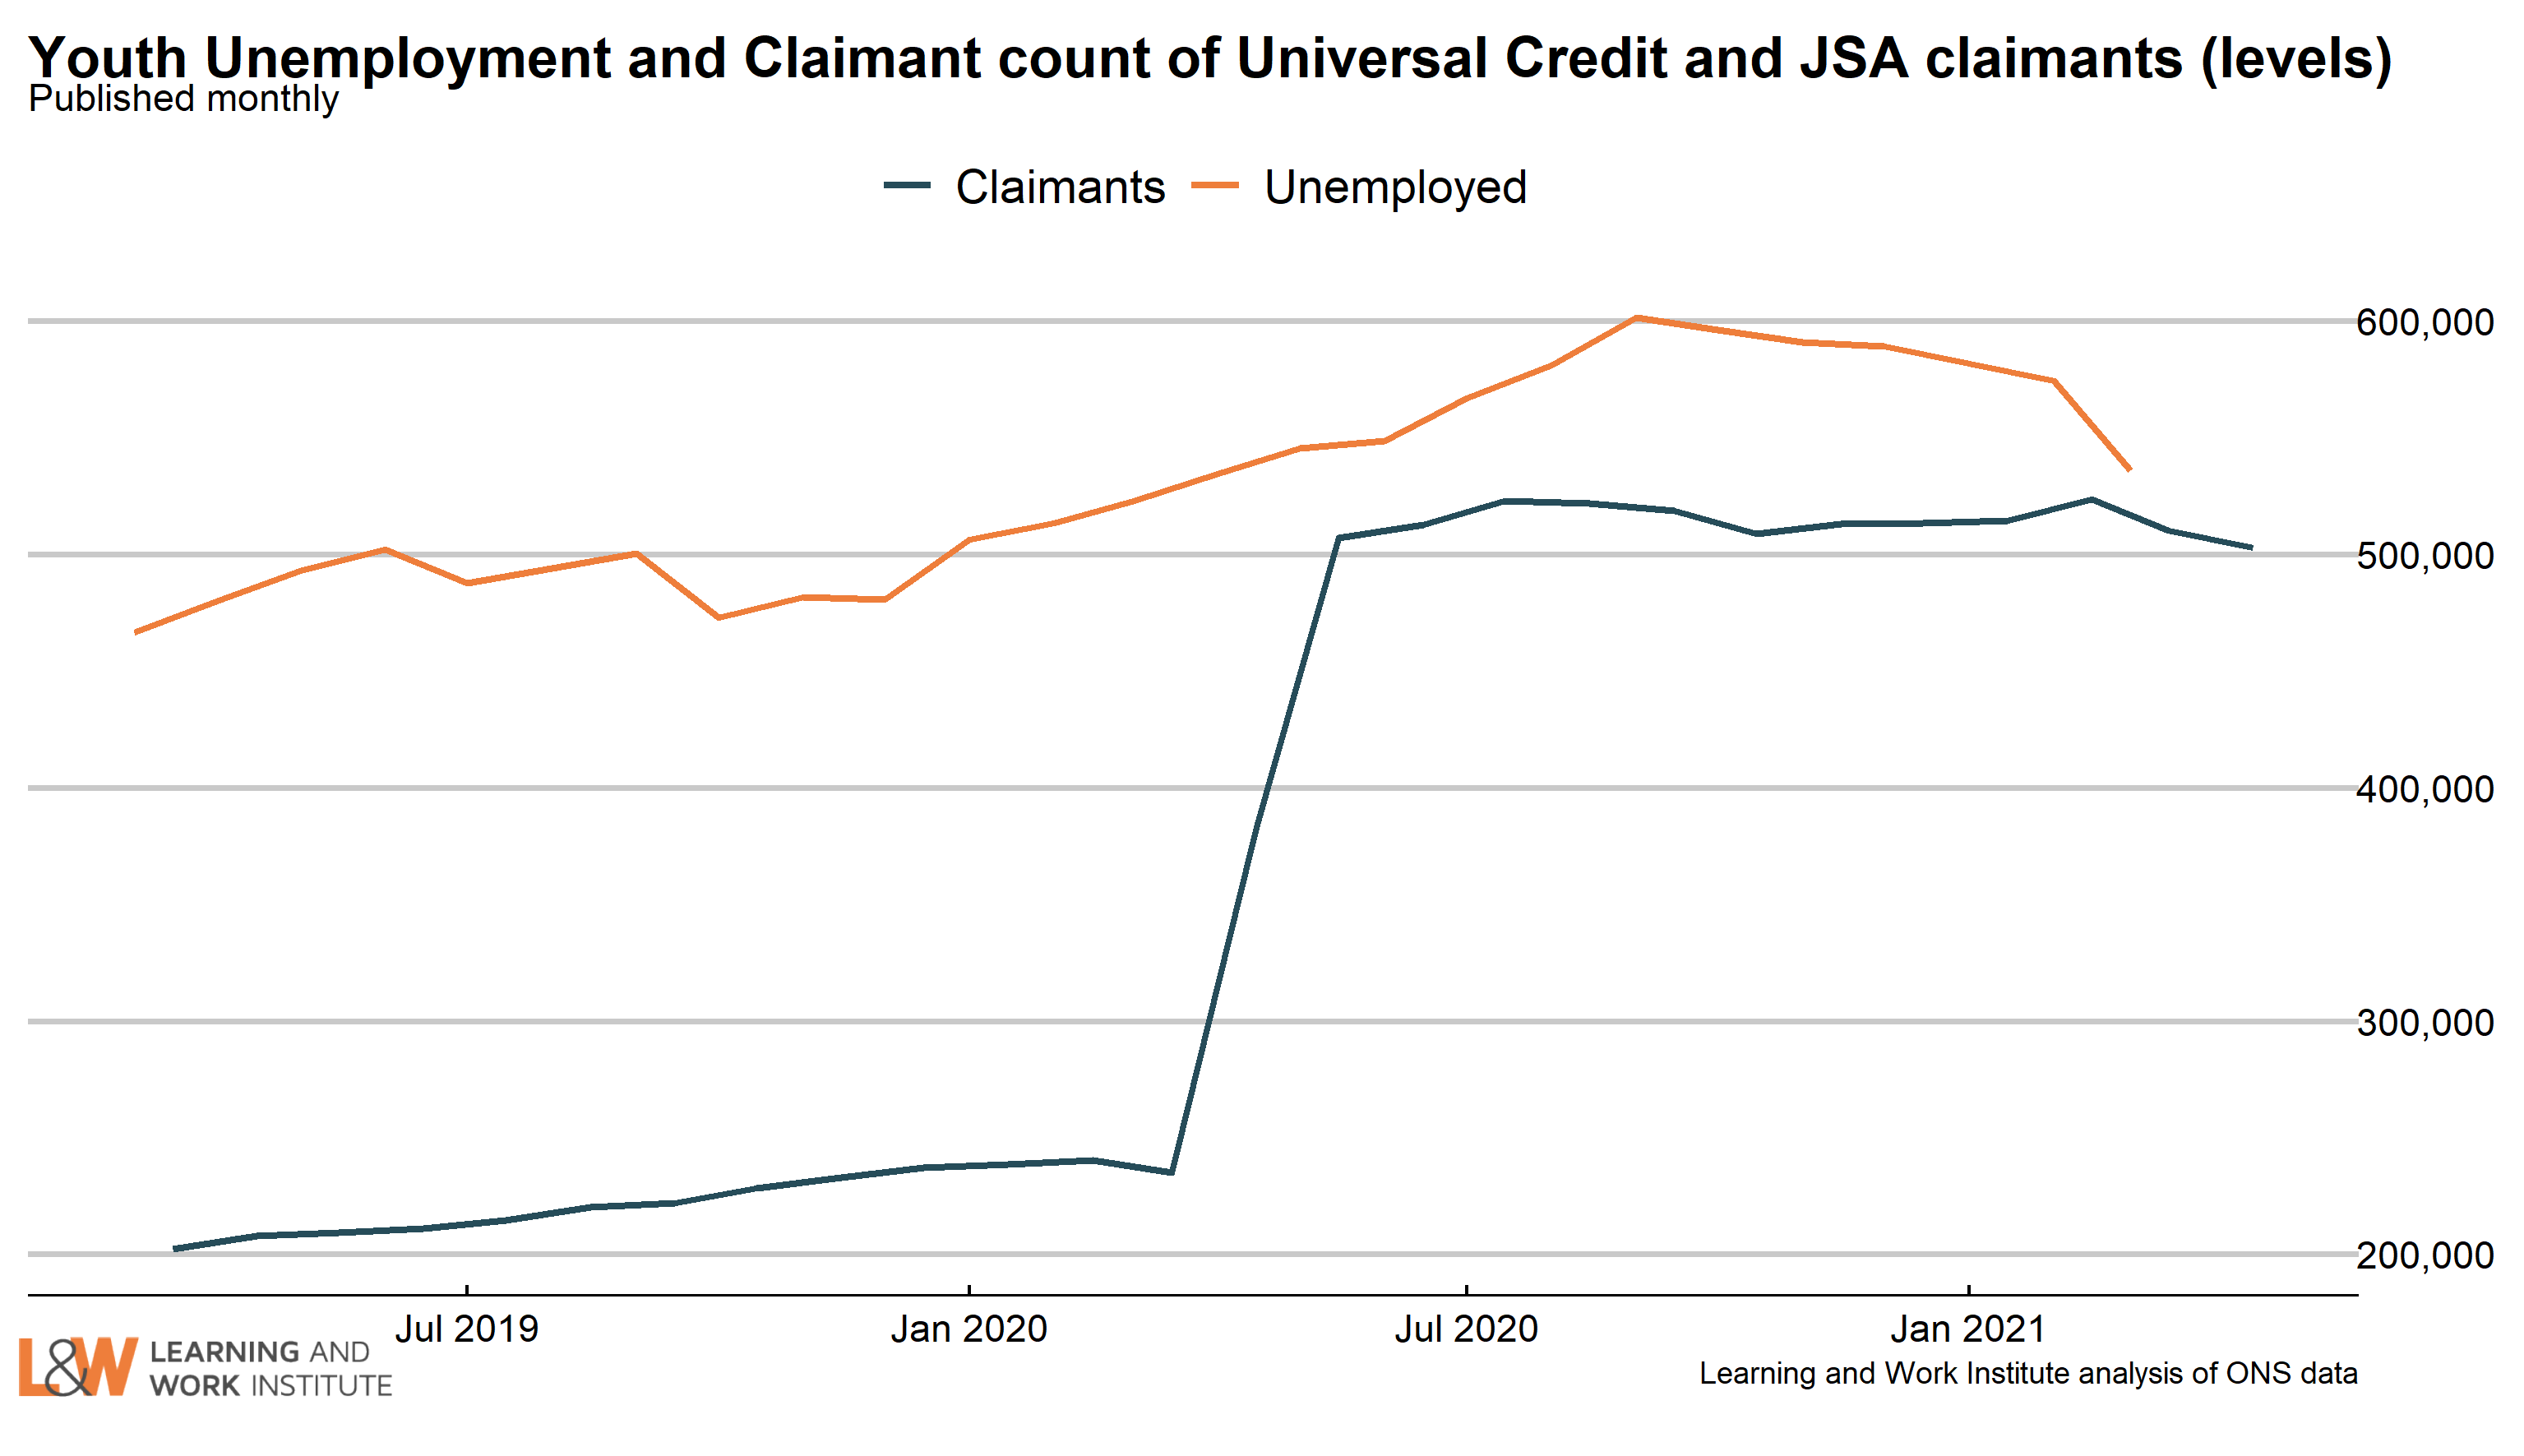 |
|
| Chart 4: Young people not in employment, full-time education or training The number of out of work young people who are not in full-time education (955,000) fell by 44,000 in the last quarter , or 4.4%. The fall was largely among the unemployed, with the number of inactive young people not in full-time education or training falling more slowly. 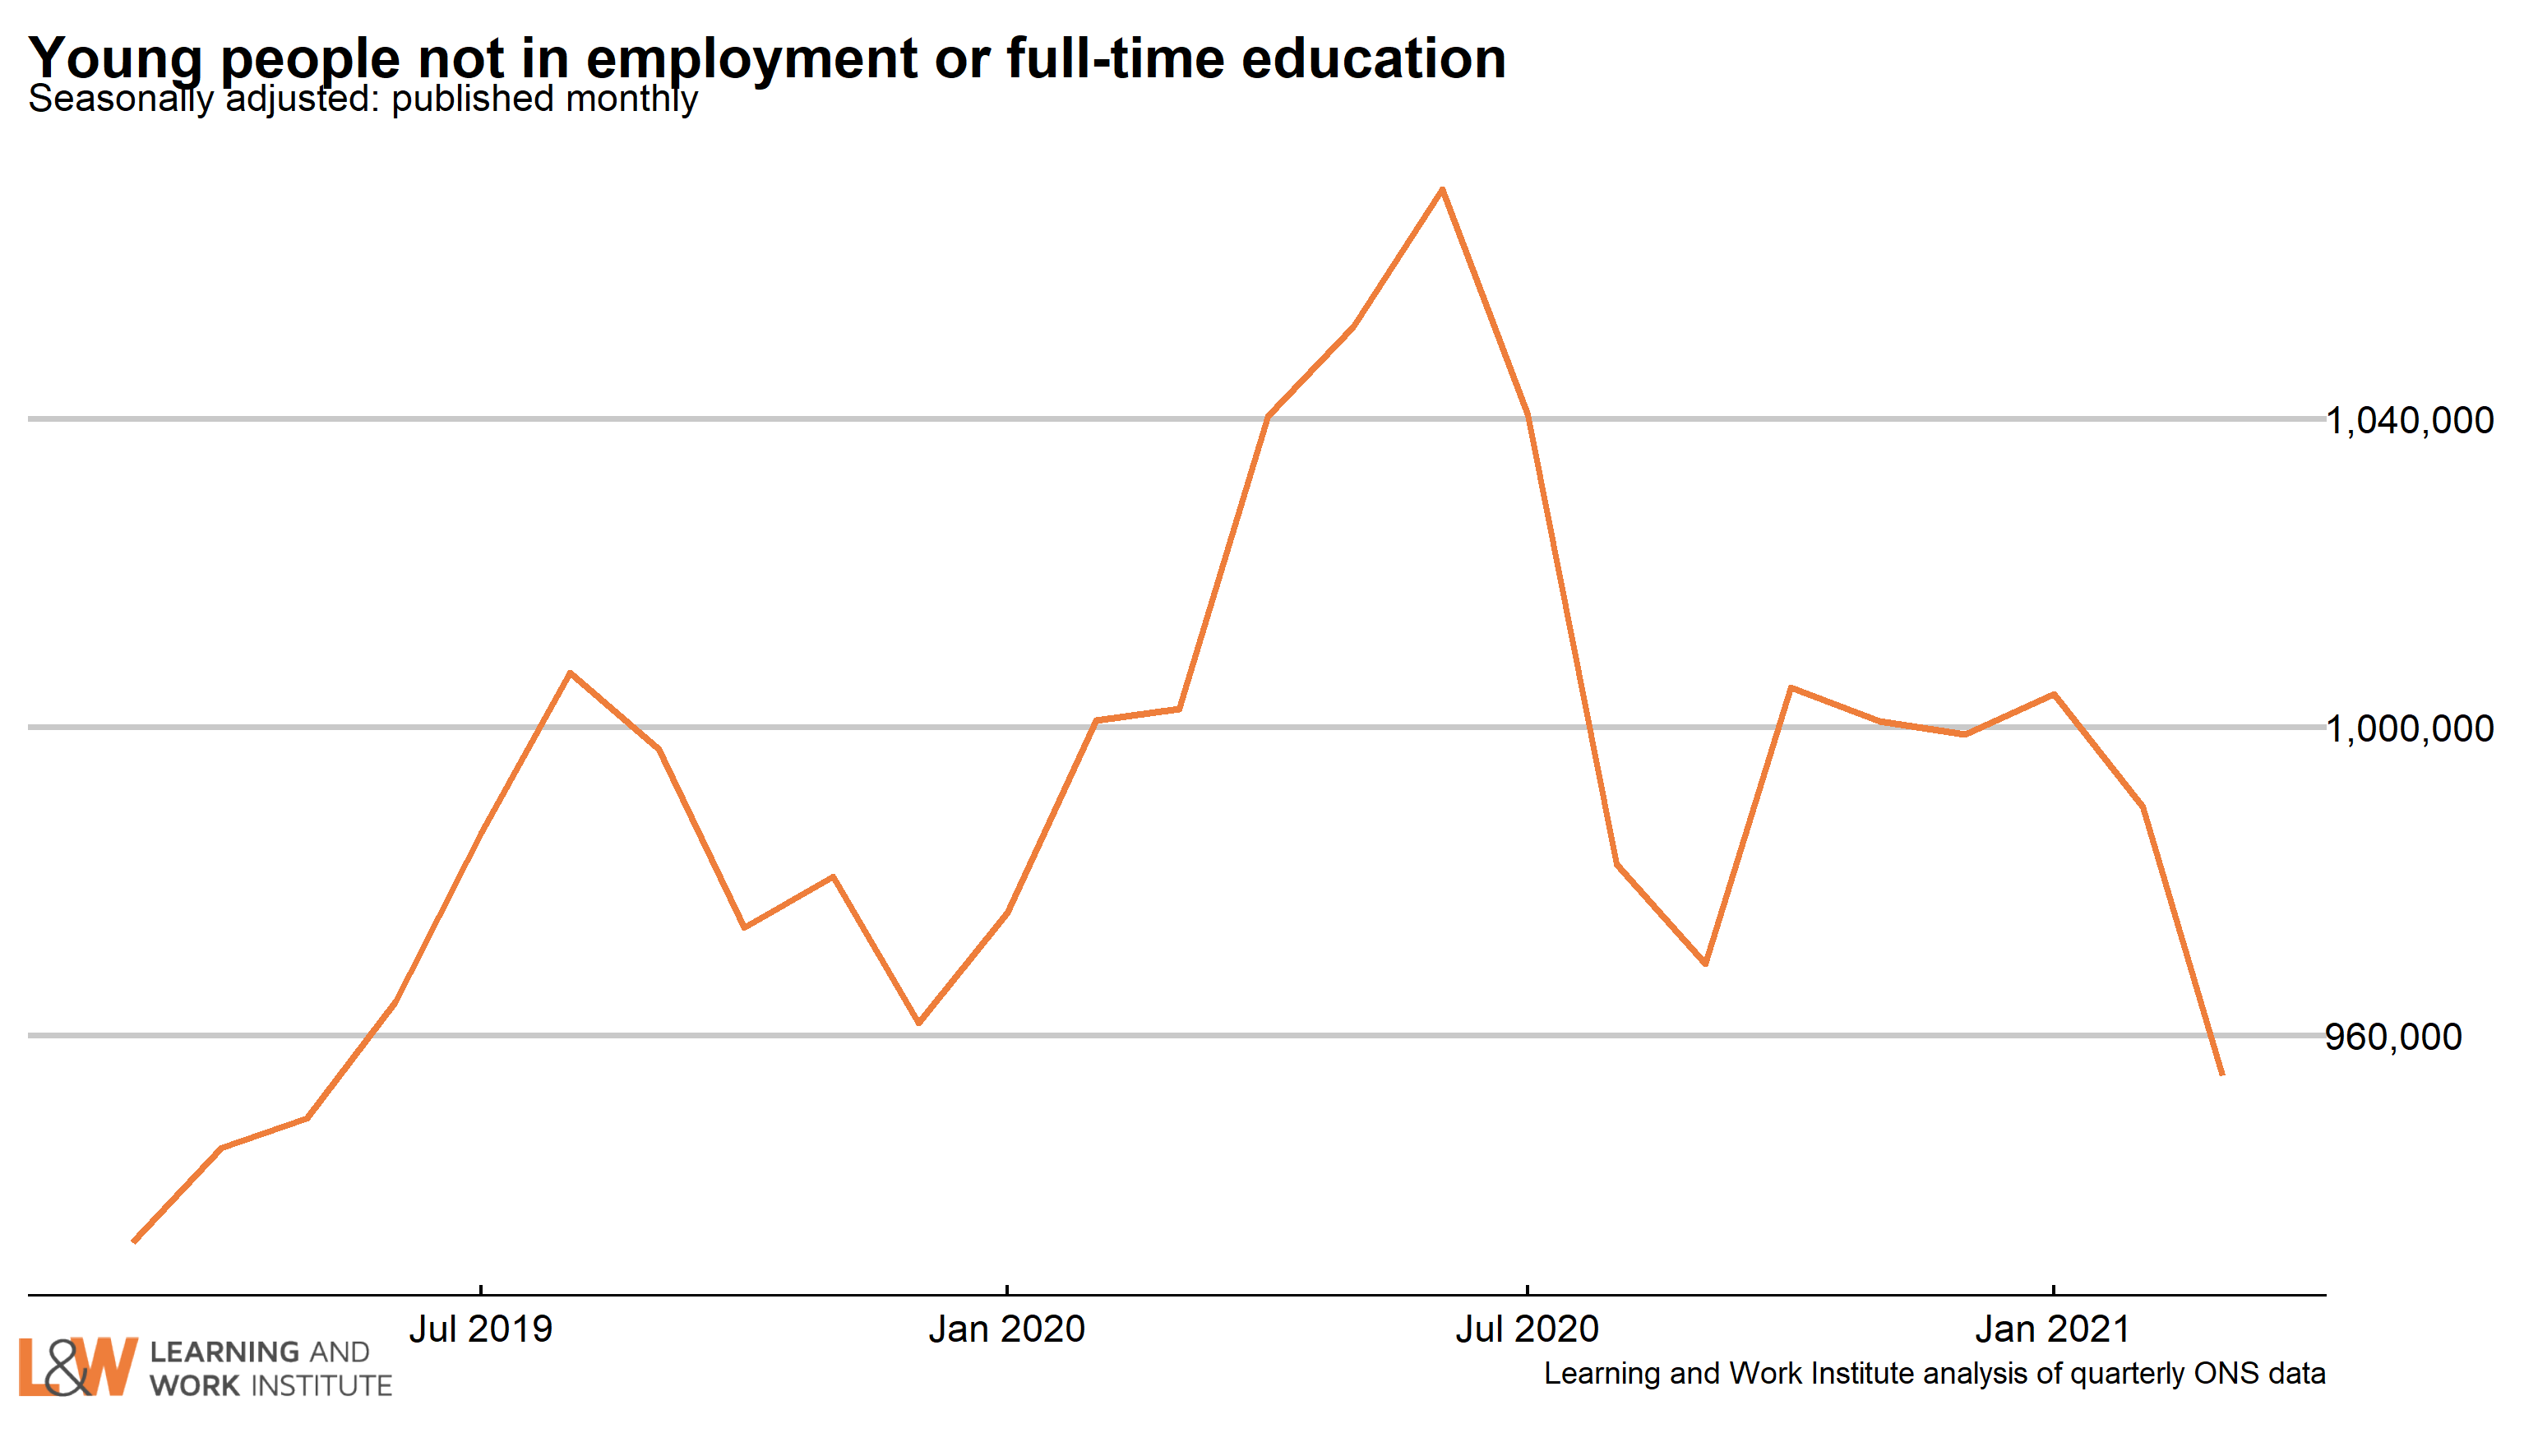 |
|
| Chart 5: Youth long-term unemployment (six months and over, 16-24) Youth long-term unemployment (which can include students) has risen by 16,000 over the last quarter (while falling 8,000 in the last month) and is now 212,000. 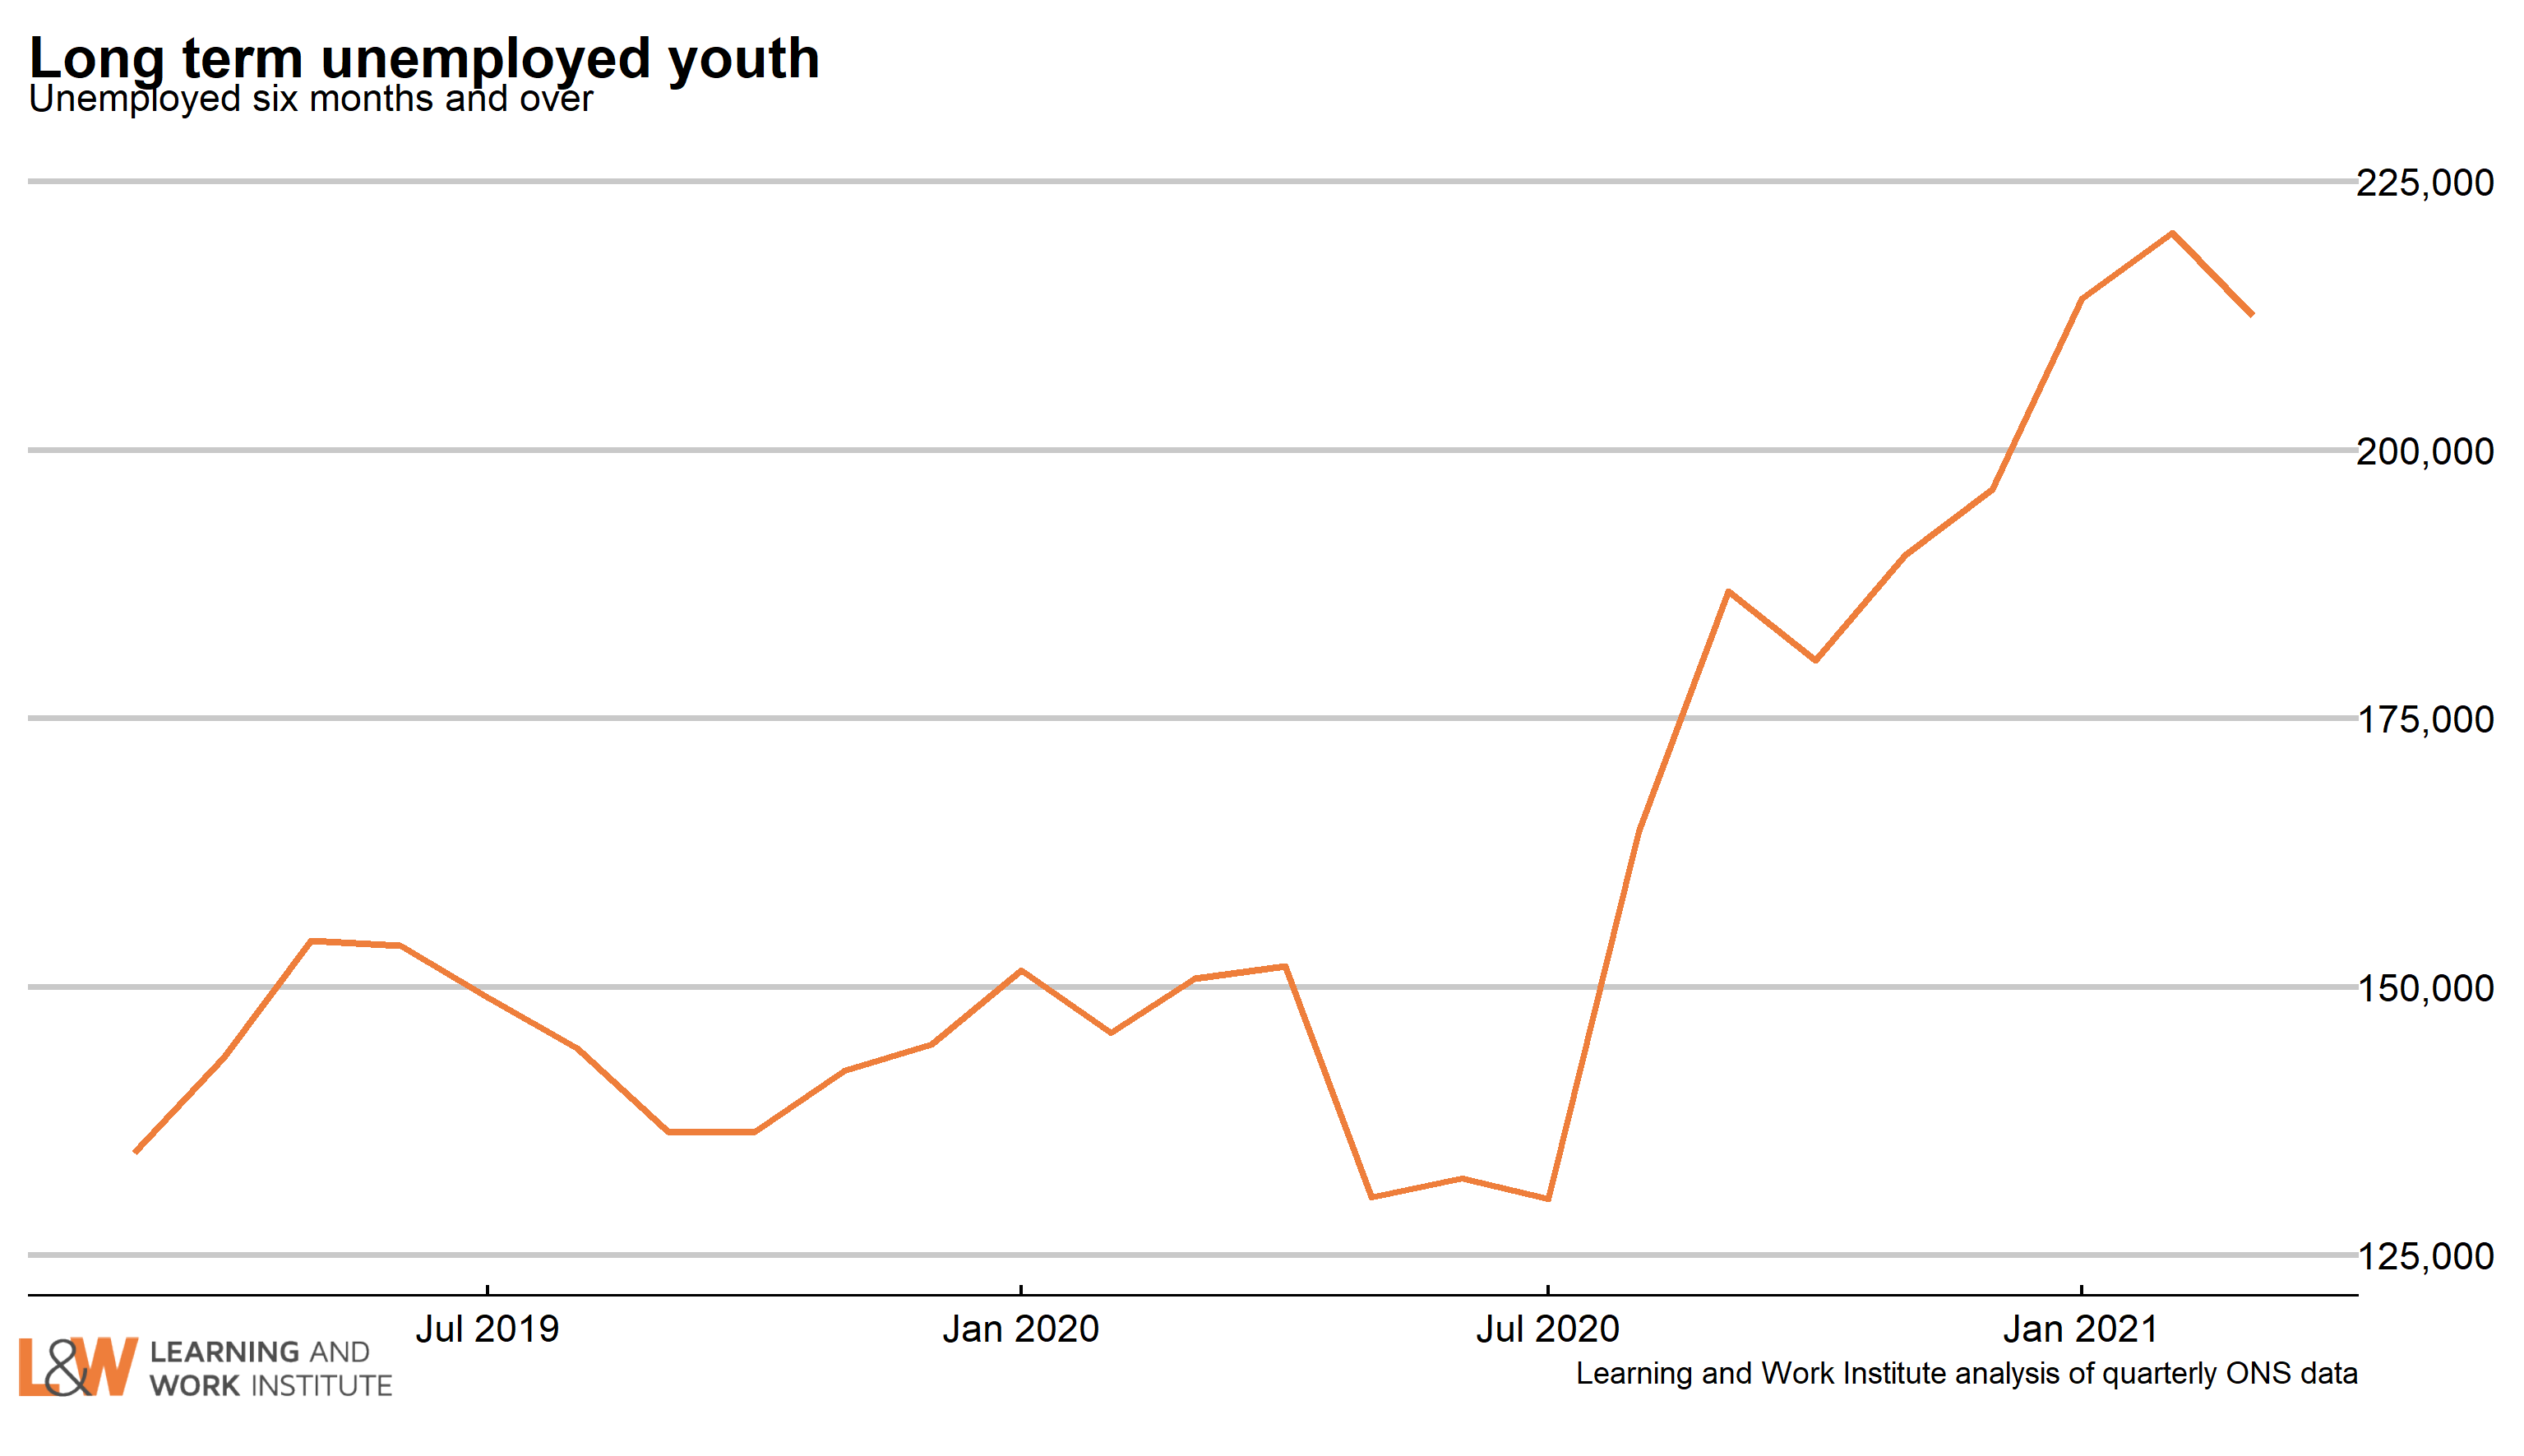 |
|
| Chart 6: Adult long-term unemployment (12 months and over, 25+) Adult long-term unemployment on the survey measure is now 272,000. Those who lost their jobs with the first lockdown are not yet in these Jan-March figures, though by now (May) they will have passed the 12-month threshold. The fall in long-term unemployment numbers in the first lockdown period of 2020 (April to June 2020) could be due to long-term unemployed people stopping looking for work at that time. Later, they then resumed looking for work and may have counted their unemployment from when they lost their job, missing out the lockdown period - if so they would have come back into the figures. 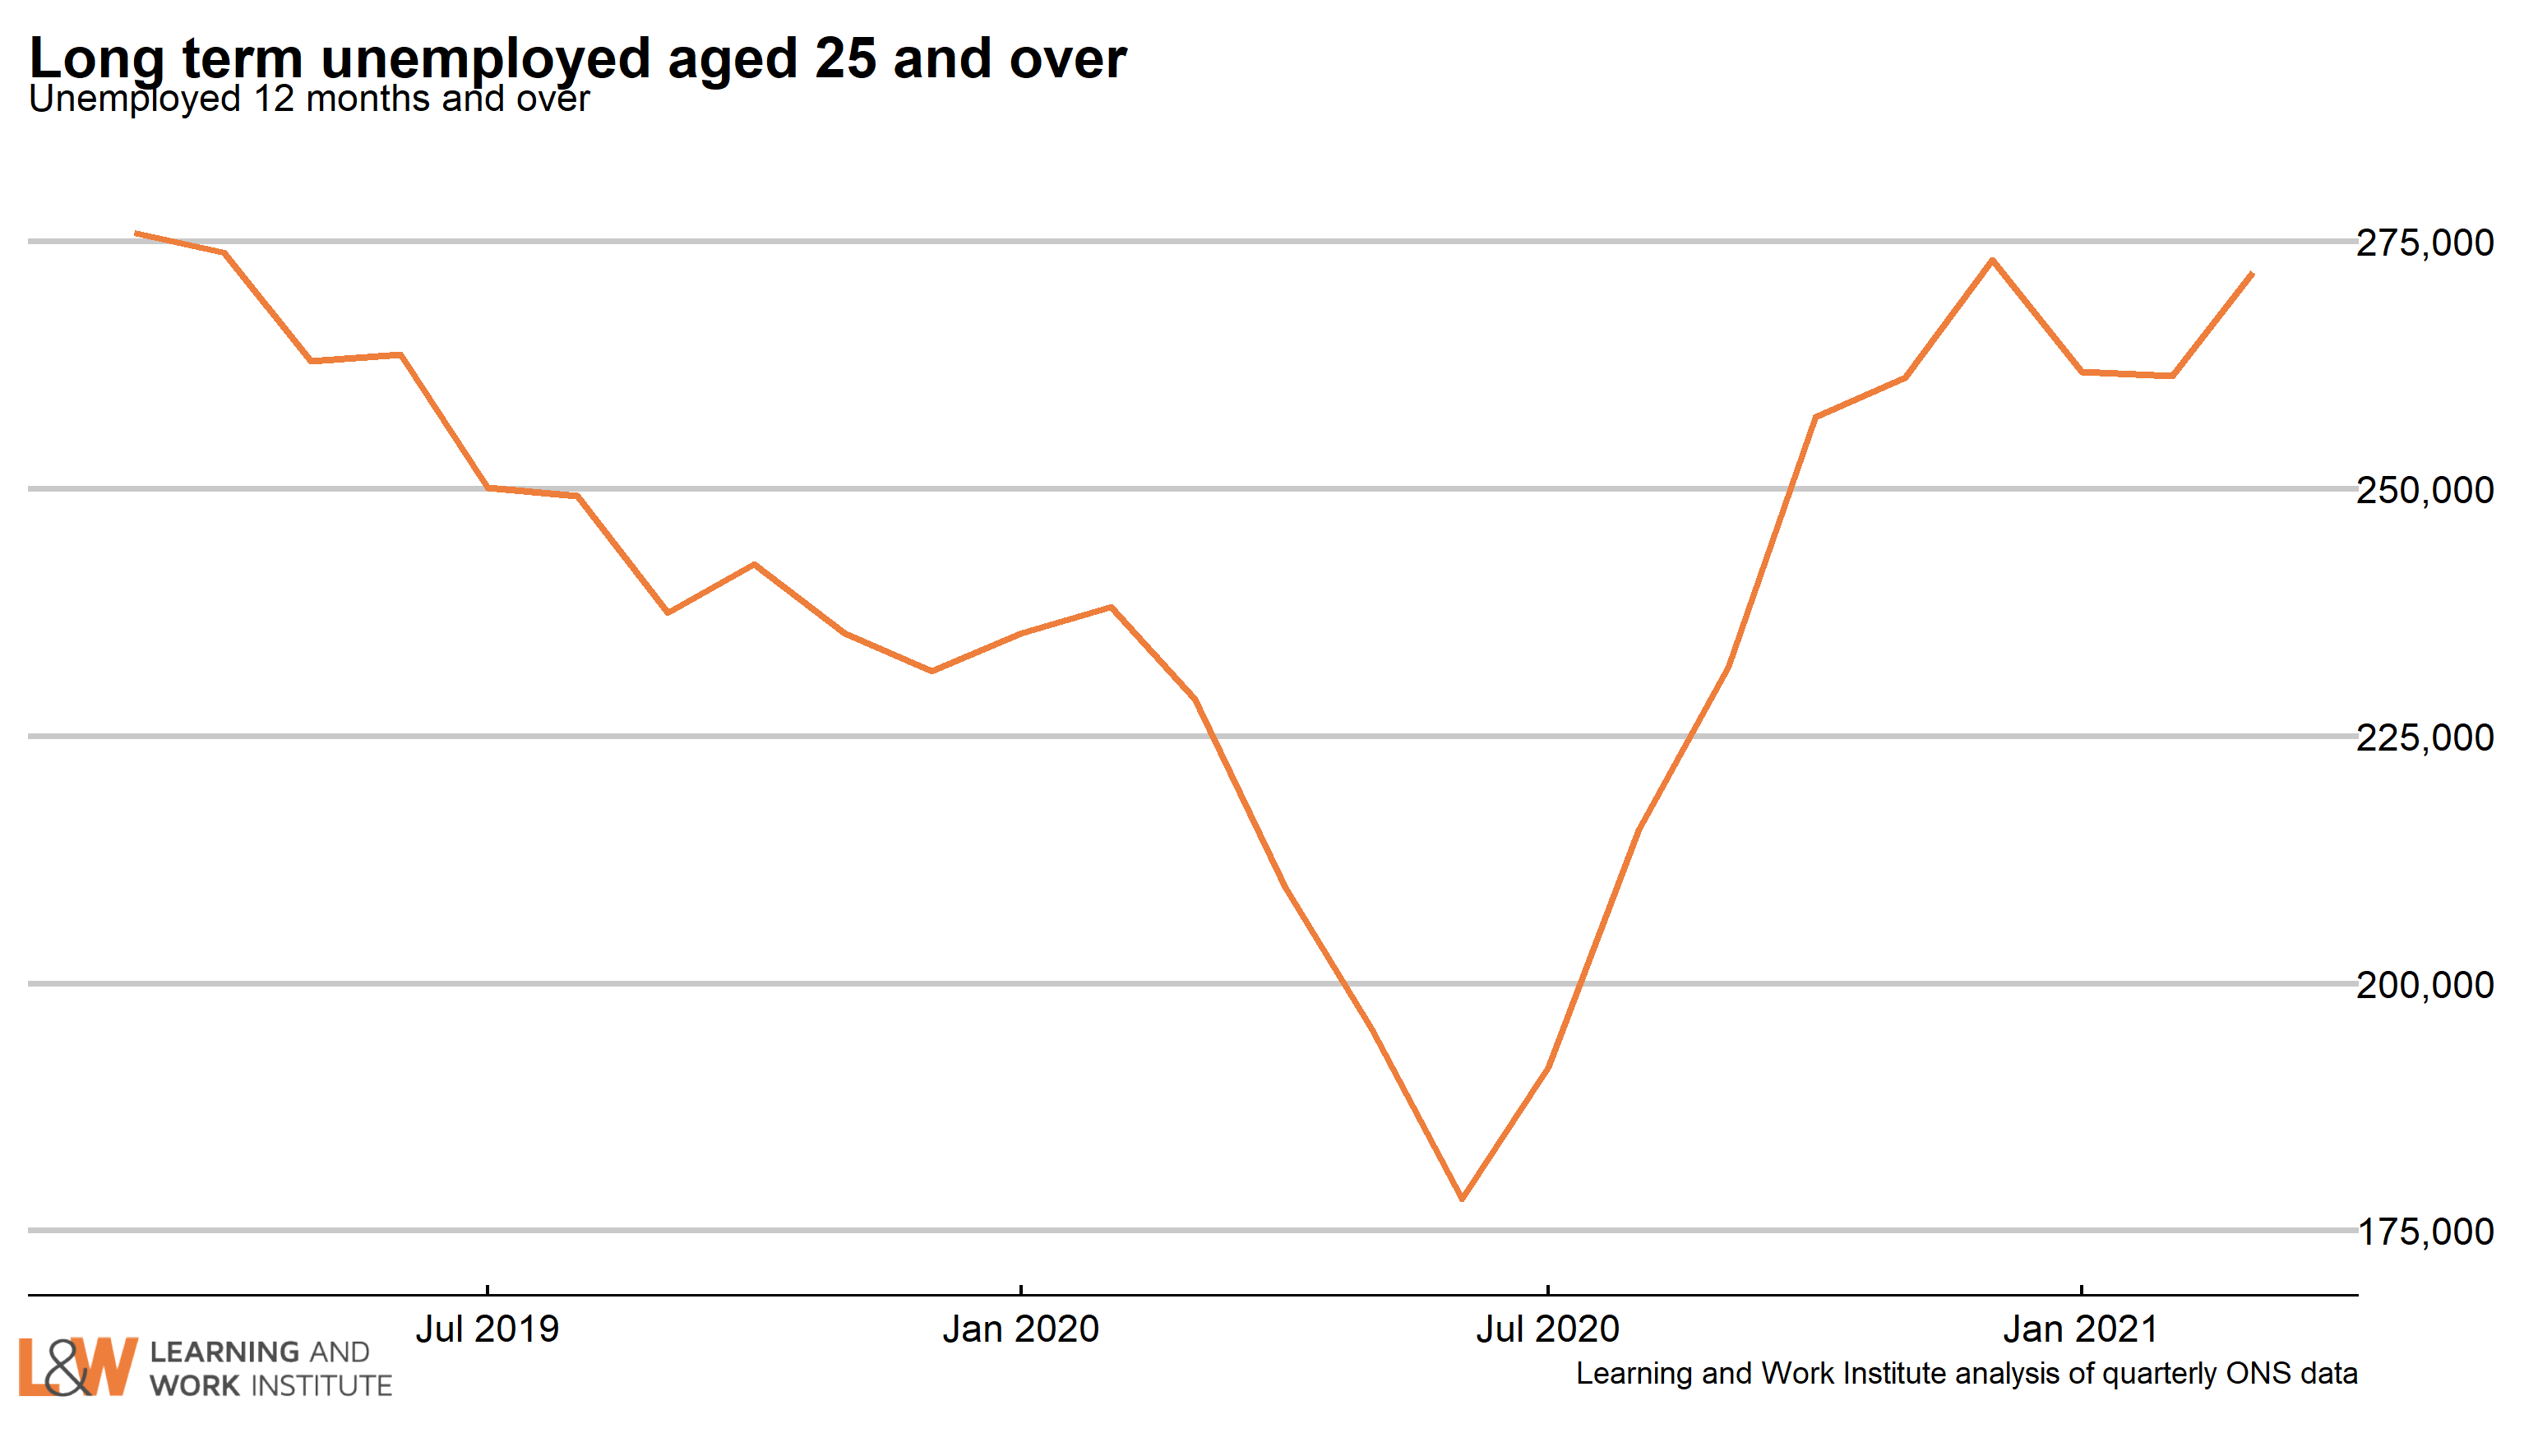 |
|
| Chart 7: Unemployment rates by age The 18 to 24 year old unemployment rate (including students) is 12.0% of the economically active – excluding one million economically inactive students from the calculation. The rate for those aged 25 to 49 is 3.5%. For those aged 50 and over it is 3.7%. The quarterly change is down 1.4 percentage points for 18 to 24 year olds, down 0.3 percentage points for 25 to 49 year olds, and down 0.1 percentage points for the over-50s. 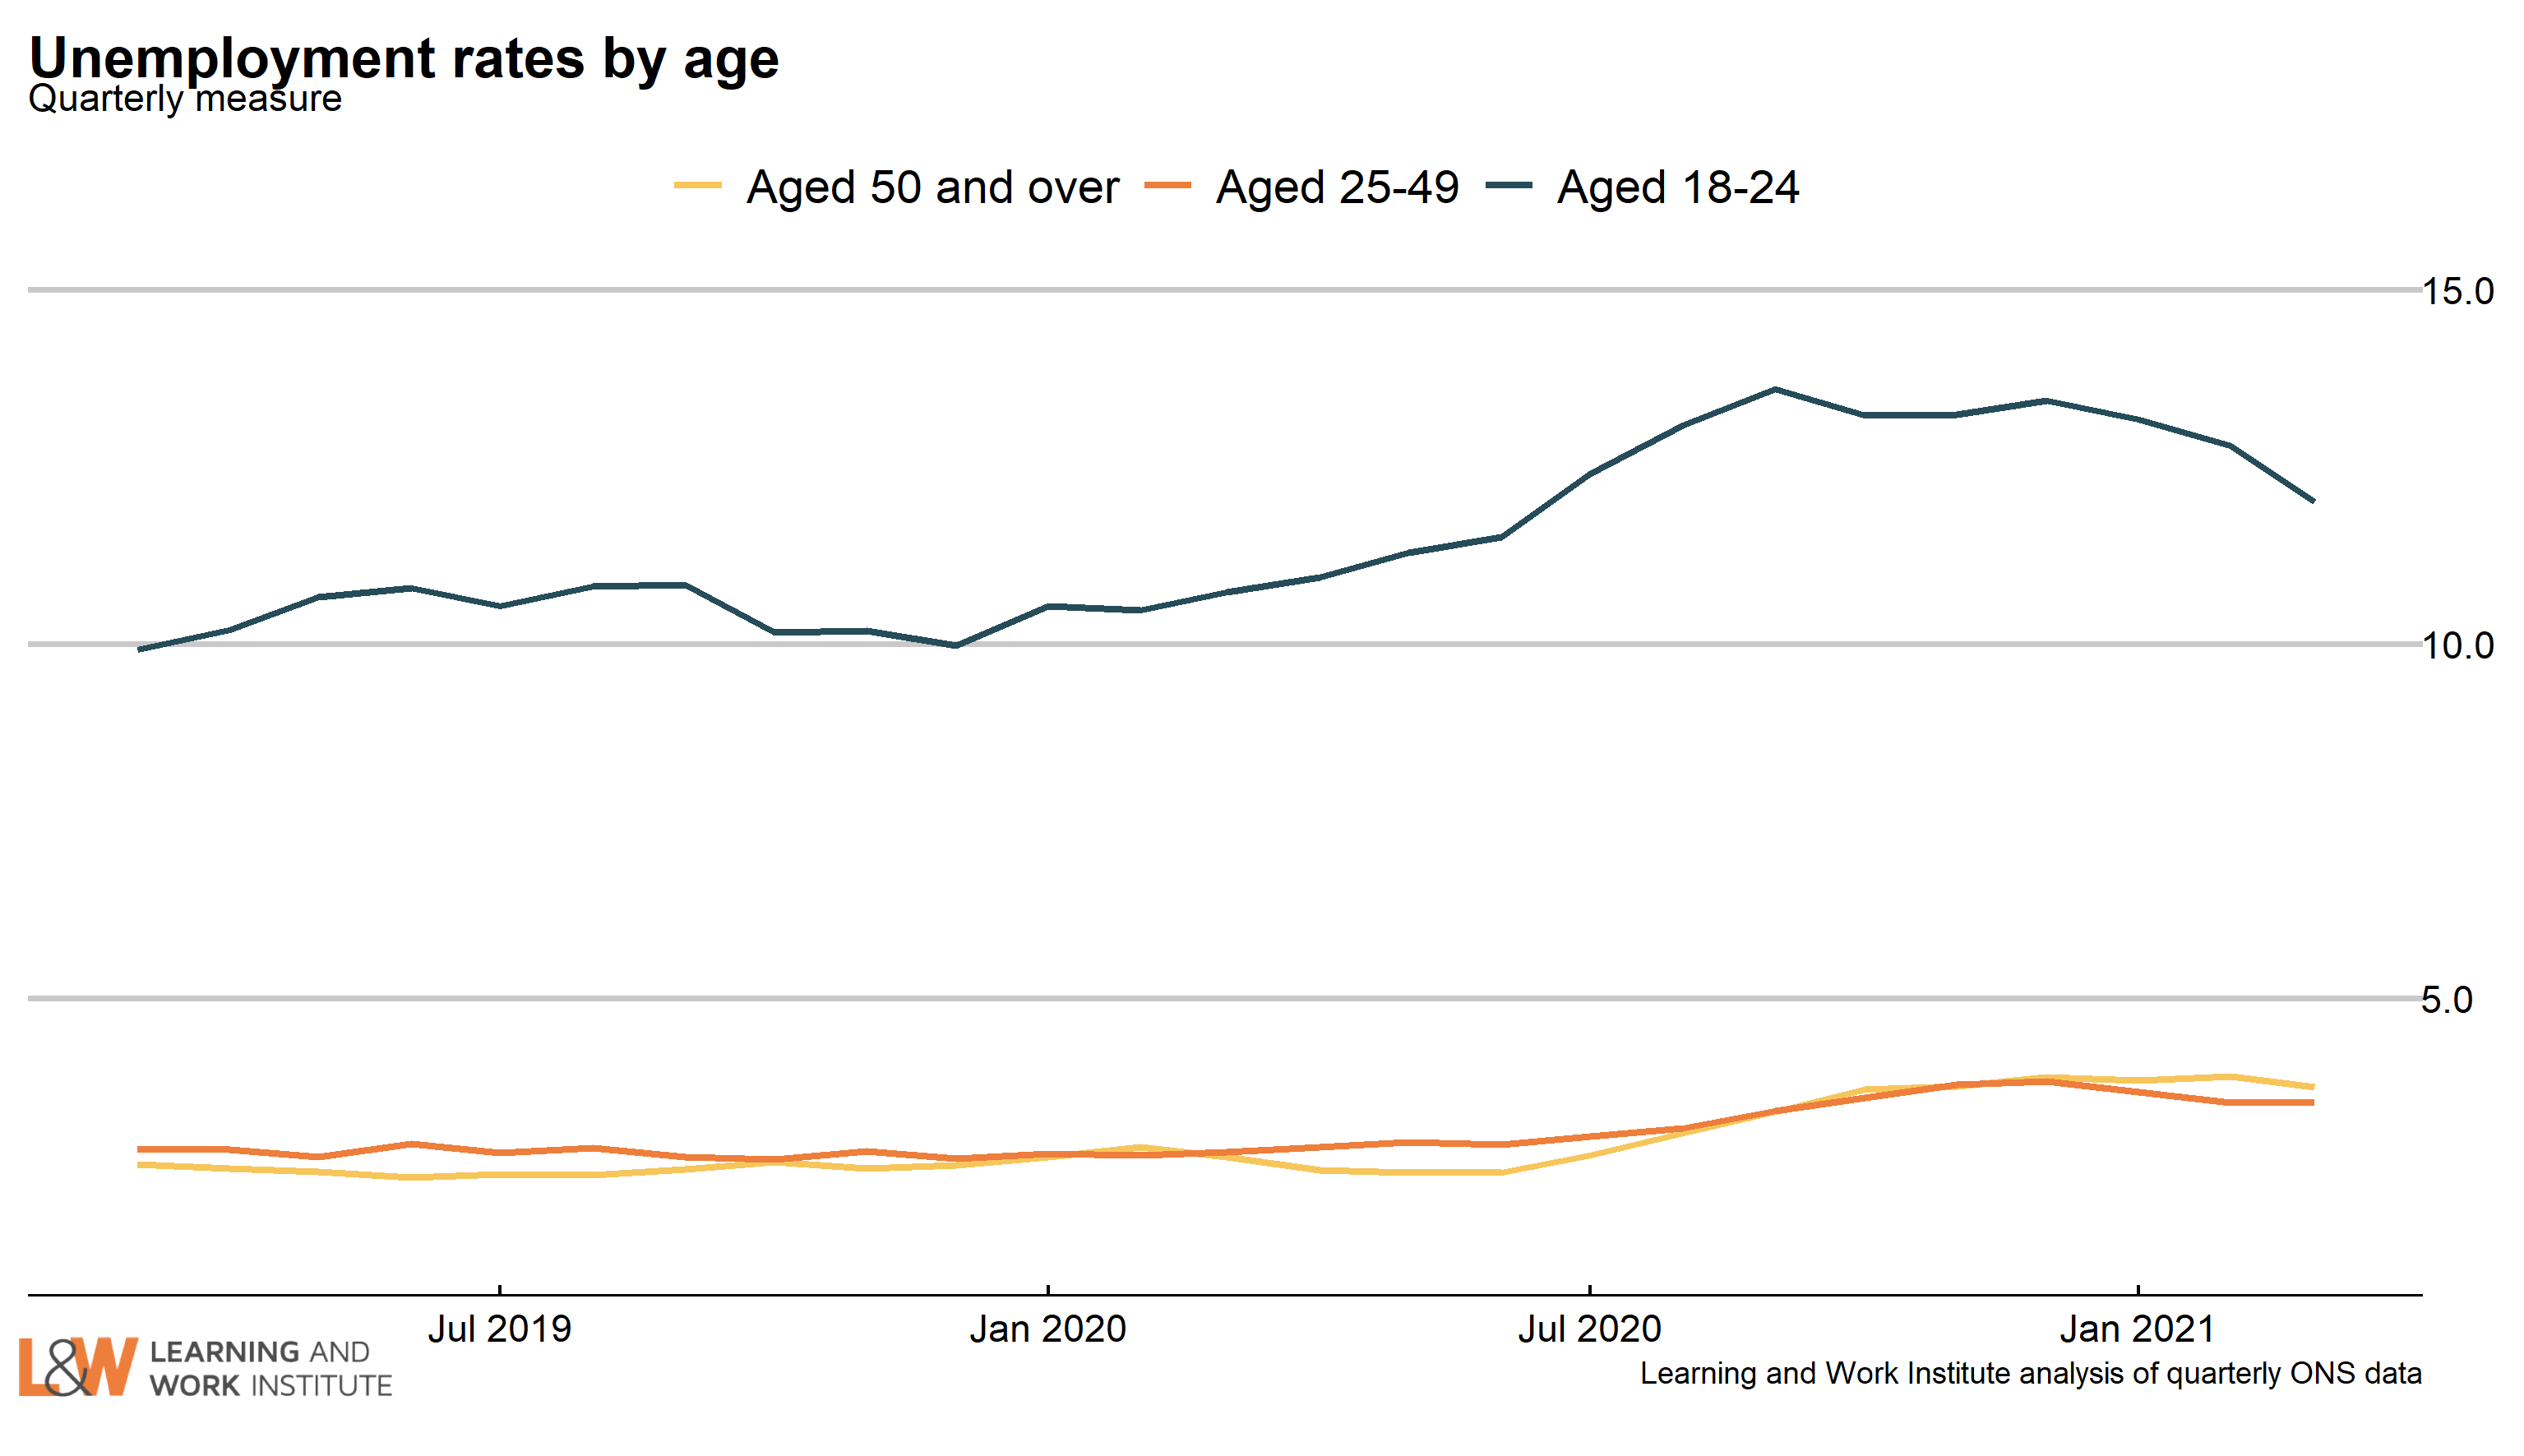 |
|
| Chart 8: Unemployment rate changes by age (counting February 2020 as 100) The 18 to 24 year old unemployment rate (including students) is 1.5 percentage points higher than in February 2020. The change for those aged 25 to 34 is 0.8. The change for those aged 35 to 49 is 0.7. The change for those aged 50 to 64 is 1.0 The change for those aged over 65 is 0.0. 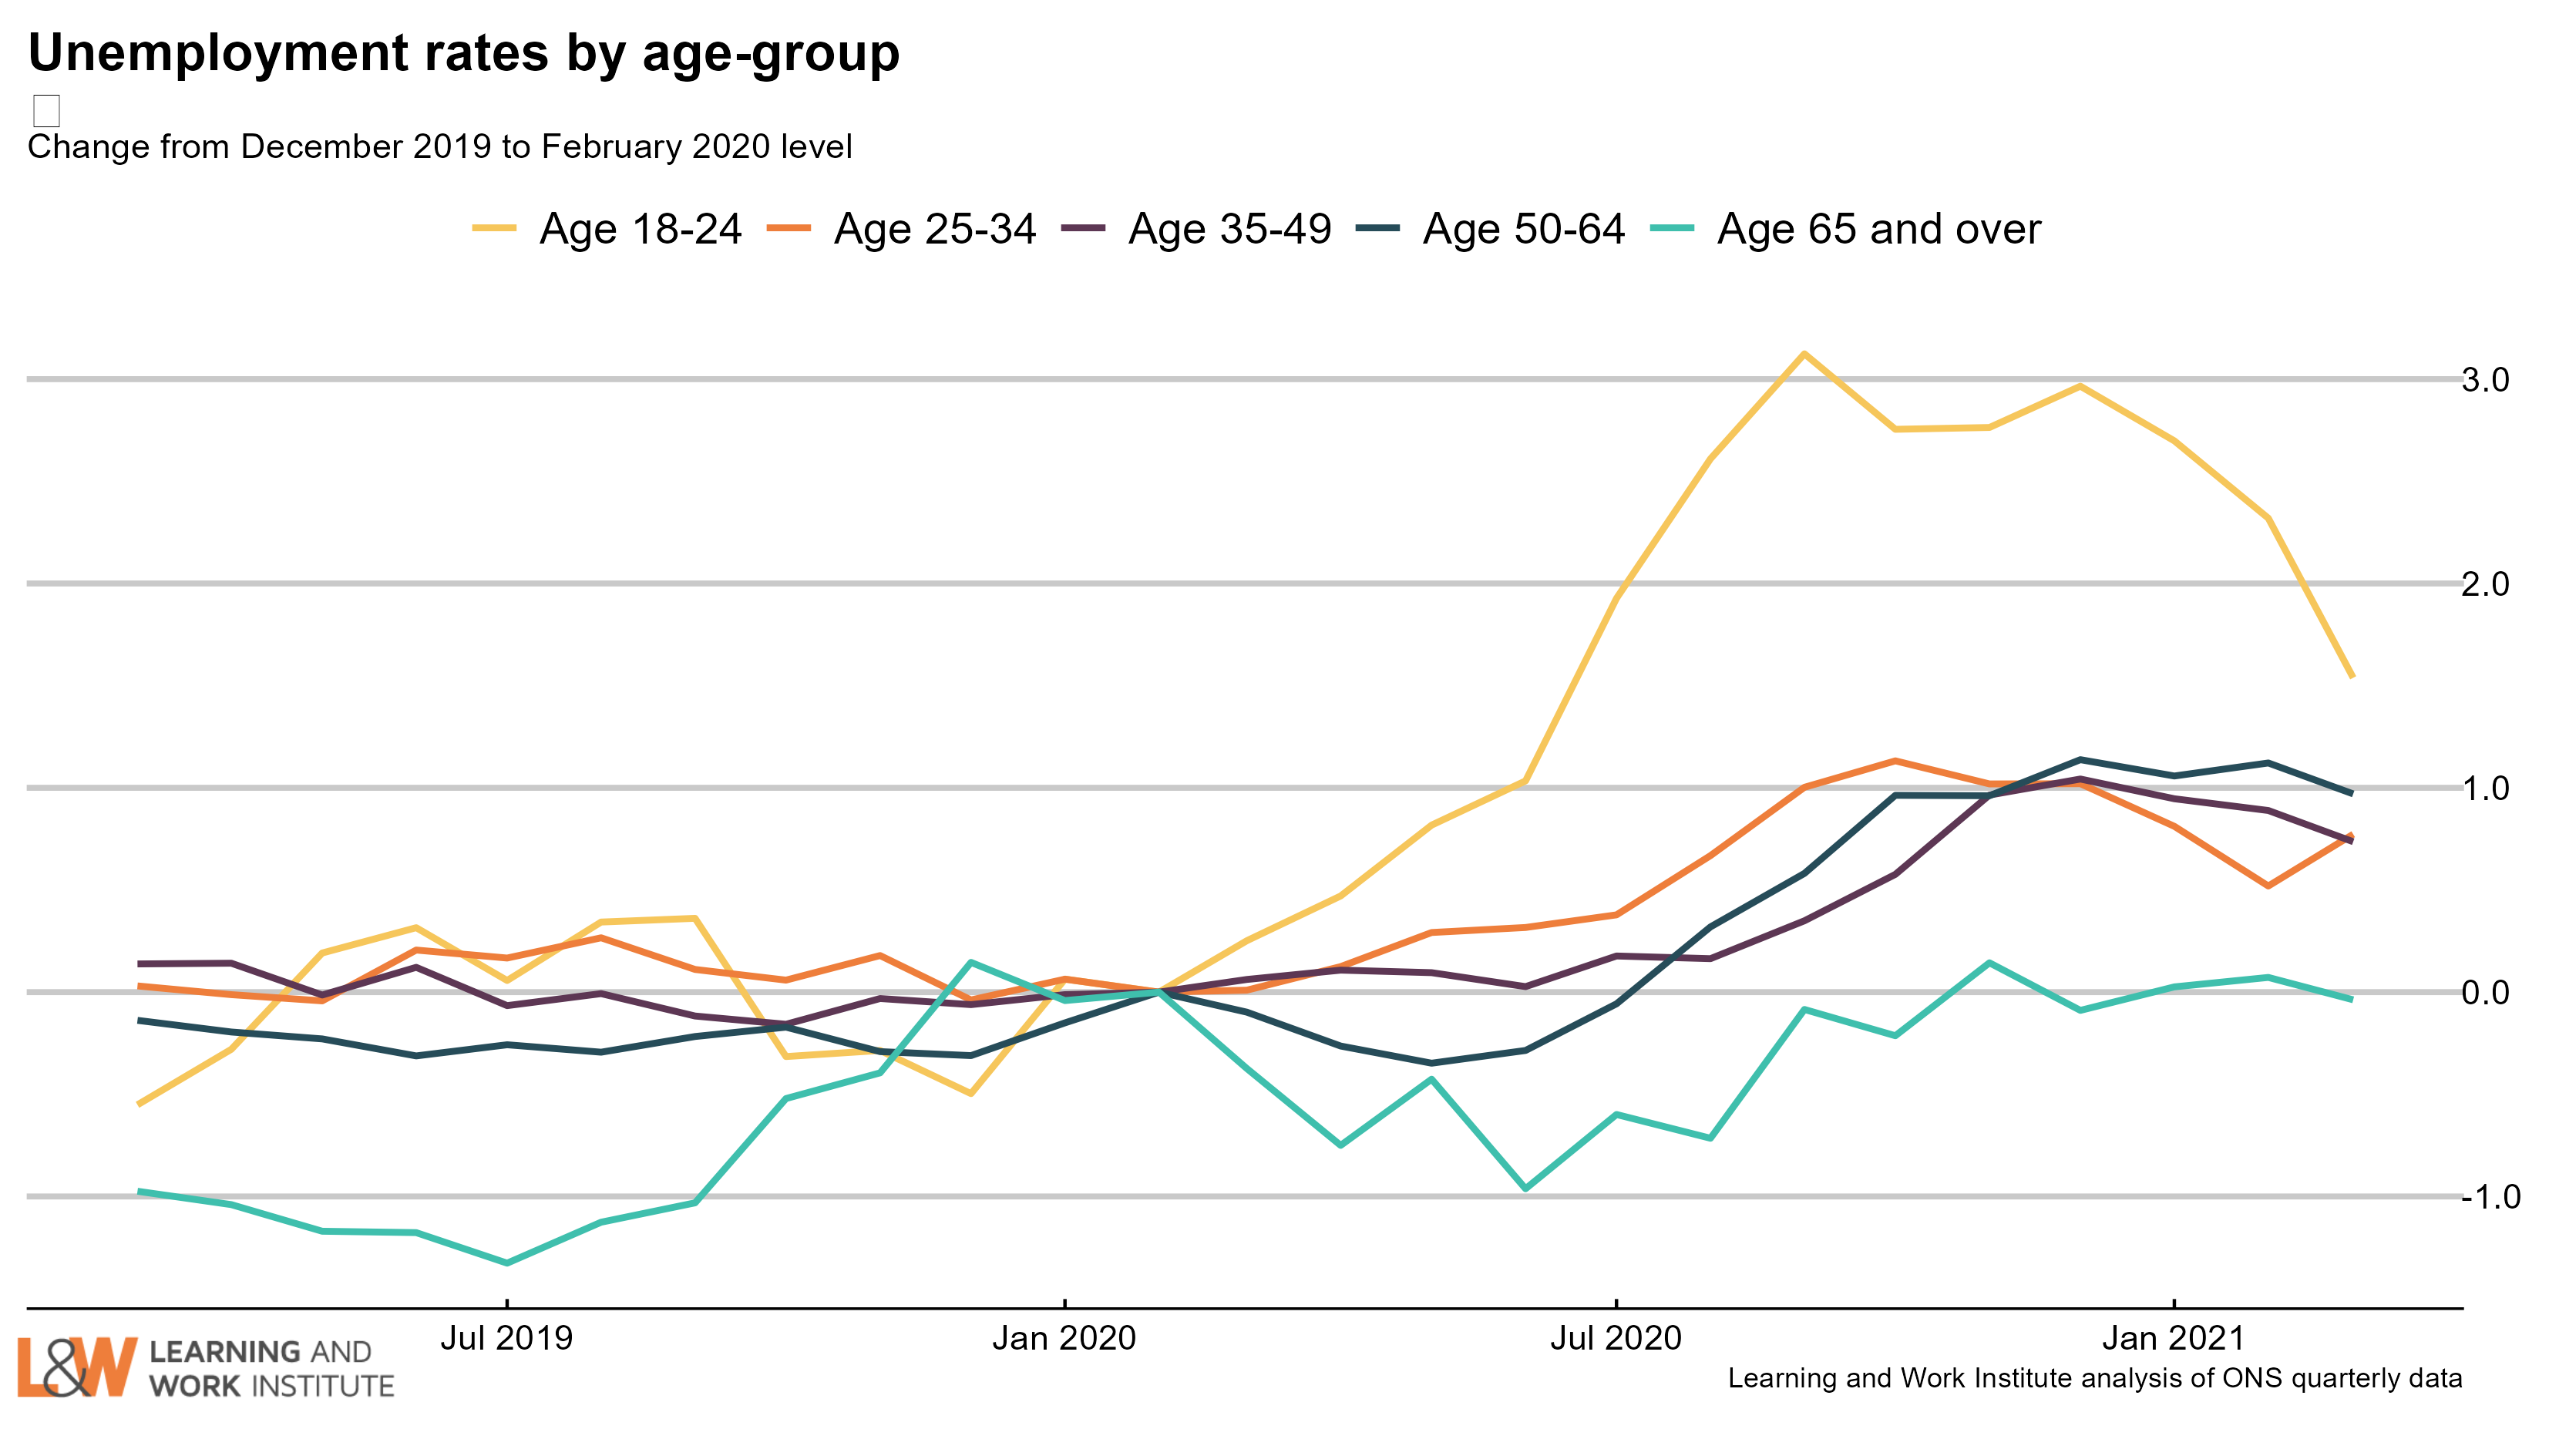 Chart 9: Vacancies – whole economy survey Headline vacancies this month rose by 36,000 to 657,000. The ONS' experimental single-month vacancy figures is up by 170,000 In the last quarter. The headline ONS vacancy figure is both seasonally adjusted and a three-month average. The chart shows both series. 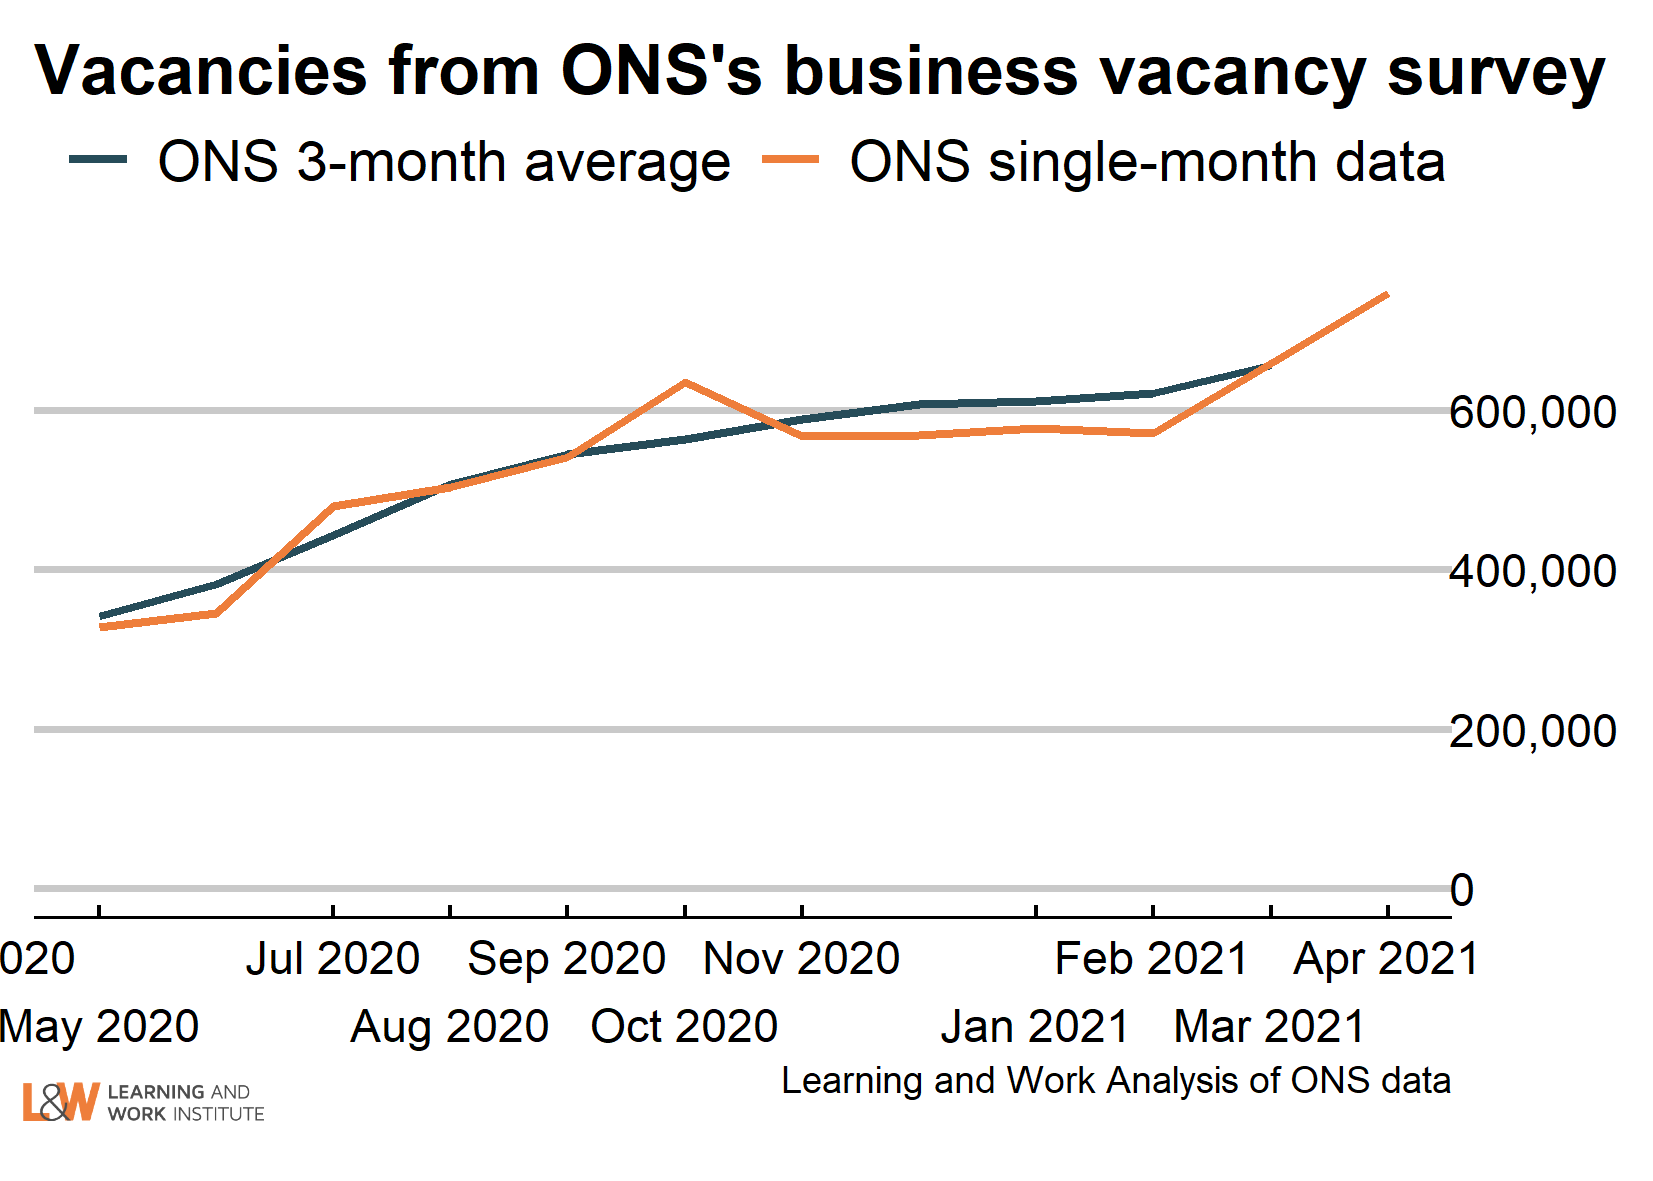 |
|
| Chart 10: Experimental single month vacancies – whole economy survey The Office for National Statistics experimental single month vacancy estimates include sectoral information. As these are not seasonally adjusted, it is better to look at annual changes. The numbers are thousands of vacancies, under each number, and on the right, the annual change in thousands of vacancies. The changes here are April 2021 on April 2020, so is comparing vacancies with the first lockdown. 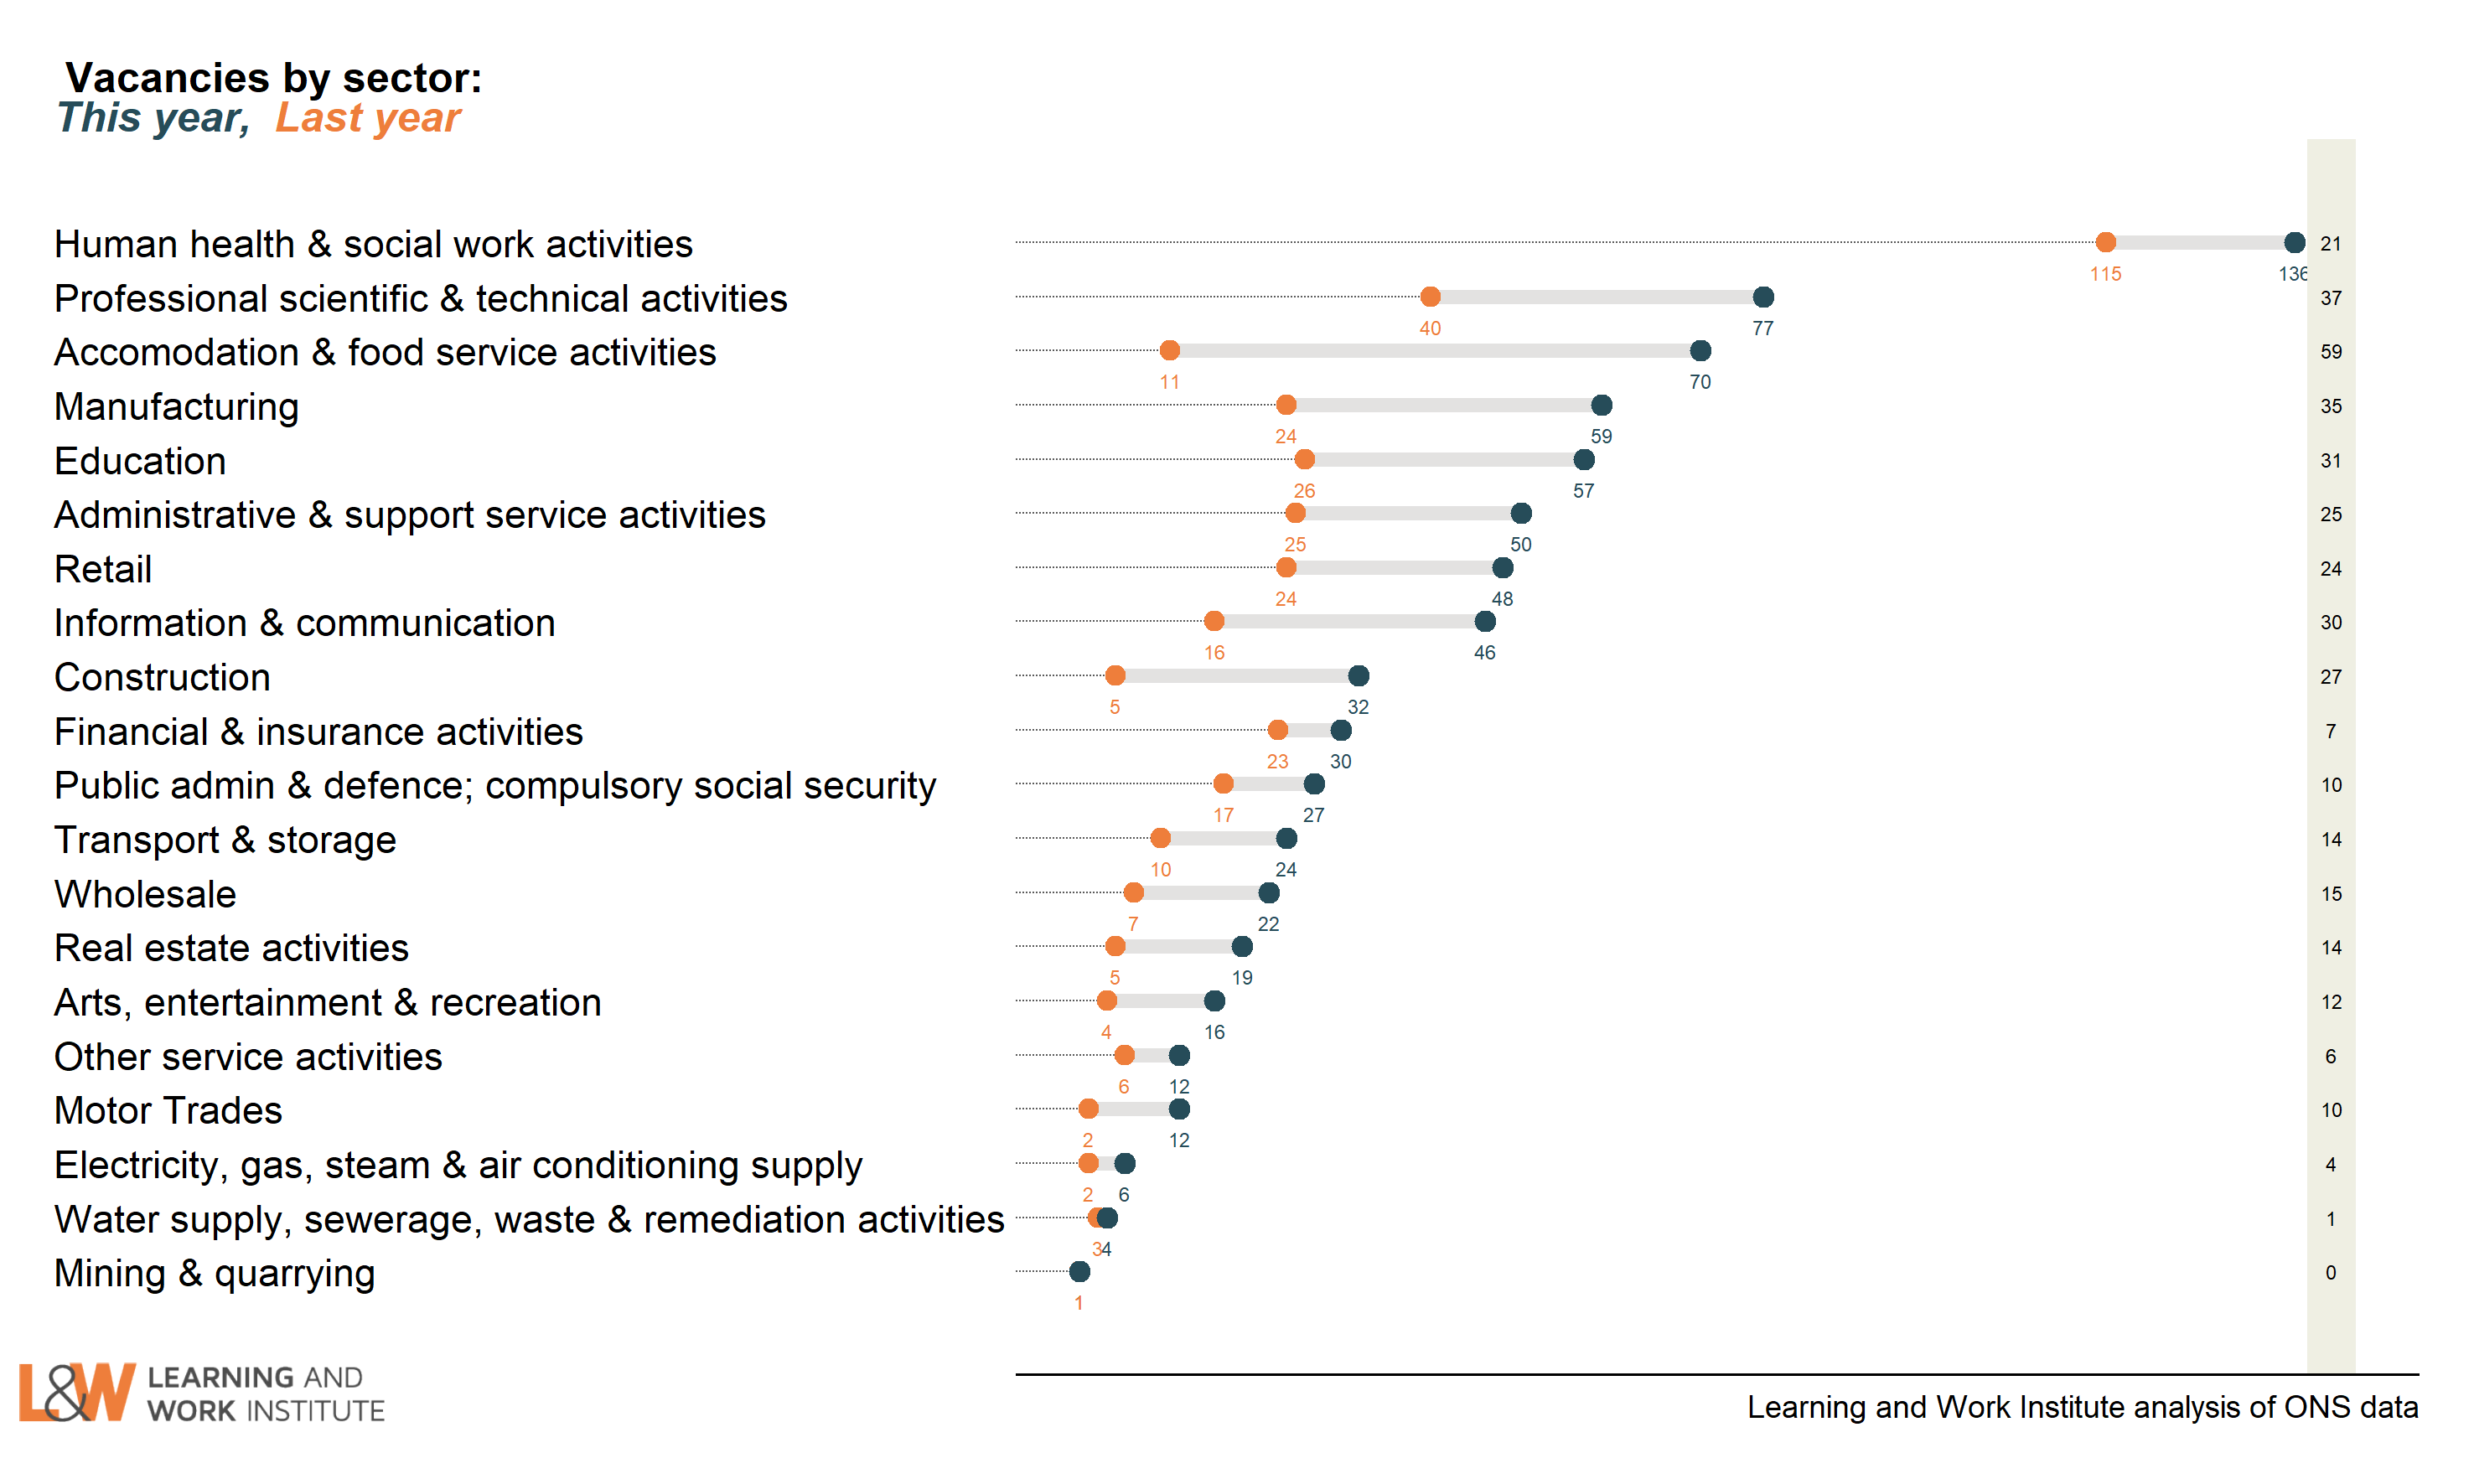 |
|
| Chart 11: Unemployed people per vacancy There are 2.6 unemployed people per vacancy. This has fallen back as the number of vacancies has risen, despite high numbers of unemployed. 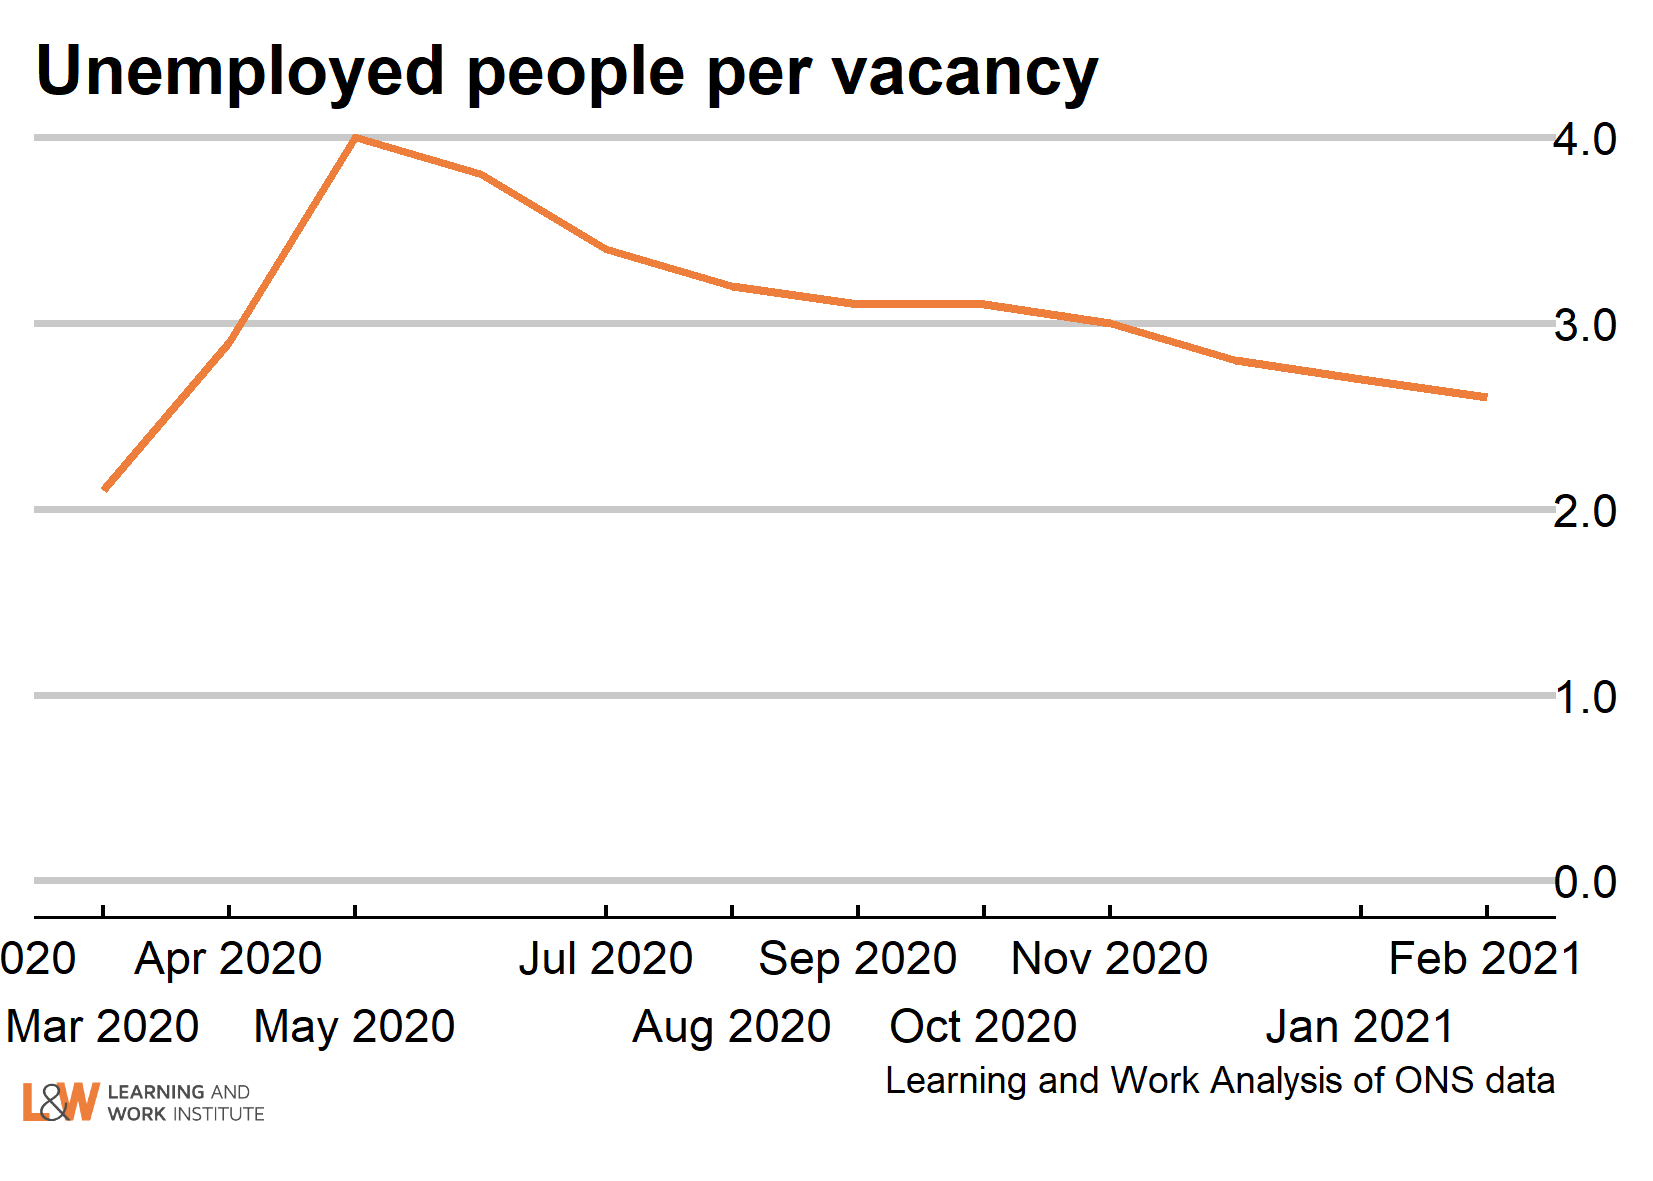 |
|
| Chart 13: Online vacancies to early March from Adzuna Job vacancies dropped to below half of the 2019 average following lockdown. ONS analysis suggests that it was this reduced hiring that led to falls in employment, rather than increased job loss. Vacancy numbers in this measure are now above the February 2020 level, but still have some way to go to match 2018 - vacancies were softer in 2019 than in 2018 on this measure. 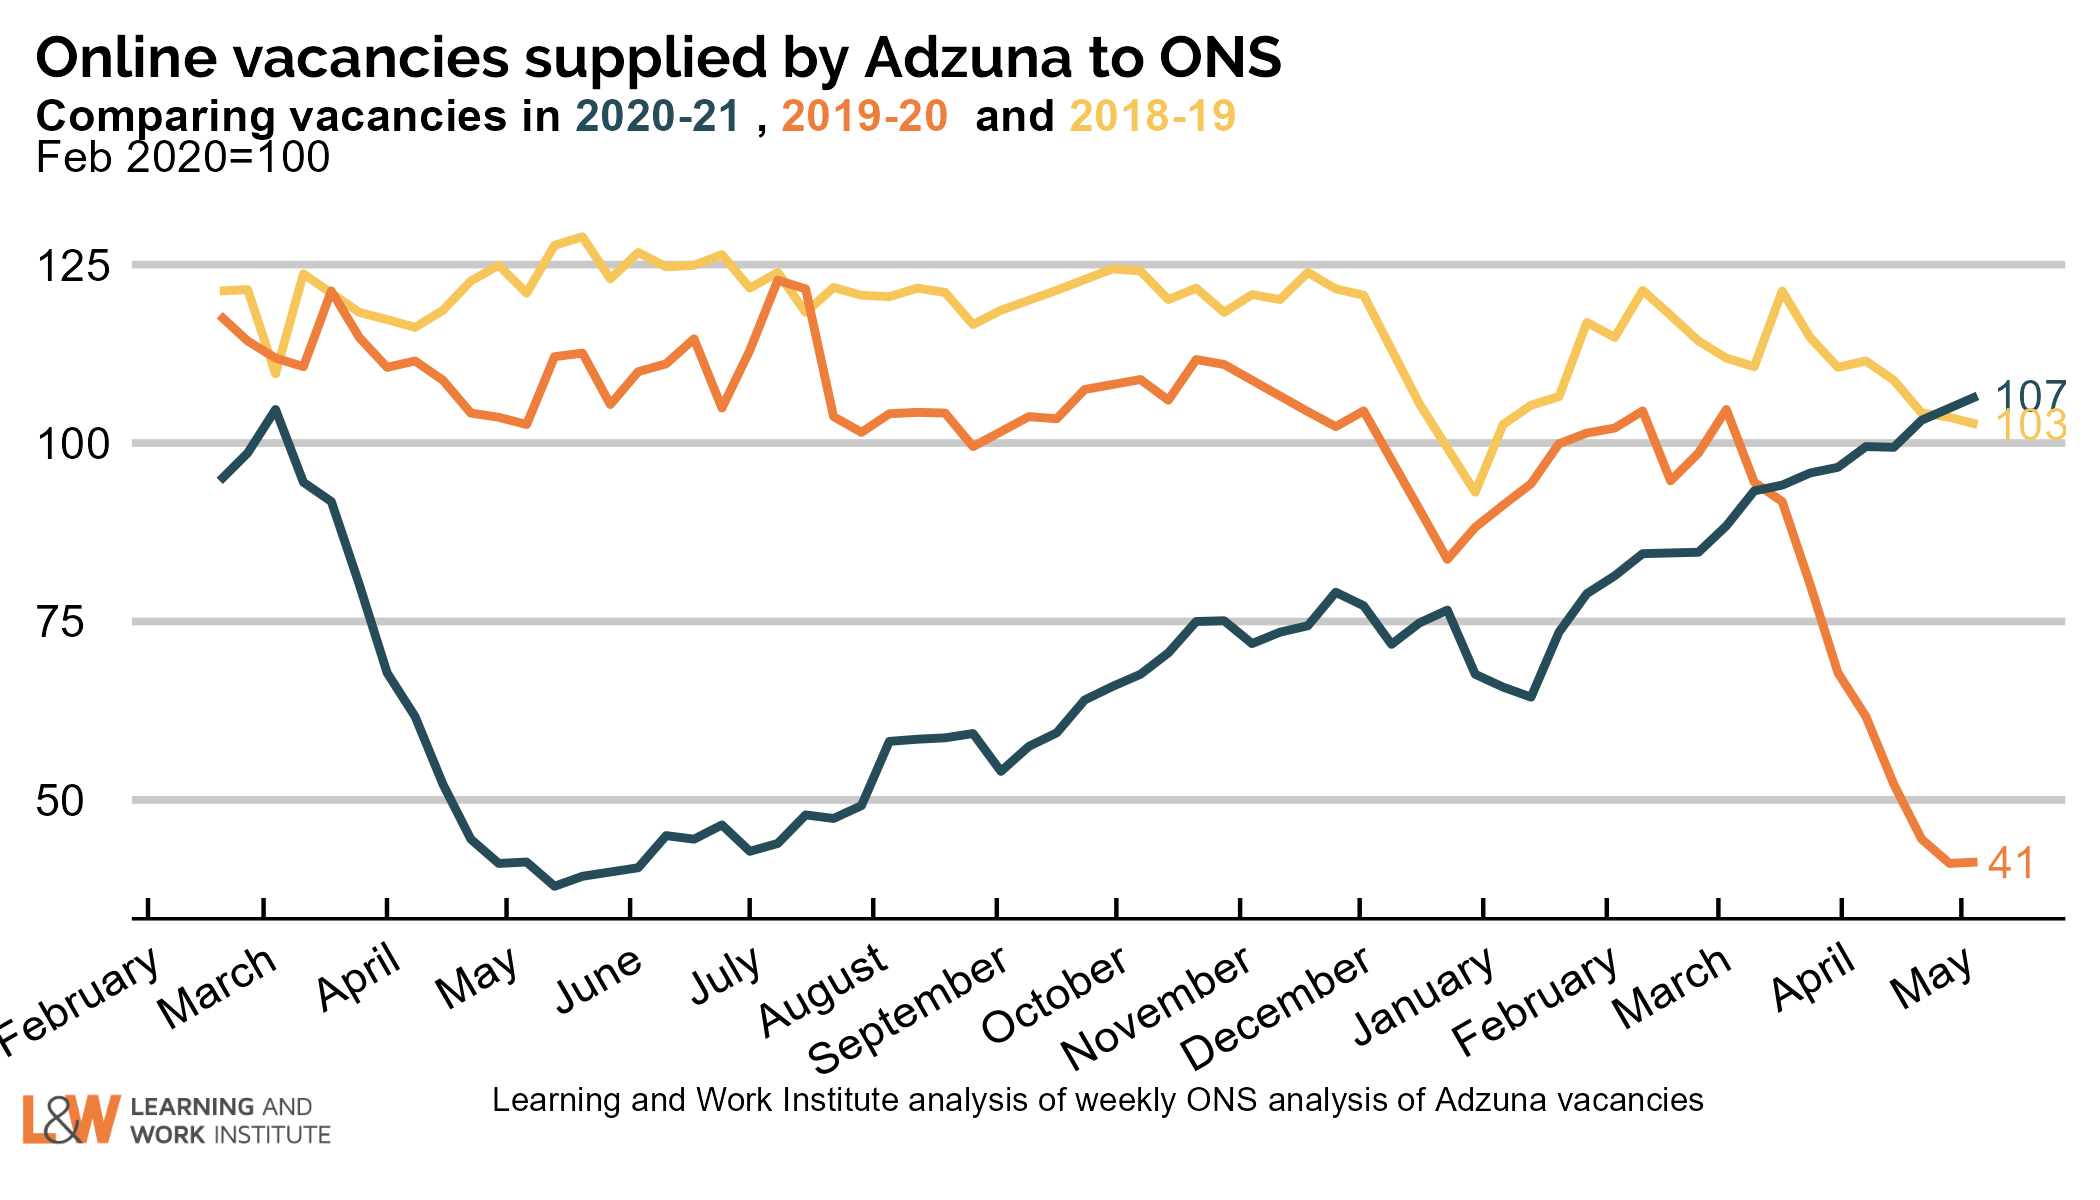 |
|
| Chart 14: UK employment Employment is up by 46,000 on the figure published last month, to 32,476,000. The chart shows both the official figures and the experimental weekly figures. The trend is likely to be upwards. 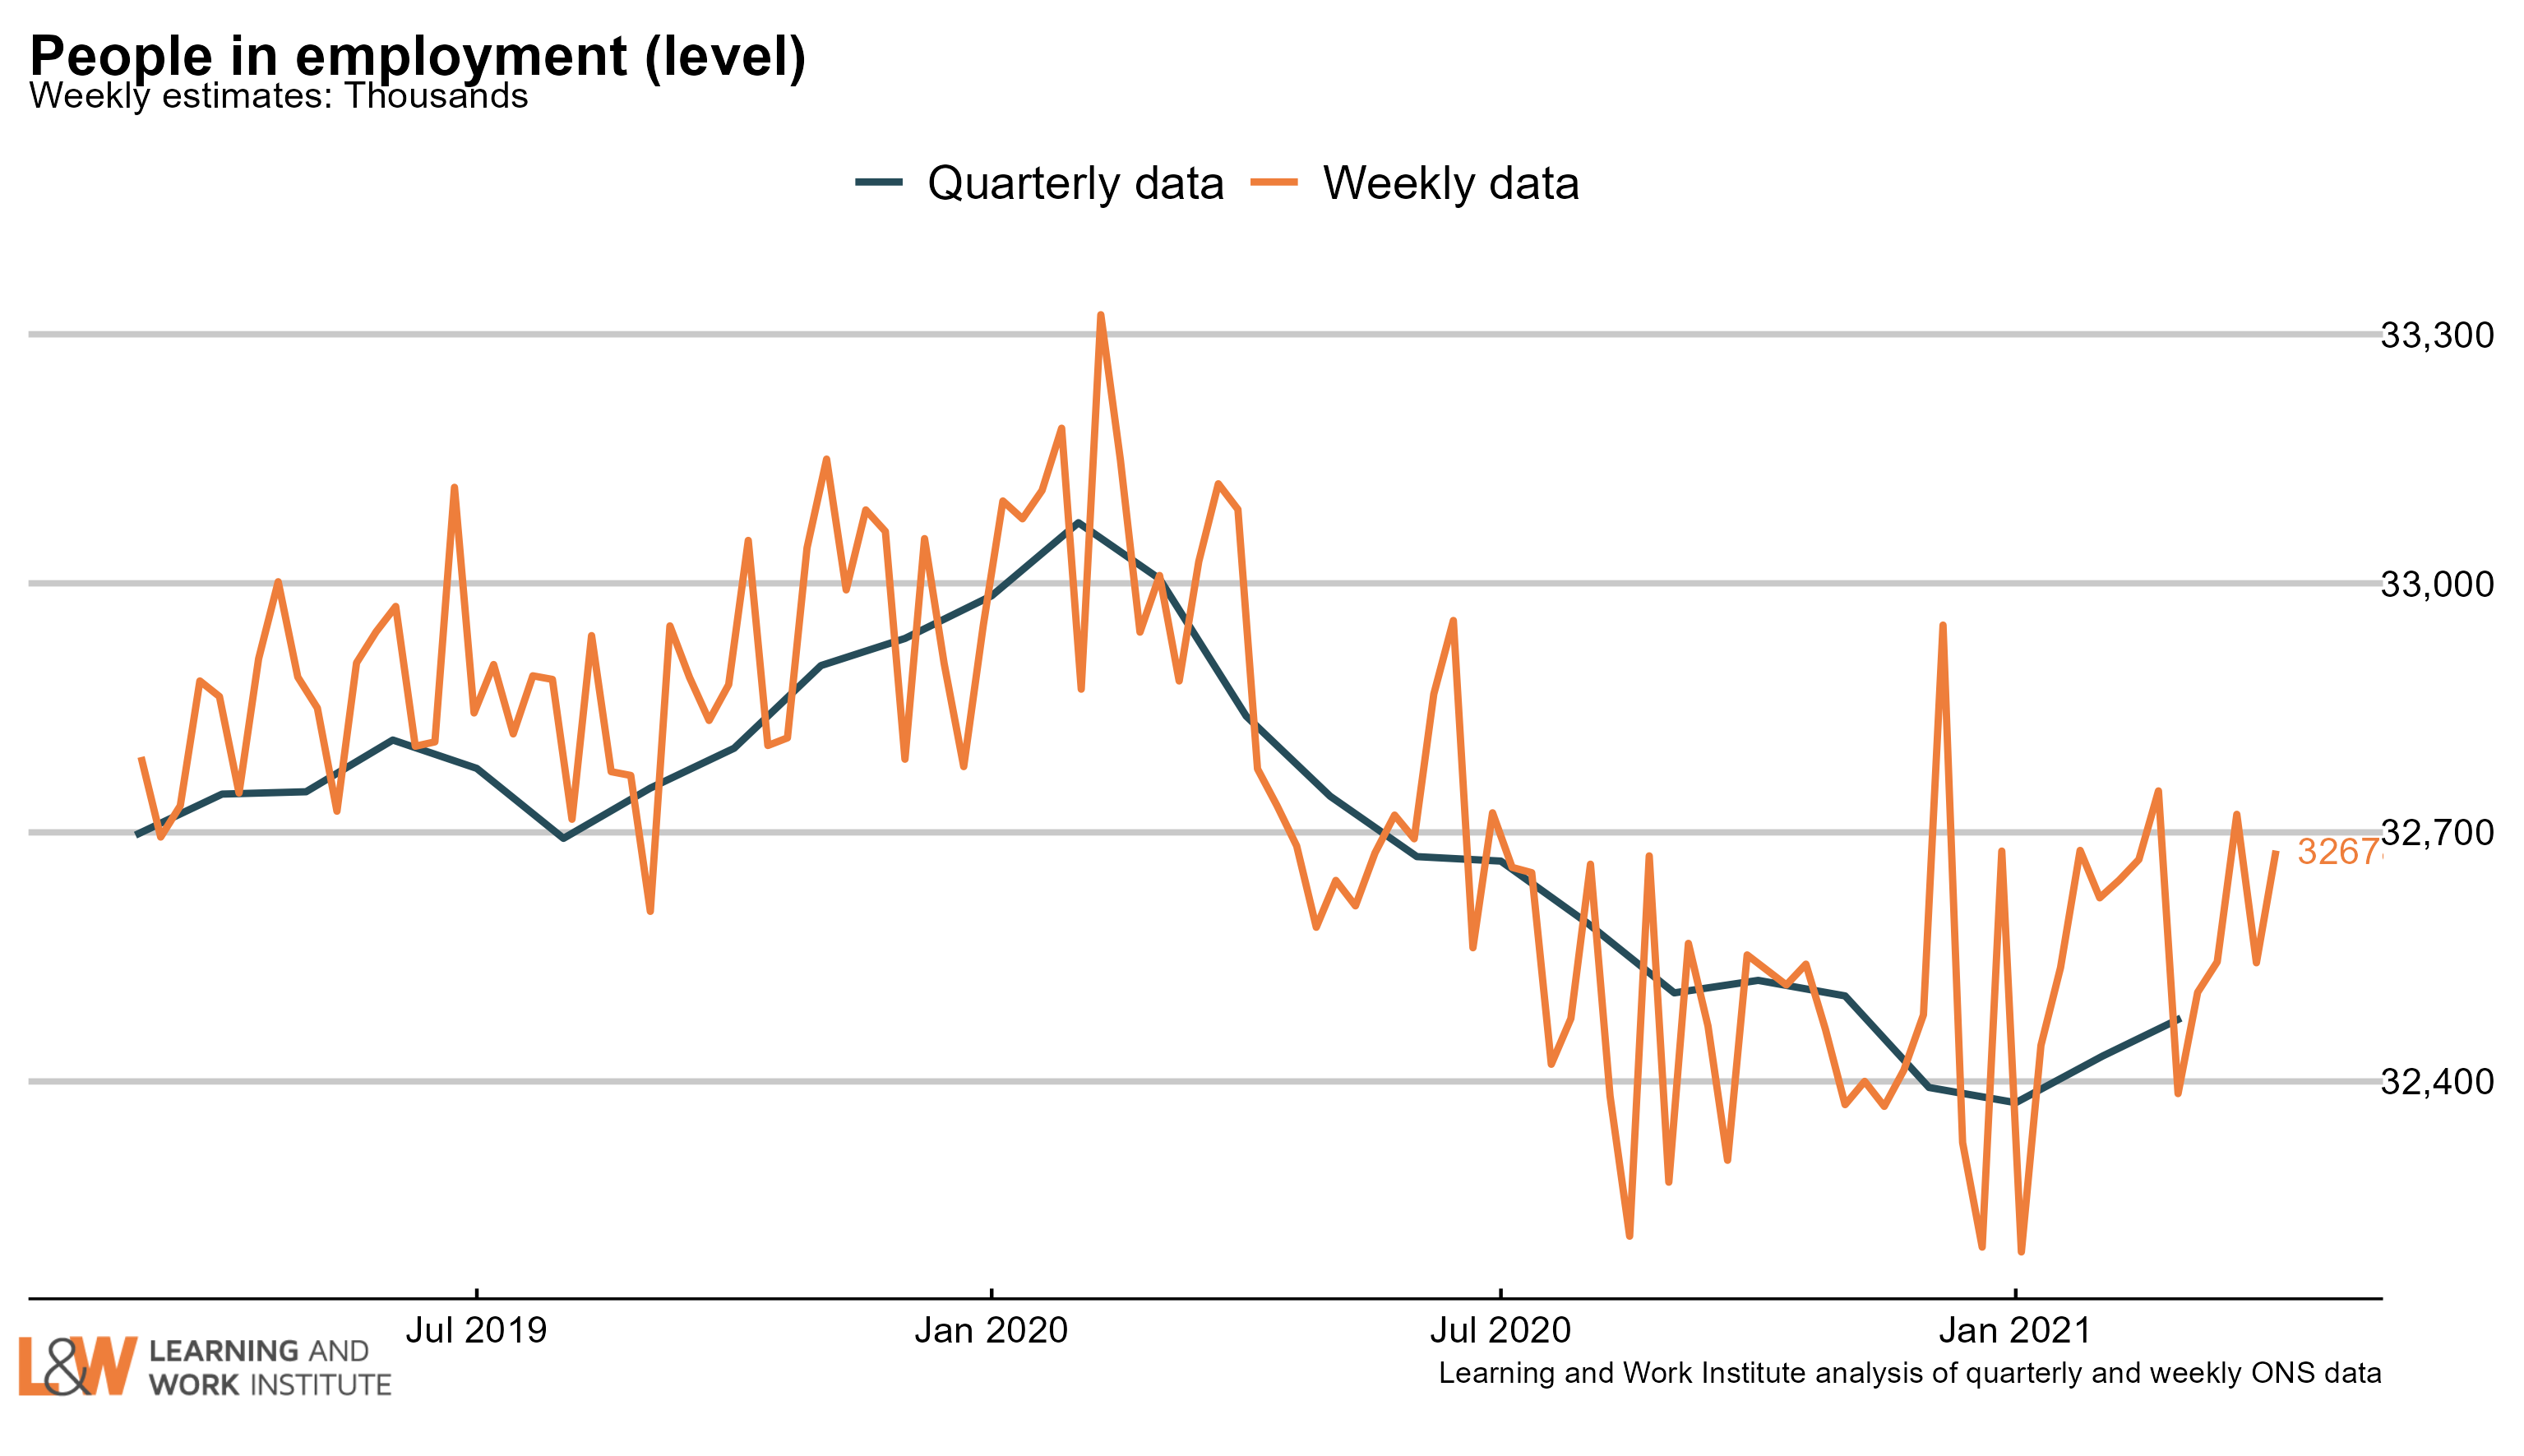 |
|
| Chart 15: Employment rate in the UK The employment rate is up by 0.2 percentage points over the quarter, to 75.2%. The chart shows both the official figures and the experimental weekly figures. The trend is likely to be upwards. 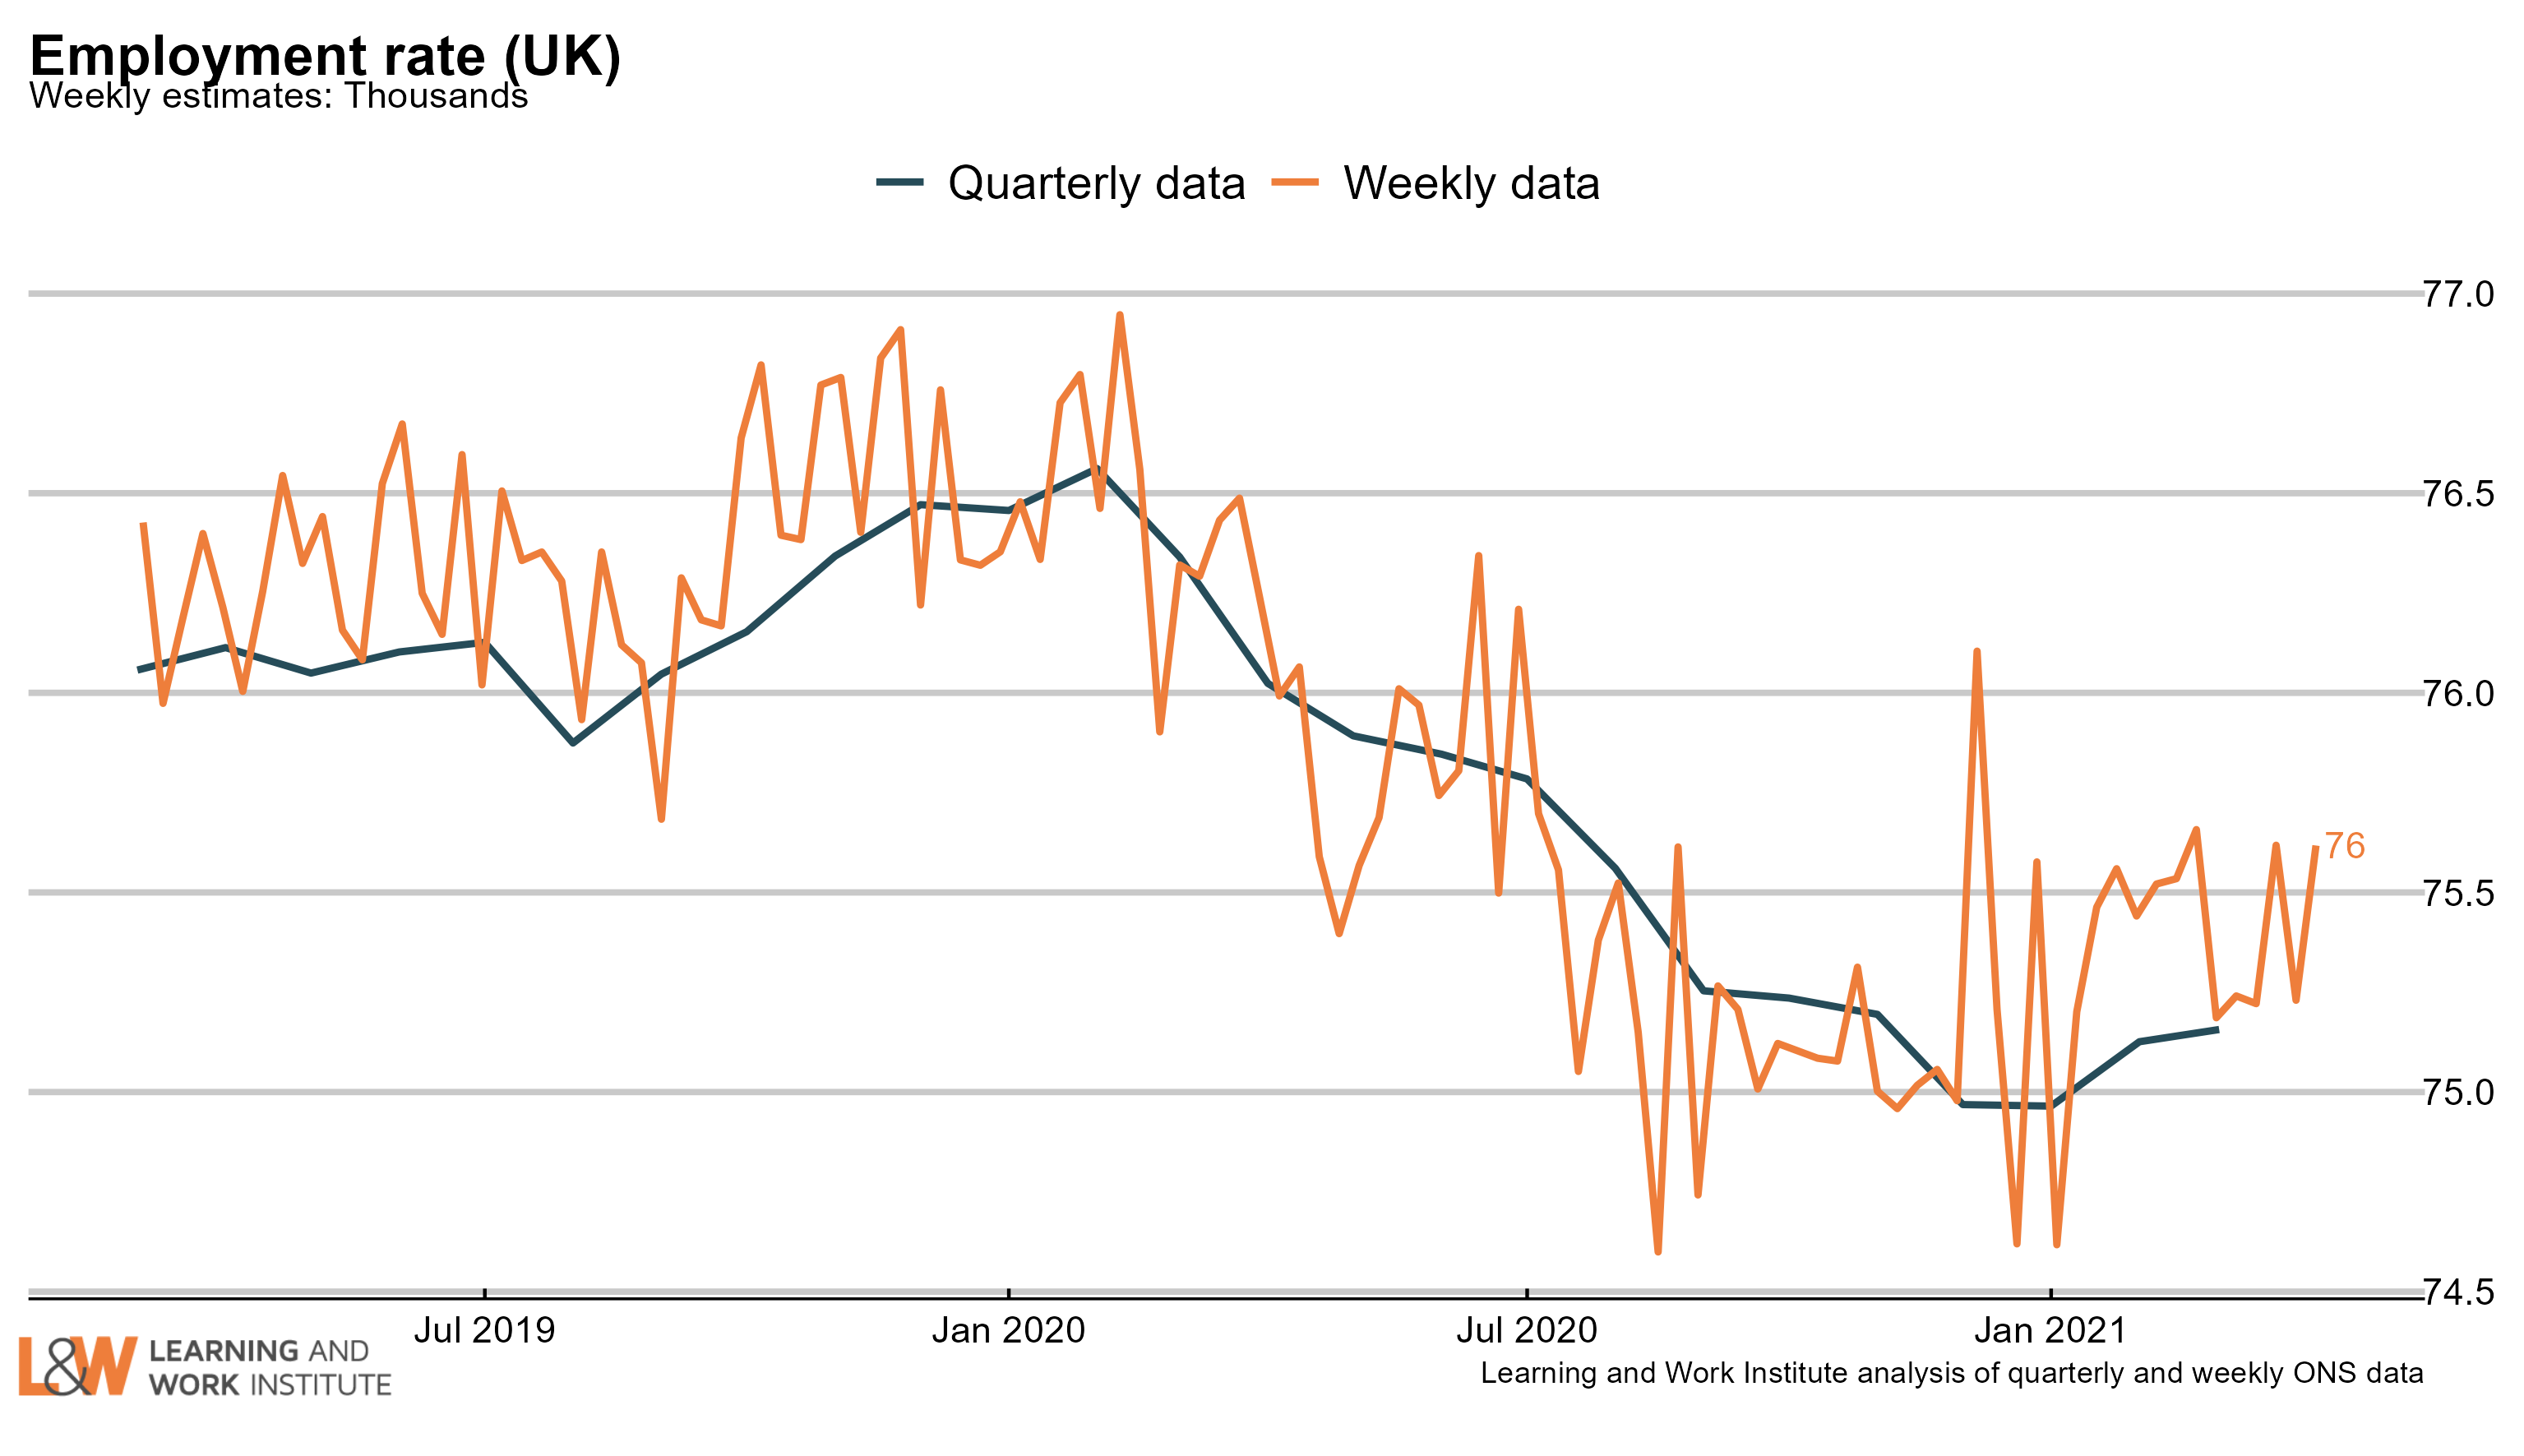 |
|
| Chart 16: Economic inactivity – the long-term sick or disabled The numbers of people who are economically inactive, that is, not working and not currently looking for work, who are long-term sick or disabled has been trending upwards. This month, there is a rise after last month's sharp fall. 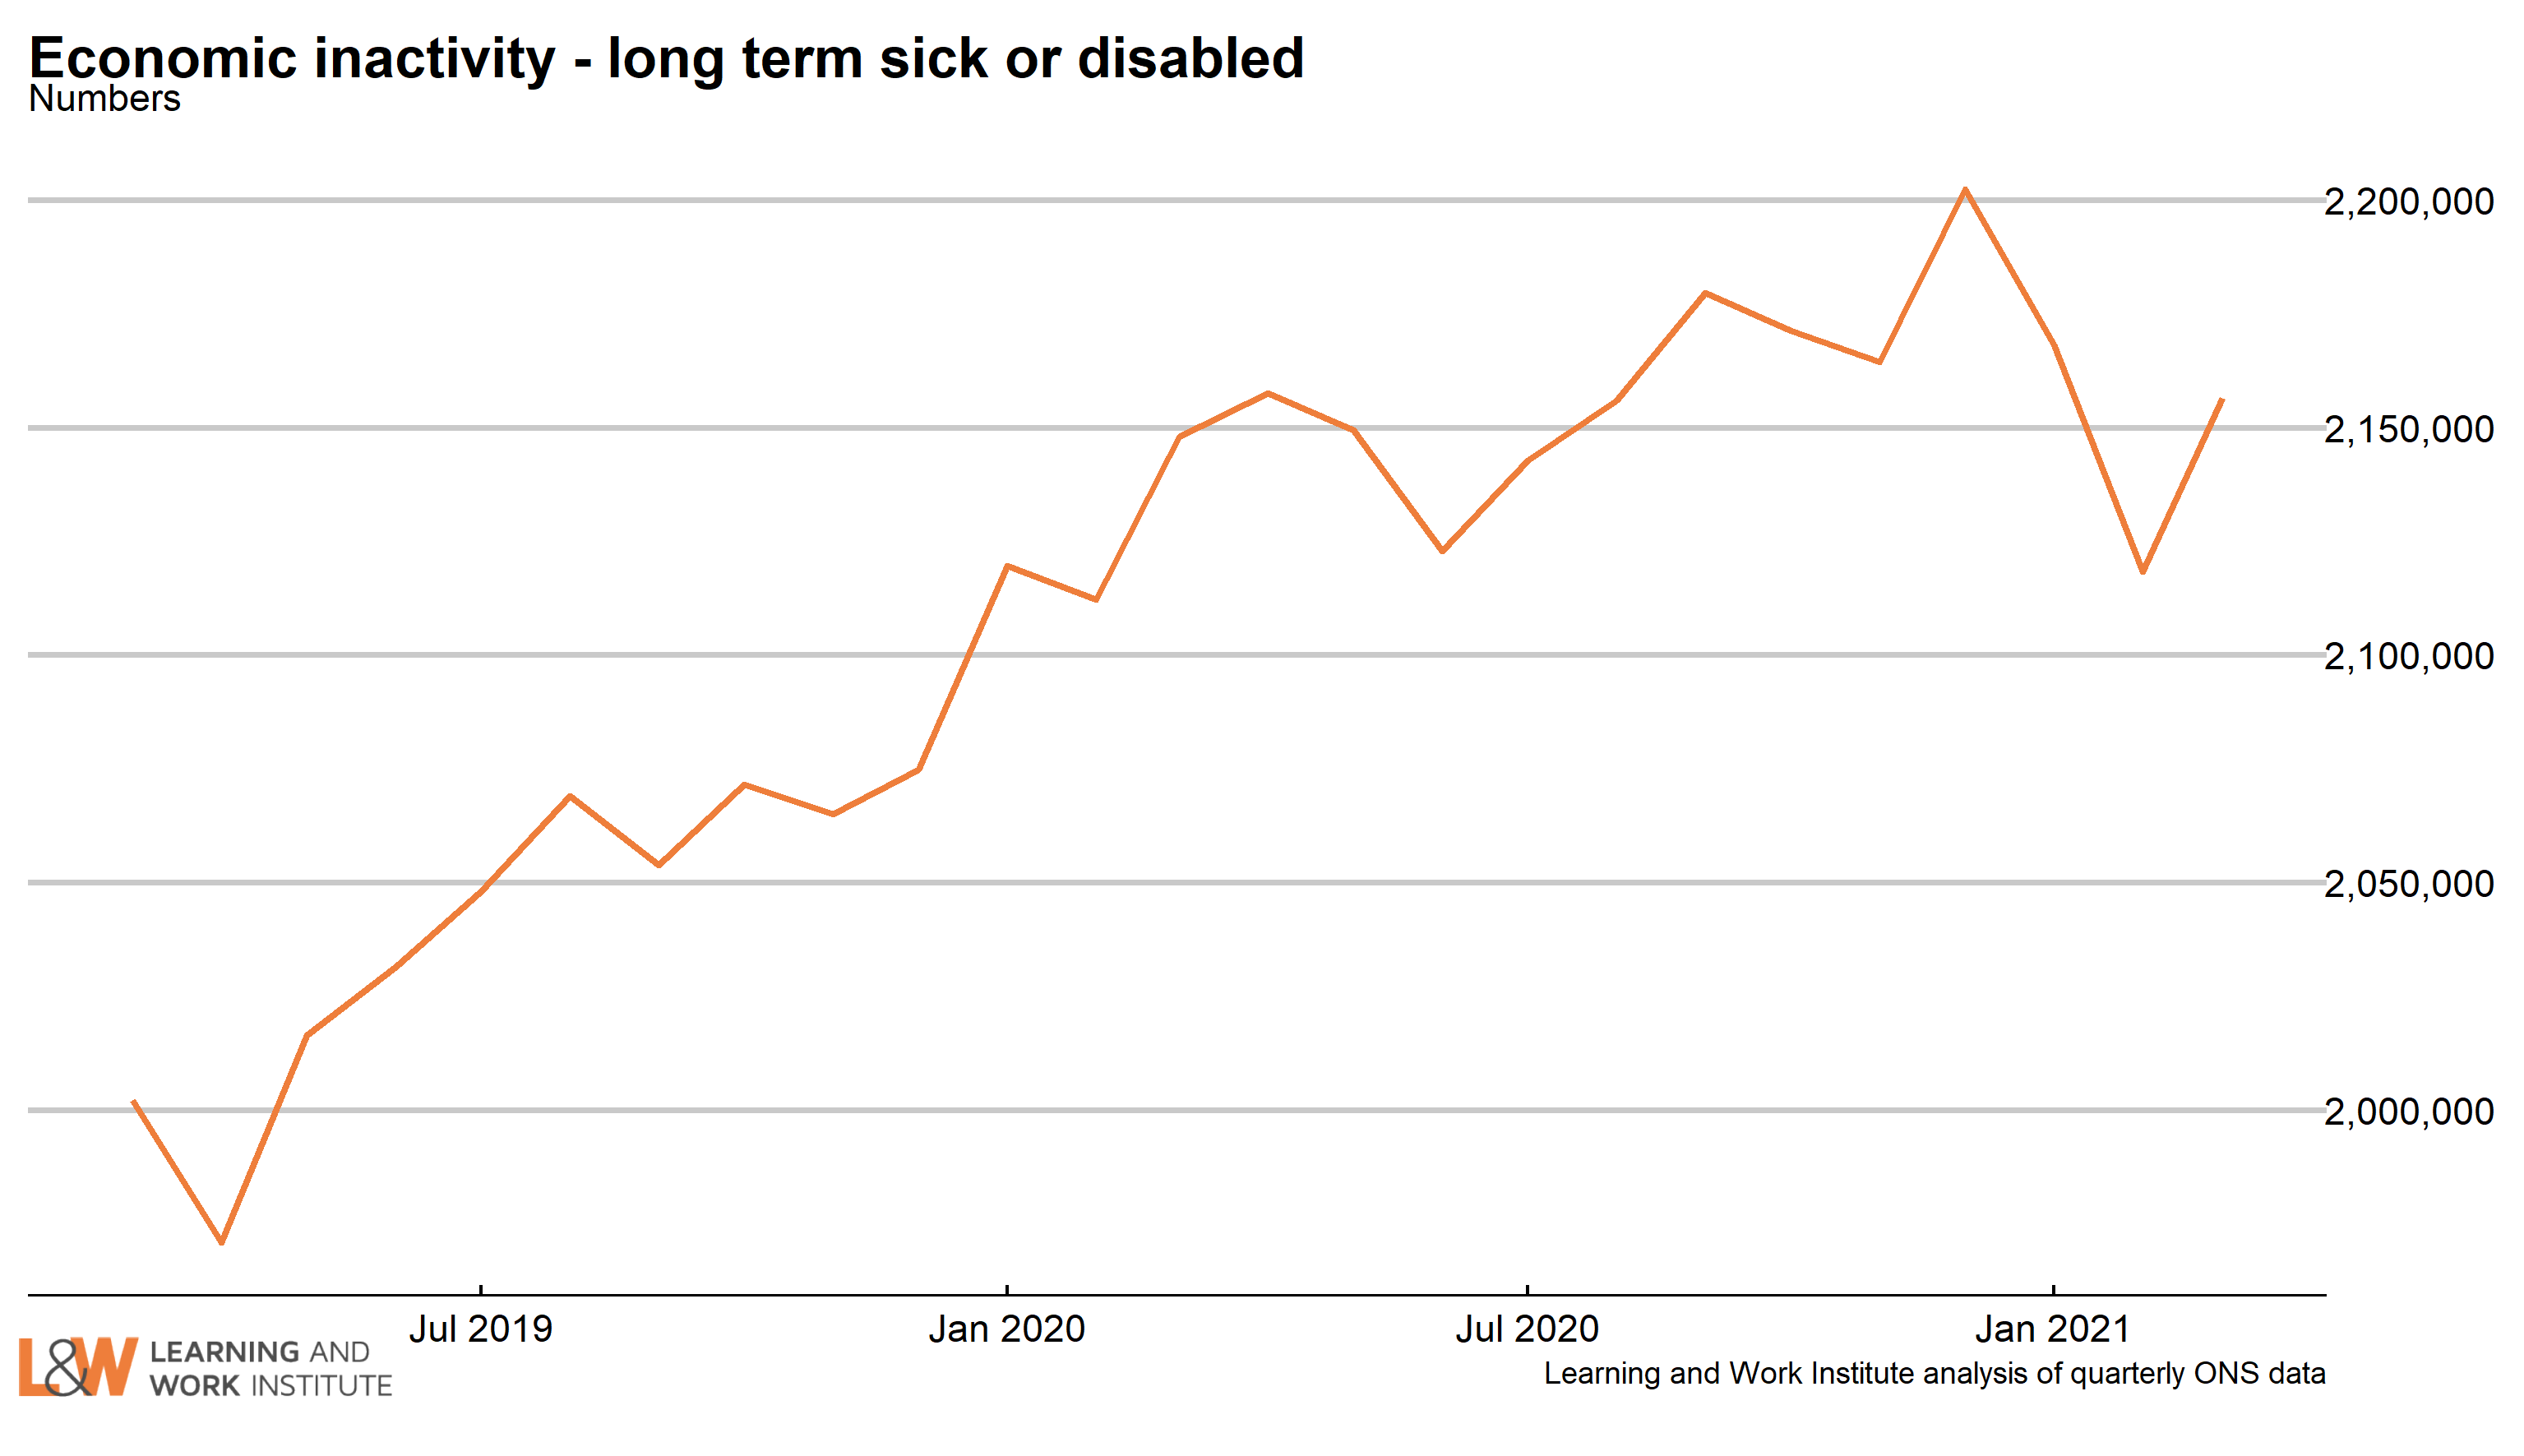 |
|
| Chart 17: Economic inactivity – people looking after family The survey figures showing those looking after family and not doing paid work or looking for paid work have been trending downwards. 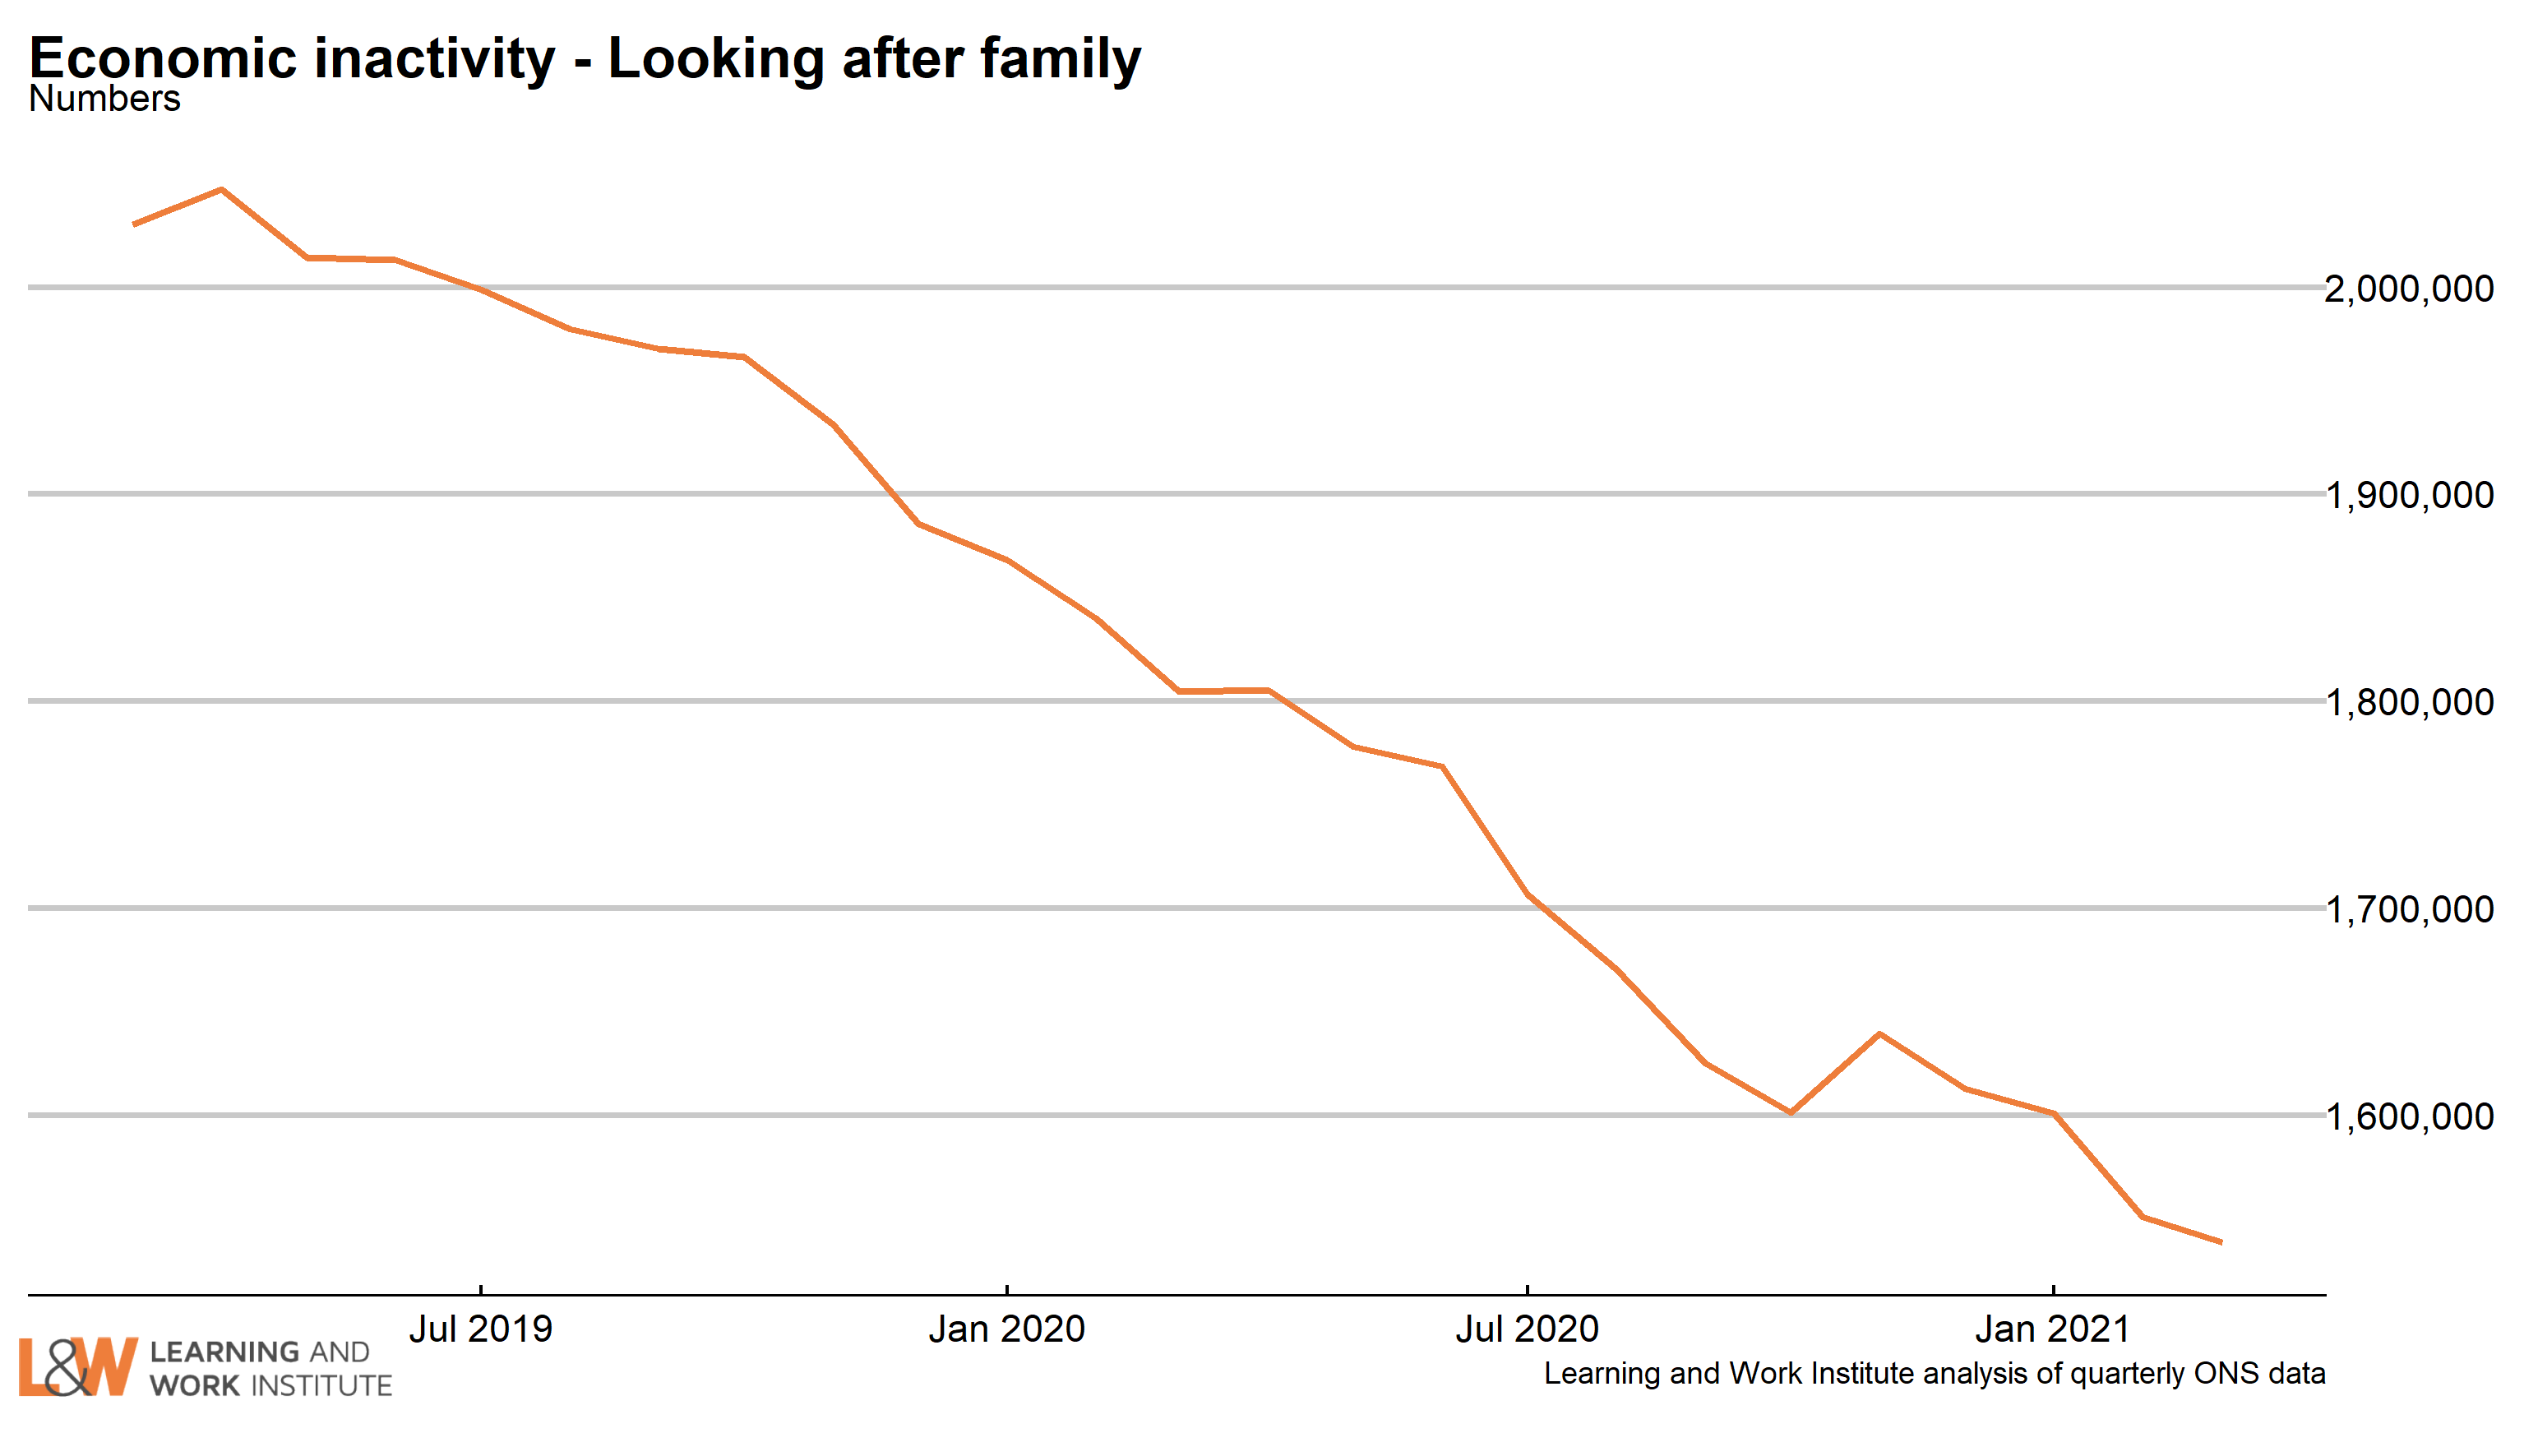 |
|
| Chart 18: Economic inactivity – other inactive In the Coronavirus period, people who were not working or looking for work due to Covid were included in this group. The number in this category increased sharply at the time, and has continued at a high level. A very high proportion of this group want to work, and this increased over the period of the pandemic. 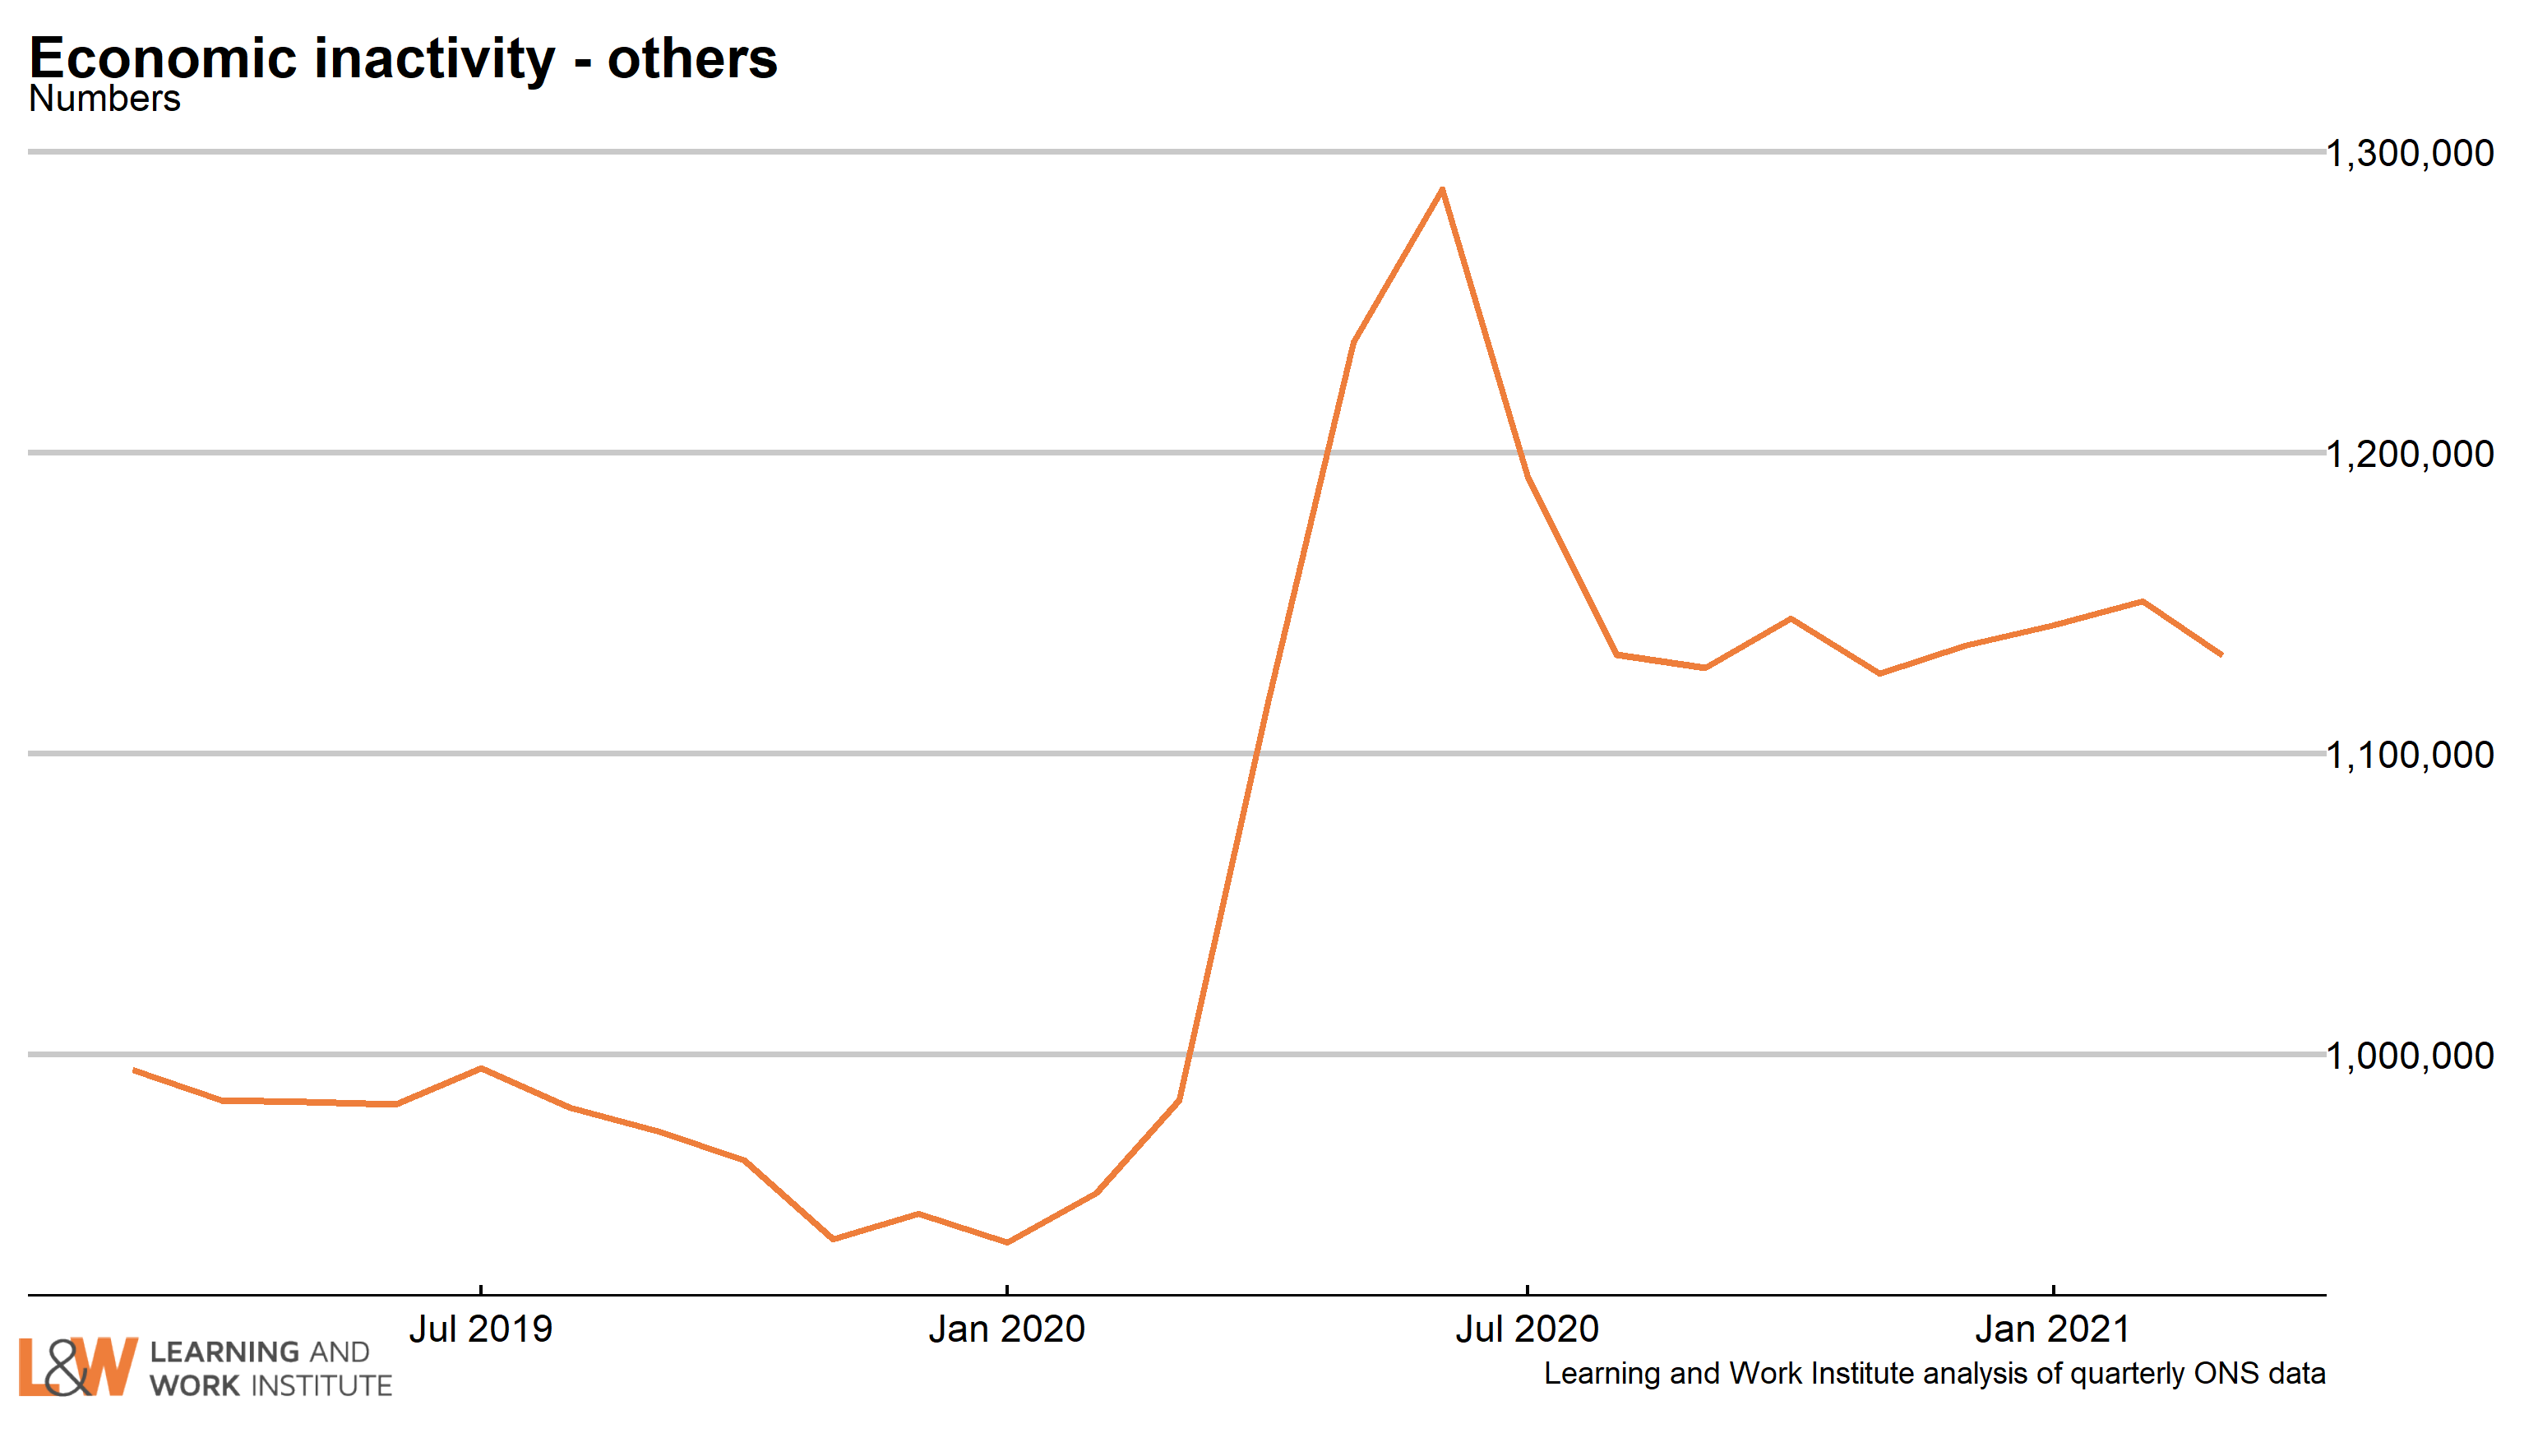 |
|
| Chart 19: Employment rate annual change in regions – January to March 2021 This quarter, one region showed a rise in the employment rate, the East of England, while two regions, Wales and Yorkshire and the Humber, showed no change over the year from January to March 2020. The employment rate fell in the remaining nine regions, with the largest falls in the East Midlands and Northern Ireland. 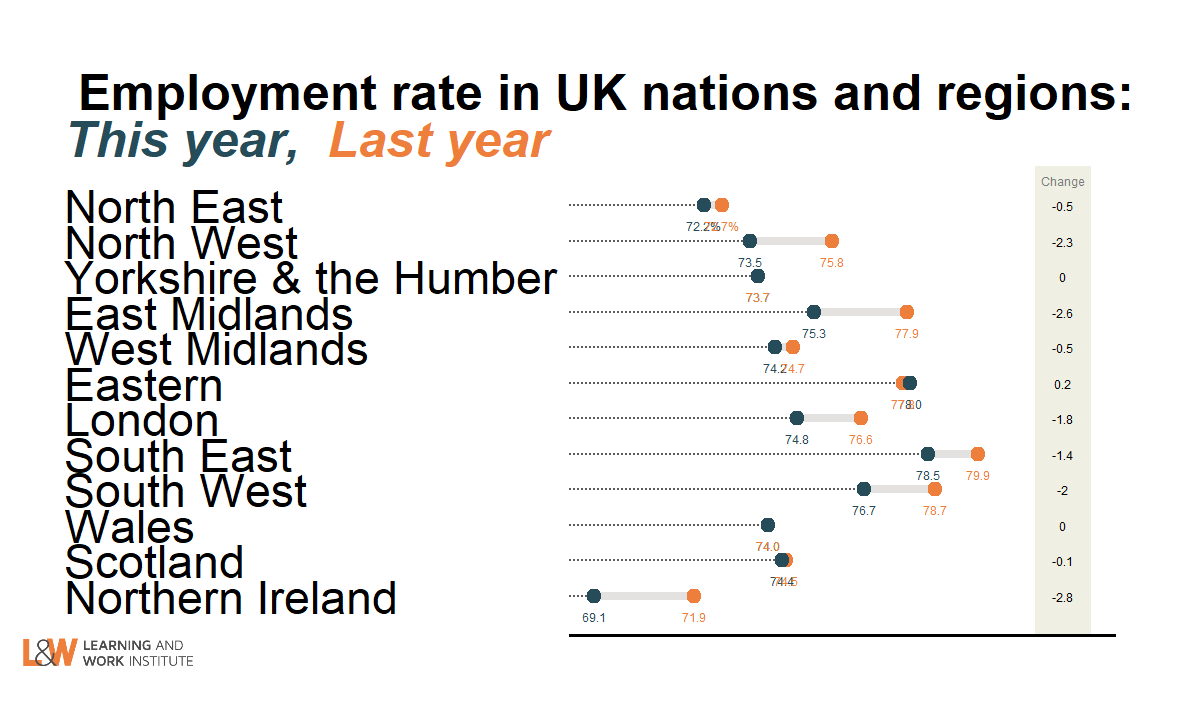 |
|
| Chart 20: Unemployment rate annual change in regions – January to March 2021 This quarter, eleven out of twelve regions showed a rise in the unemployment rate, led by London and Wales. The unemployment rate showed no change over the year in the North East. 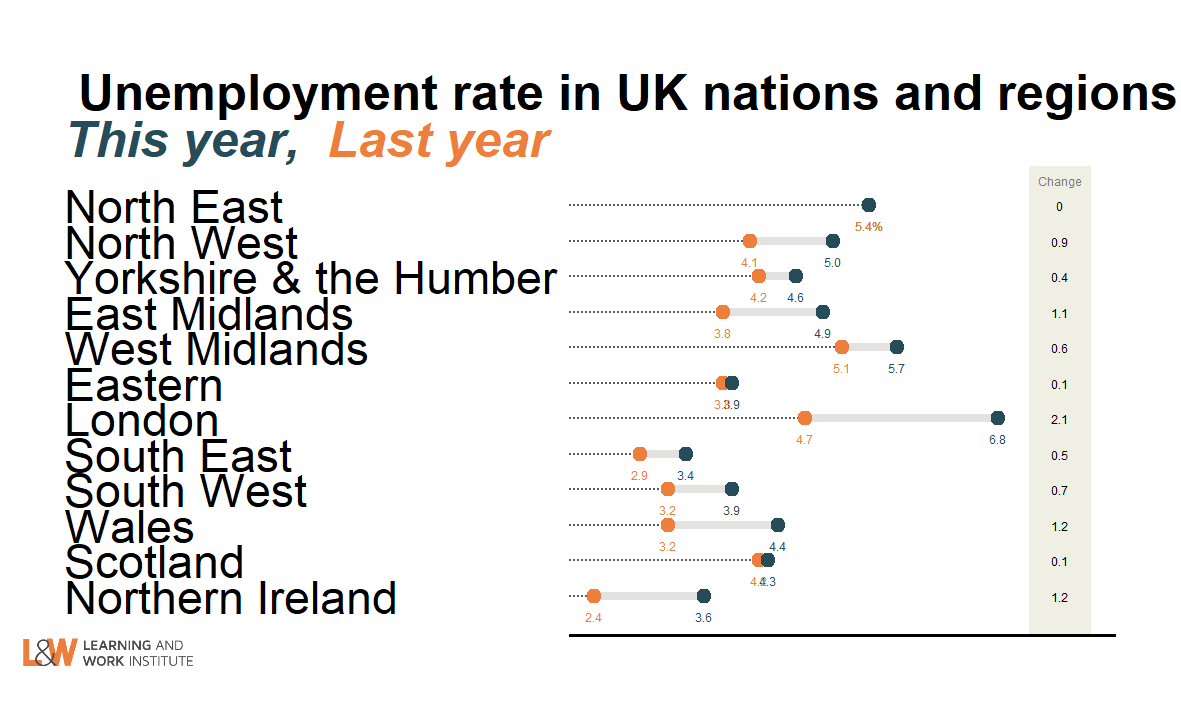 |
|
| Chart 21: Inactivity rate annual change in regions – January to March 2021 This quarter, eight regions showed a rise in the inactivity rate, led by Northern Ireland and the East Midlands. The inactivity rate fell in three regions, led by Wales and Yorkshire and the Humber. 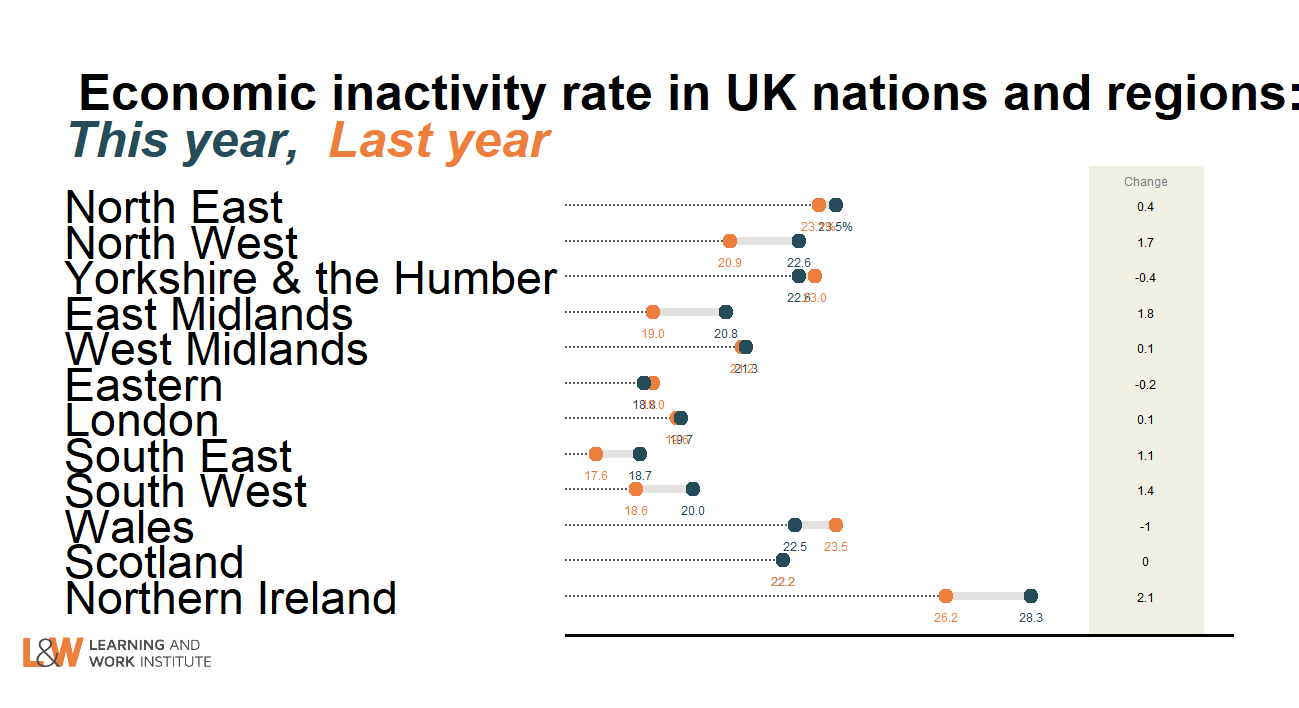 --> --> |
|
|
This newsletter is produced by Learning and Work Institute and keeps readers up to date on a wide range of learning and work issues. |
|
 |
|