 |
|
Making learning and work count
Labour market LIVE from Learning and Work Institute
12 October 2021
- Unemployment is 1,510,000, down by 40,000 from last month’s published figure (the quarterly headline fell by 126,000). The unemployment rate is 4.5%, down by 0.1 percentage points on last month and down by 0.4 percentage points on last quarter.
- The ONS figure for claimant unemployed is 2,112,800, and is down by 51,100 on last month. The claimant rate is 5.2%.
- The number of workless young people (not in employment, full-time education or training) is 854,000, down by 38,000 on the quarter, representing 12.6% of the youth population (down by 0.5 percentage points).
- Youth unemployment (including students) is 498,000, and has fallen by 40,000 on the quarter.
- Vacancies in Jul-Sep 2021 rose (in the ONS official series) to 1,102,000 after recovering strongly from the low point of 340,000 in April to June 2020.
- There are now 1.5 unemployed people per vacancy.
- The employment rate is 75.3% (up by 0.1 percentage points on last month’s published figure and is up by 0.5 percentage points in the preferred quarterly measure).
Learning and Work Institute comment
The labour market figures published on 12 October indicate a strongly improving labour market. However, employment levels remain well below those seen pre-pandemic and today’s numbers relate to periods before the Coronavirus Job Retention Scheme finished at the end of last month.
Duncan Melville, Chief Economist at Learning and Work Institute, commented:
‘The labour market continues to recover strongly. Today’s headline numbers from the Labour Force Survey (LFS) show an increase in employment of 235,000 in the three months to June to August 2021 – a very large quarterly increase by historic standards. The timelier HMRC employee payroll numbers show an increase of 207,000 in the month to September. This compares with an average monthly increase in the five years prior to the pandemic of just 31,000.
The prospects for employment growth remain positive. Vacancy levels have continued to grow strongly to around 1.1 million in July to September, after having exceeded a million for the first time in June to August. Data on job adverts from Adzuna indicate that vacancy levels continued to remain high into October. In part these very high vacancy levels reflect a range of labour shortages from HGV drivers to medical and social care staff to butchers (but not yet bakers or candle stick makers) which may in the not too distant future constrain employment and economic growth.
Given rapidly rising employment it is not a surprise that unemployment and inactivity amongst people of working age have both fallen substantially: down by 126,000 and 91,000 respectively in the three months to June to August 2021. This quarterly fall in unemployment was the largest in seven years.
Despite the ongoing recovery in the labour market, employment remains substantially lower than it was pre-pandemic. Compared to December 2019 to February 2020, employment in June to August 2021 was 657,000 lower. That we have labour shortages in this context is thus concerning. Pertinent here are the claimant count numbers. There are still around 2.1 million people on the claimant count, nearly 900,000 higher than pre-pandemic and around 600,000 above the official survey measure of unemployment, having been below this measure pre-pandemic. This suggests that substantial numbers of people are receiving unemployment-related benefits, but who are not either looking for work or available to start work. This raises concerns about the current efficacy of employment support designed to help individuals move into work.
The headline wage growth statistics released by ONS are distorted by two factors. Compositional changes in employment as people on lower wages were more likely to lose their jobs in the last year plus large numbers of people experienced a drop in wages while furloughed and have now returned to their previous jobs and pay levels. Allowing for these factors, the ONS estimate that underlying regular pay (excluding bonuses – a better measure of wage trends) rose by between 4.1 and 5.6 percent in the last year. This is an increase on last month’s estimate of 3.6 to 5.1 percent. This pick up presumably reflects the impact of labour shortages with employers having to raise wages to attract and retain workers. After a decade and more of very muted wages this could be good news for living standards but only if productivity also rises to warrant these increases. Ongoing investment in skills is key here. In the absence of productivity increases, these wage increases could add to costs pressures causing businesses to raise prices. There are already inflationary pressures in the system notably from increasing food and fuel prices and economic commentators are increasingly expecting some rise in interest rates from the Bank of England before the end of the year.
All the data released today relate to periods before the Coronavirus Job Retention Scheme (CJRS) finished at the end of September. The latest official HMRC numbers indicate that there were 1,325,000 people on furlough at end of August. If the fall over September was the same as the August fall, then there would have been around 1.1m people furloughed when it ended.
There has been much comment recently that the low level of HR1 notifications of an intention to undertake redundancies reported by the Insolvency Service mean that there will be only a (very) limited unemployment impact of the end of the CJRS. This may be overly optimistic. HR1 notifications only apply where an employer is planning to make at least 20 redundancies. Nearly two thirds (62 percent) of furloughed workers are with employers who employ less than 20 workers and who, by definition, do not need to submit a HR1 notification. Overall, three quarters of furloughed workers are with employers employing less than 50 workers. Those in the 21-50 size band would need to be planning to make a very large proportion of their workers redundant to need to submit a HR1 notification. Hence, the HR1 statistics are likely to be picking up very few planned redundancies amongst the small organisations where the bulk of furloughed workers are employed. Hence, the impact on unemployment of the end of the CJRS may well turn out to more substantial than some optimistic commentators are expecting. ’
Employment is up by 235,000 between March-May 2021 and June-August 2021. Since the pandemic started (December-February 2020), employment is down 657,000.
Unemployment fell by 126,000 between March-May 2021 and June-August 2021, and the unemployment rate decreased by 0.4 percentage points to 4.5% in the quarter. Since the pandemic started (December-February 2020), unemployment is up 146,000.
Economic inactivity has fallen by 91,000 between March-May 2021 and June-August 2021. and the inactivity rate decreased by 0.2 percentage points to 21.1% in the quarter. Since the pandemic started (December-February 2020), inactivity is up 346,000.
The national claimant count fell by 51,100 in the month to September 2021.
Youth unemployment fell by 40,000 in the quarter. There are 498,000 unemployed young people, and 301,000 (4.4% of the youth population) who are unemployed and not in full-time education.
Self-employment is down by 762,000 since the pandemic started. The number of employees rose by 156,000 over the same period. Involuntary part-time employment is up by 113,00 since the pandemic started to 1.0 million, 12.7% of all part-time workers. Involuntary temporary employment is up 124,000 since the pandemic started to 30.2% of all temporary workers. |
|
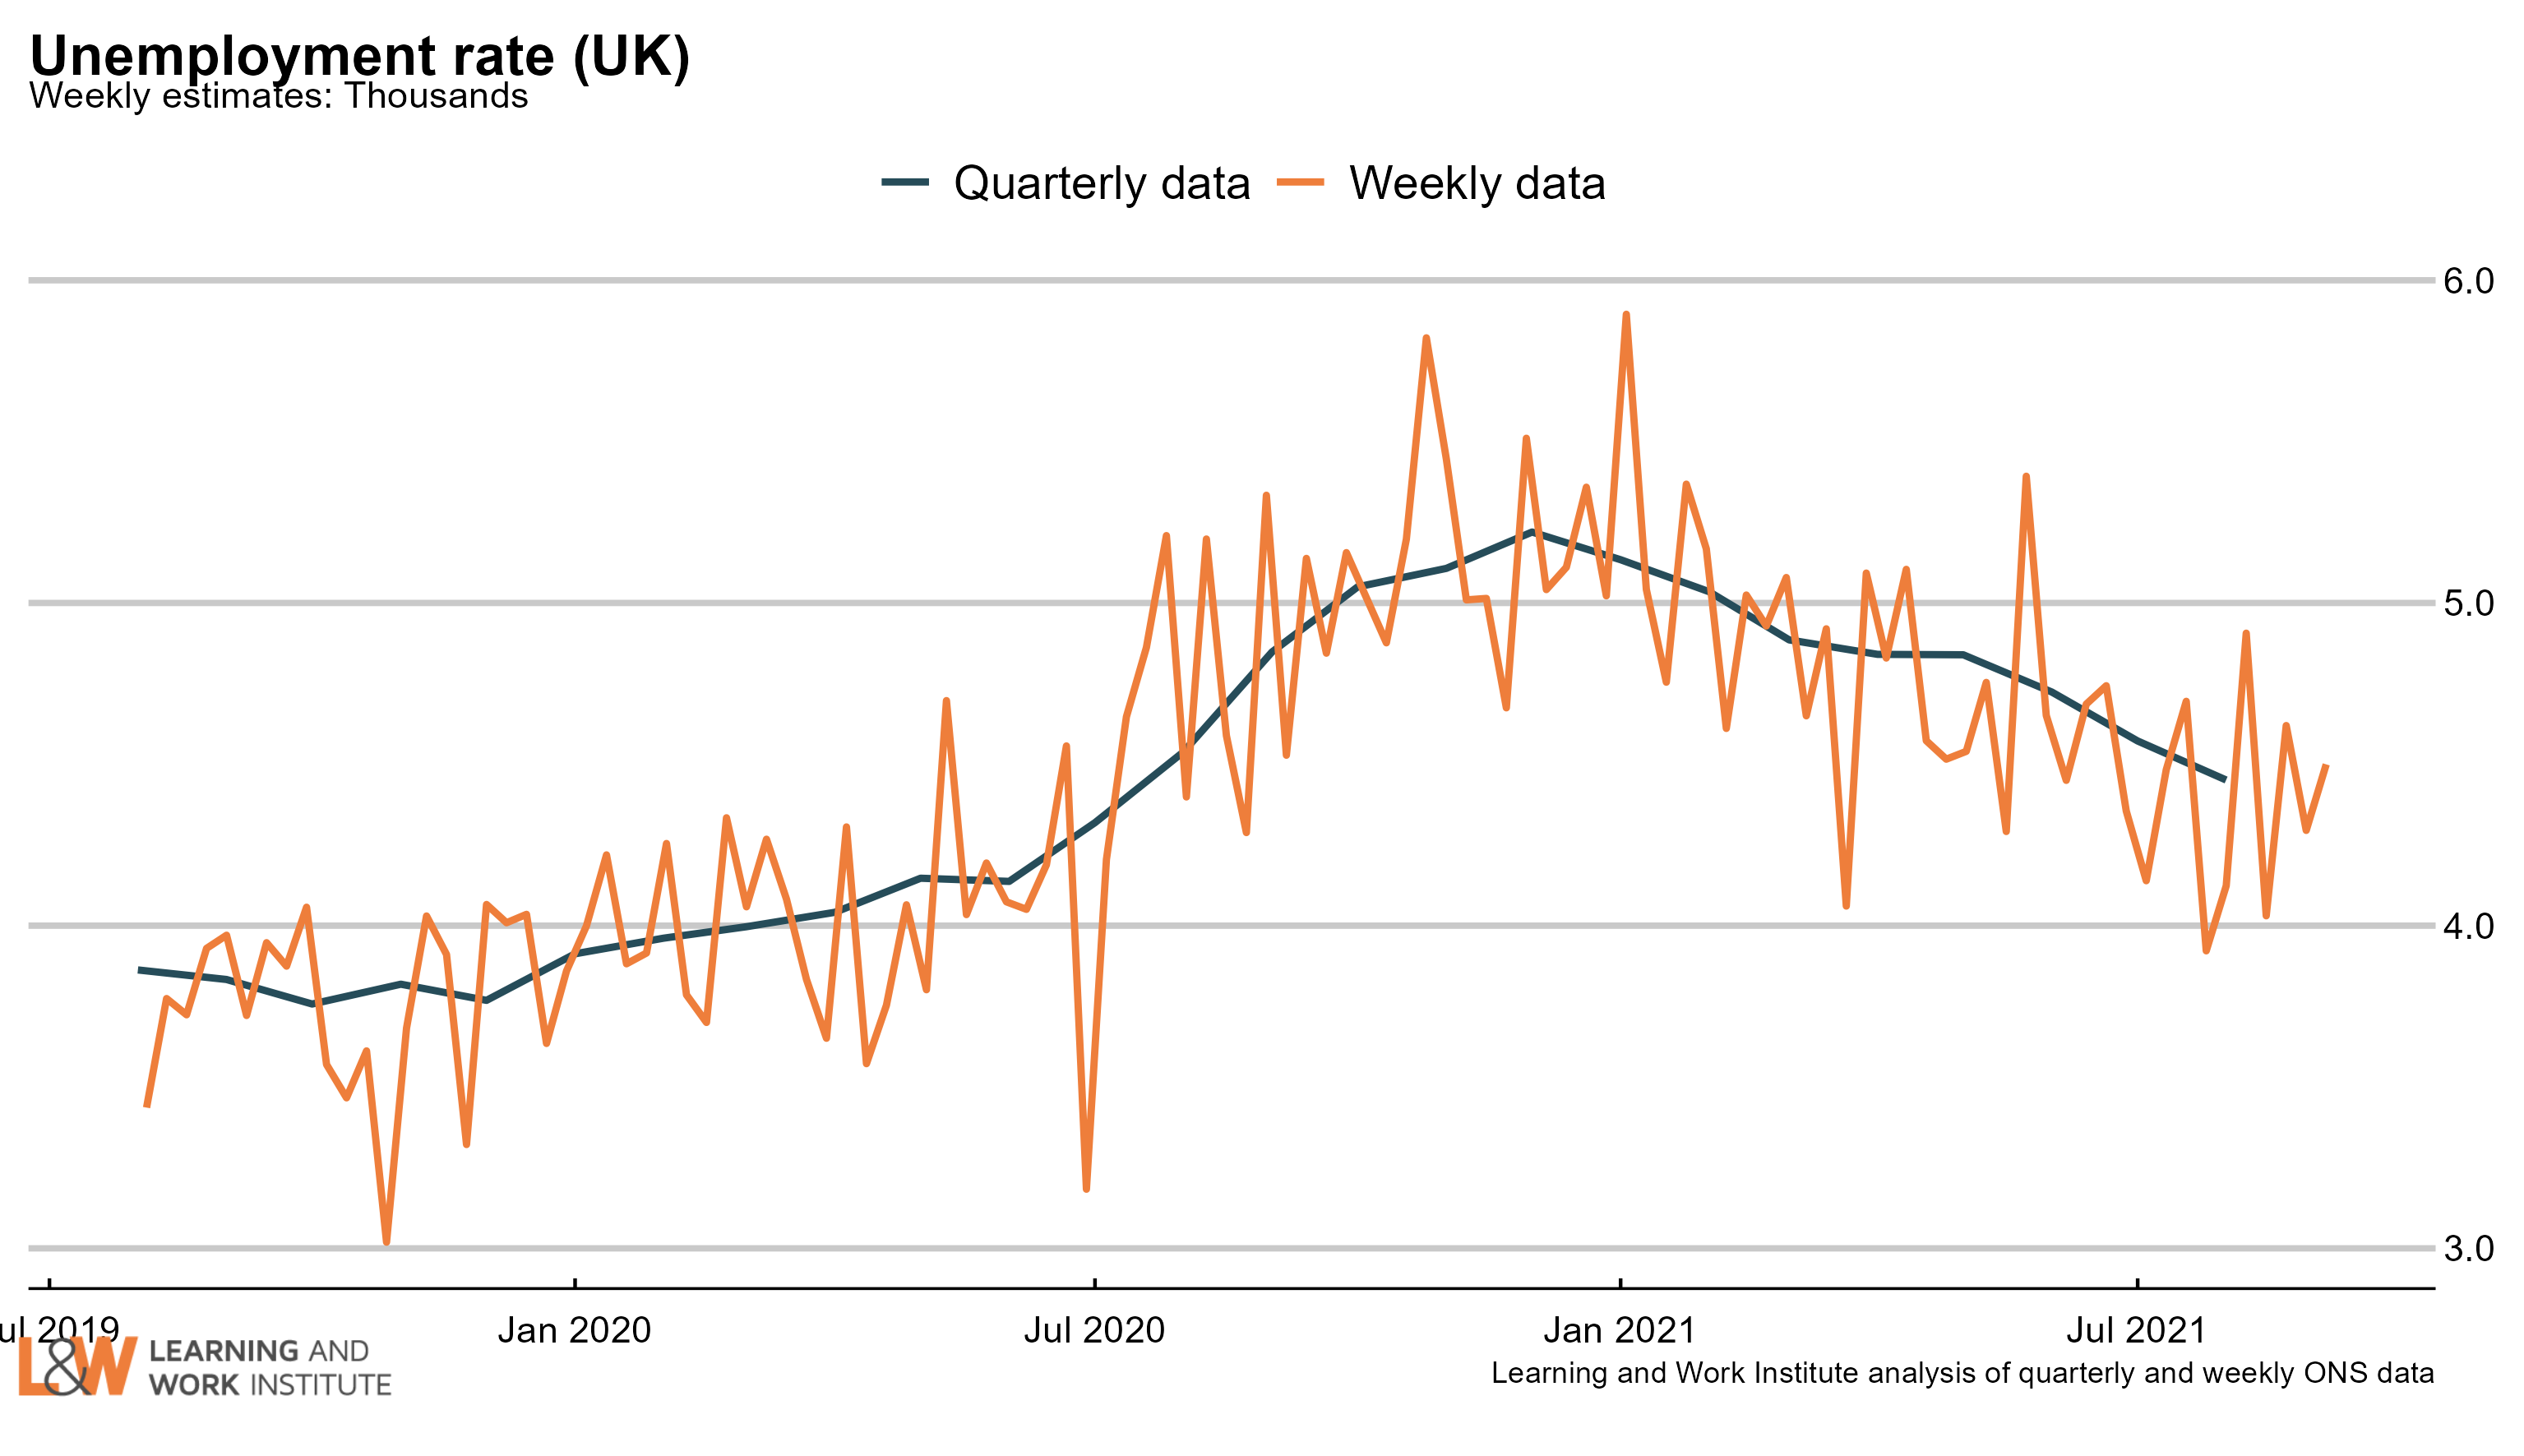
Chart 1: UK unemployment (ILO)
The latest unemployment rate fell by 0.1 percentage points to 4.5% compared to last month's figures. The experimental weekly statistics show a stabilisation around this level.
 |
|
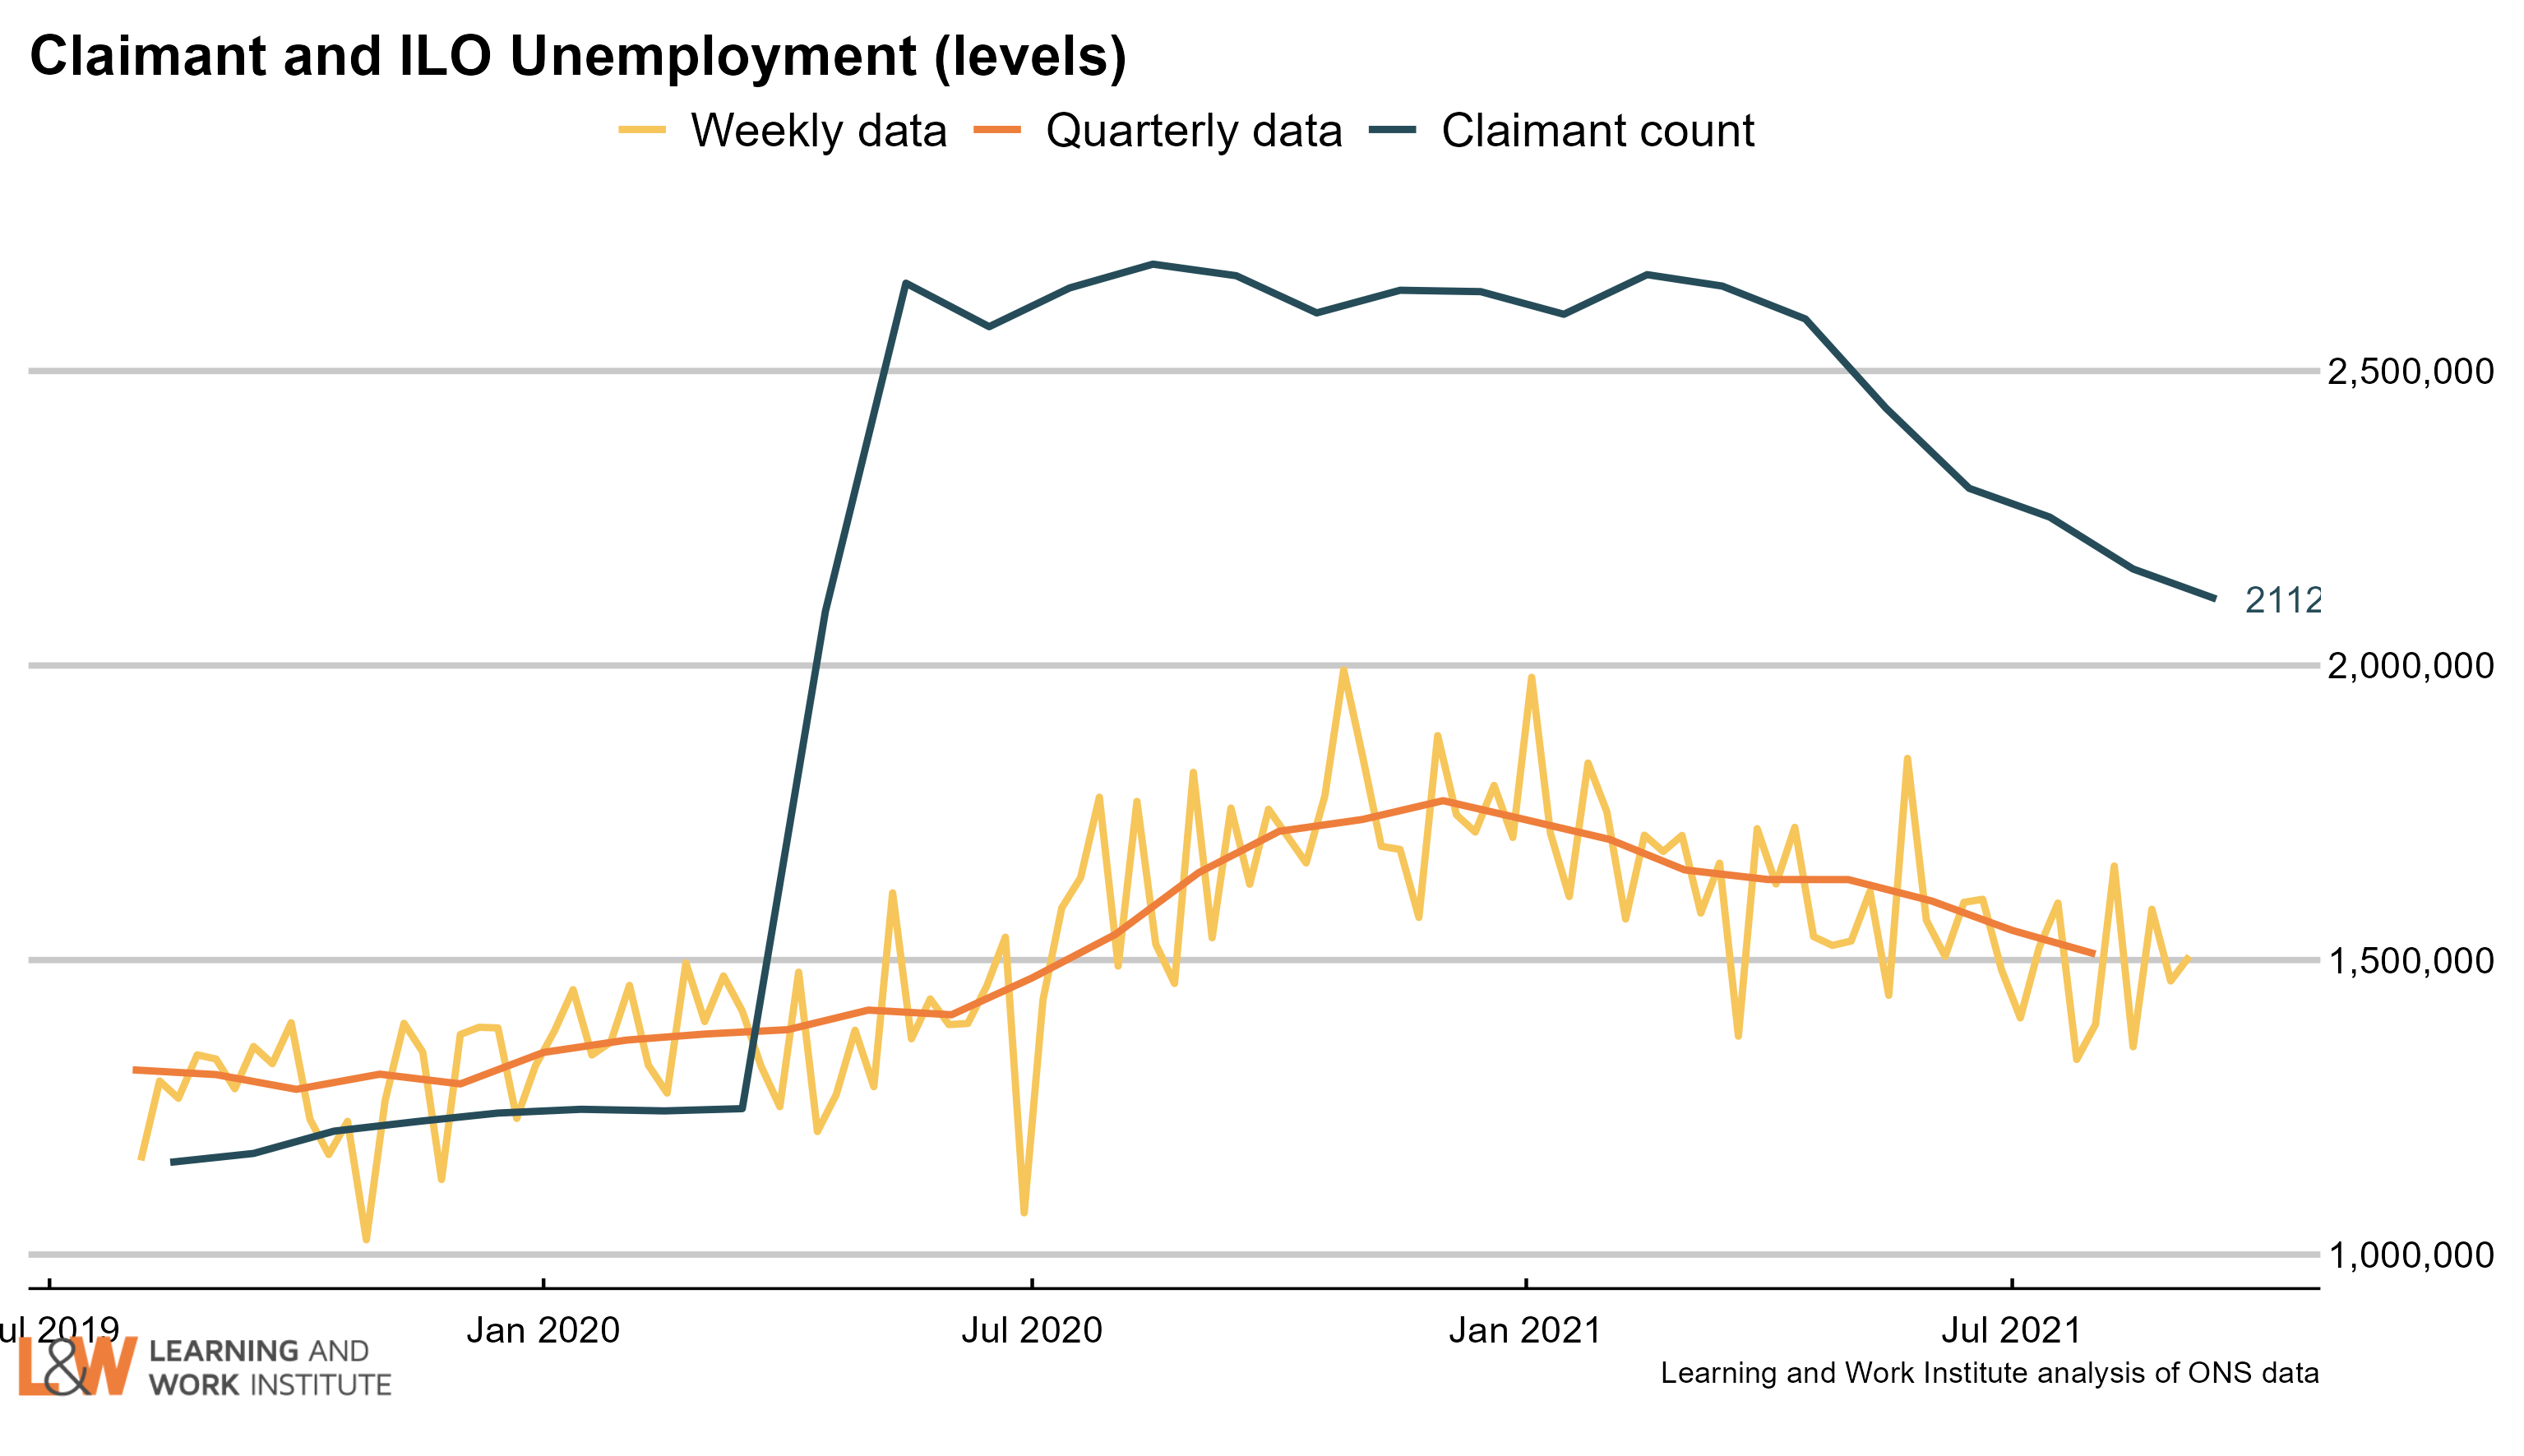
Chart 2: The claimant count and UK unemployment compared
The number of unemployed people who are claiming unemployment-related benefits is now 602,700 higher than the number of unemployed in the official measure. This difference is highly unusual - due to differences in defining unemployment the official measure is normally higher than the claimant measure.
 |
|
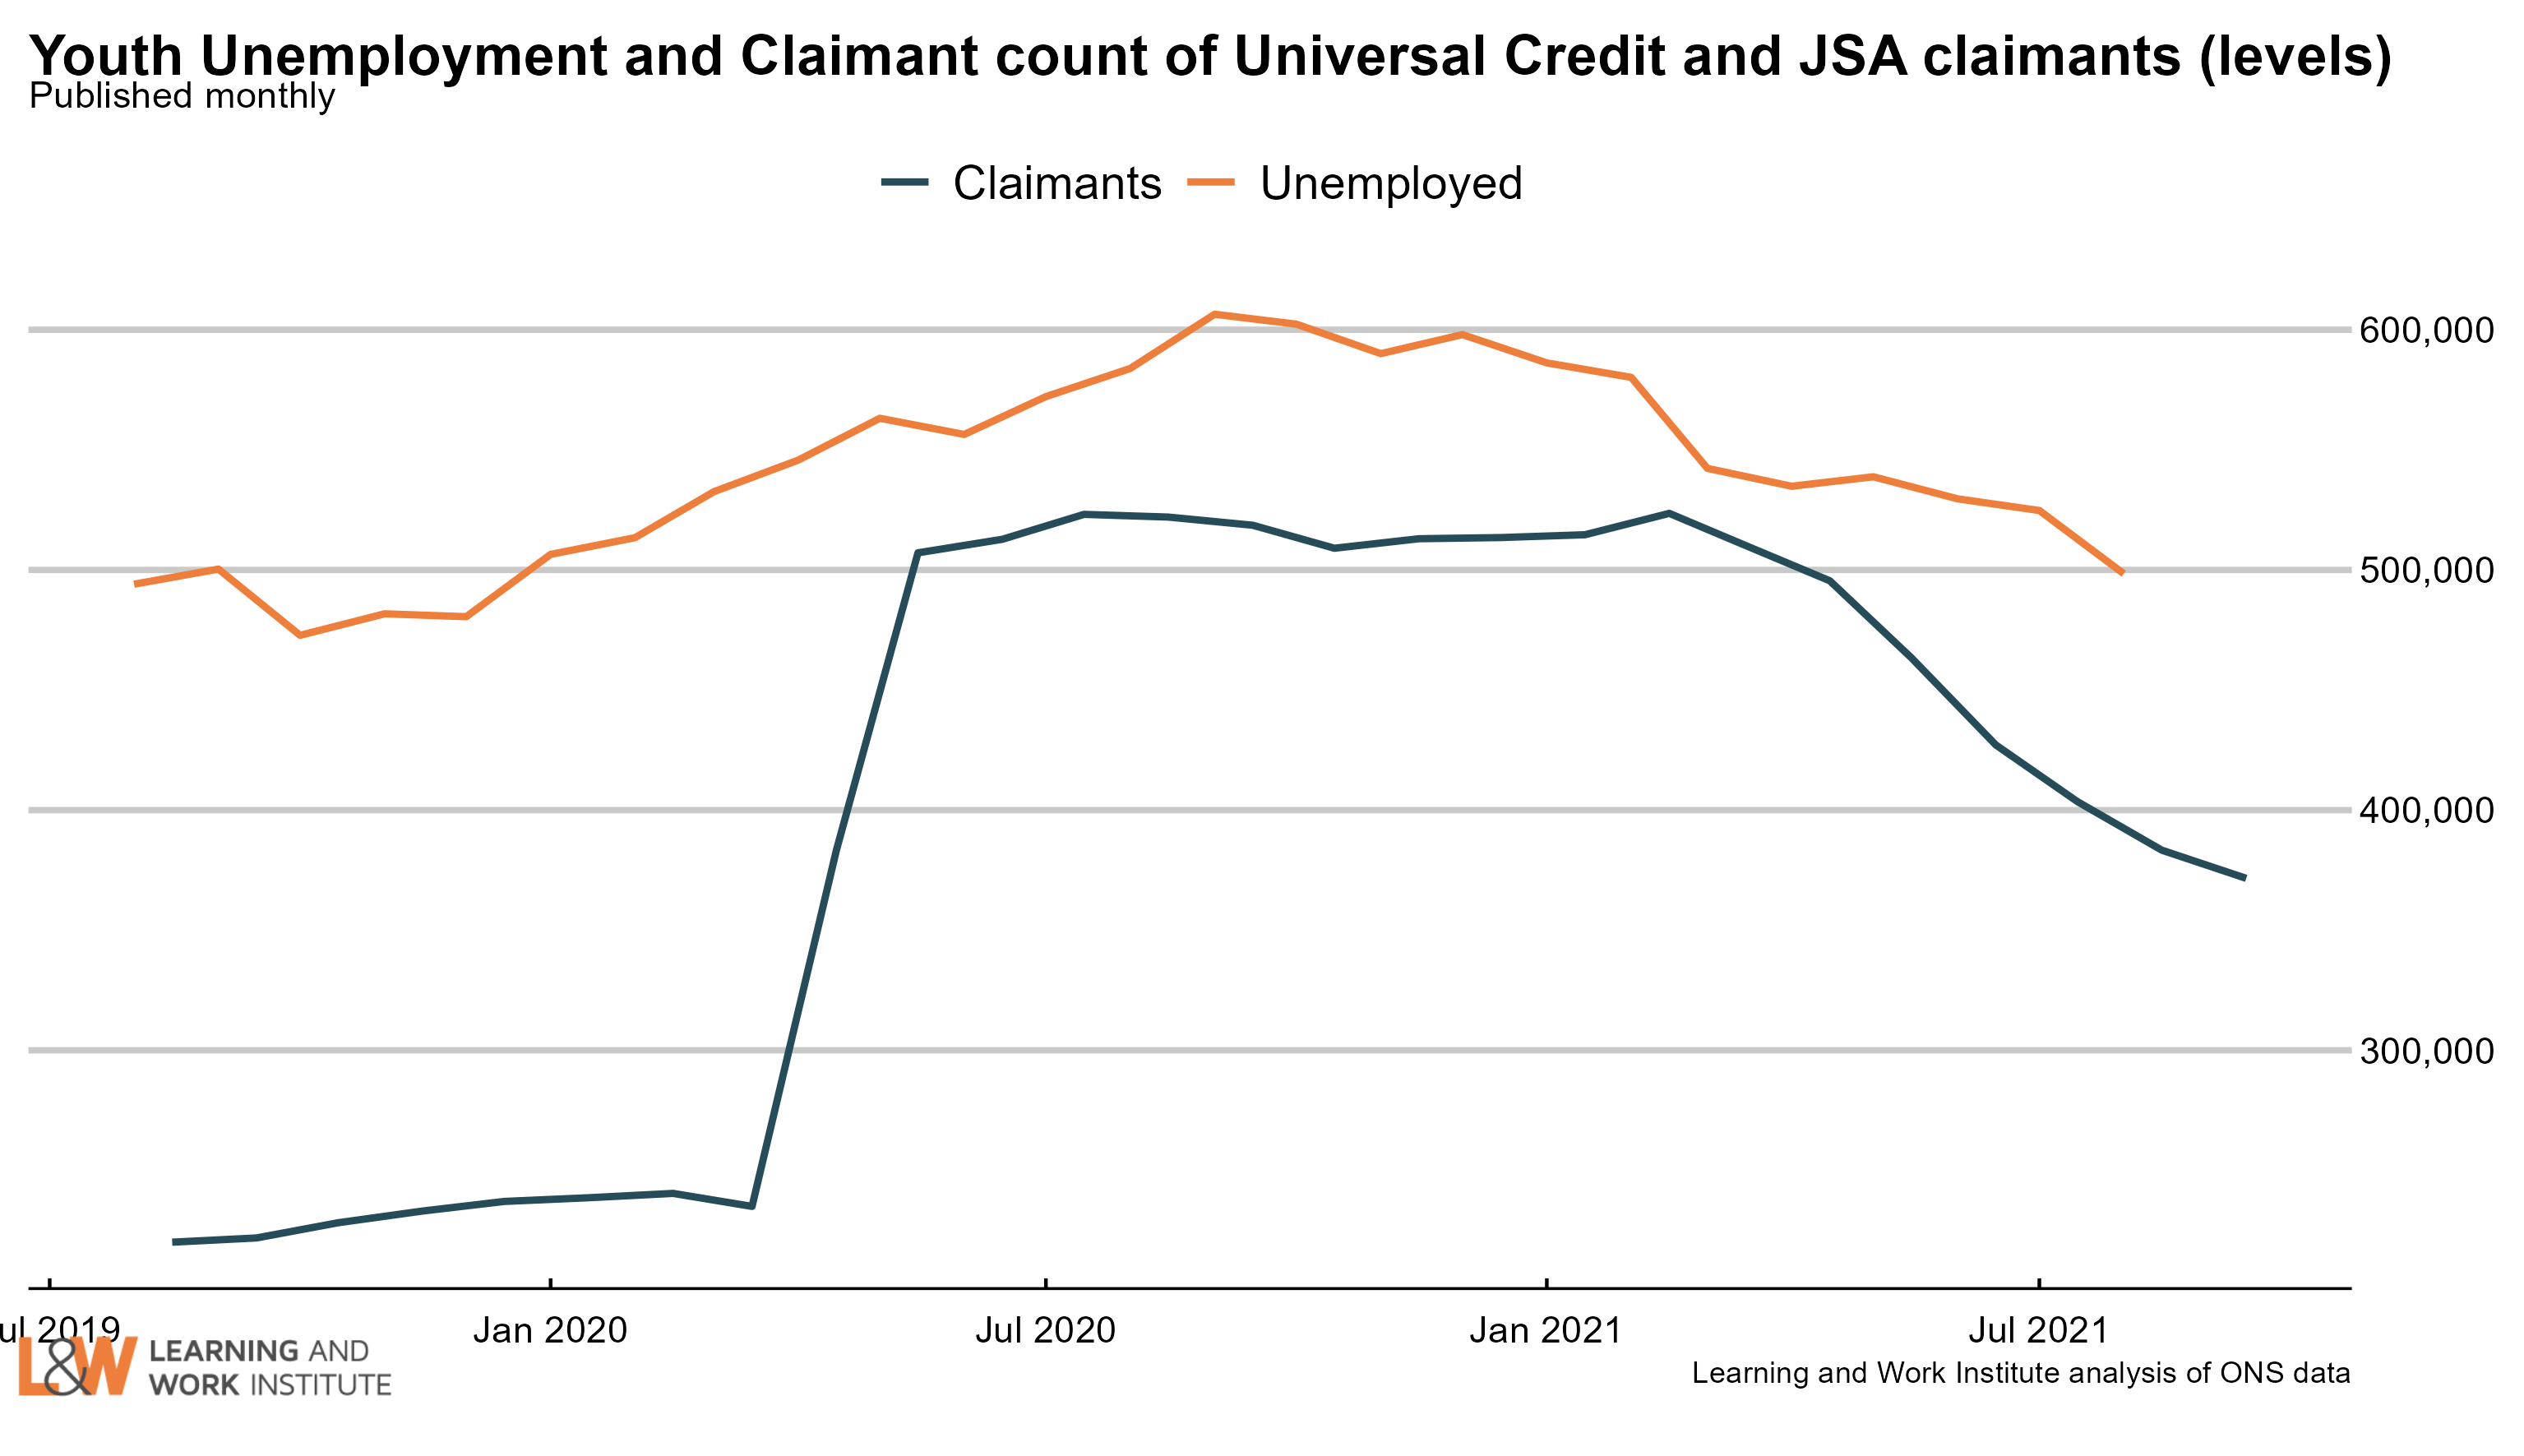
Chart 3: Youth unemployment
The number of unemployed young people fell by 26,000 since last month’s figures, to 498,000.
Meanwhile, the number of young Universal Credit or Jobseeker’s Allowance claimants was down by last month by 11,700, to 371,600.
 |
|
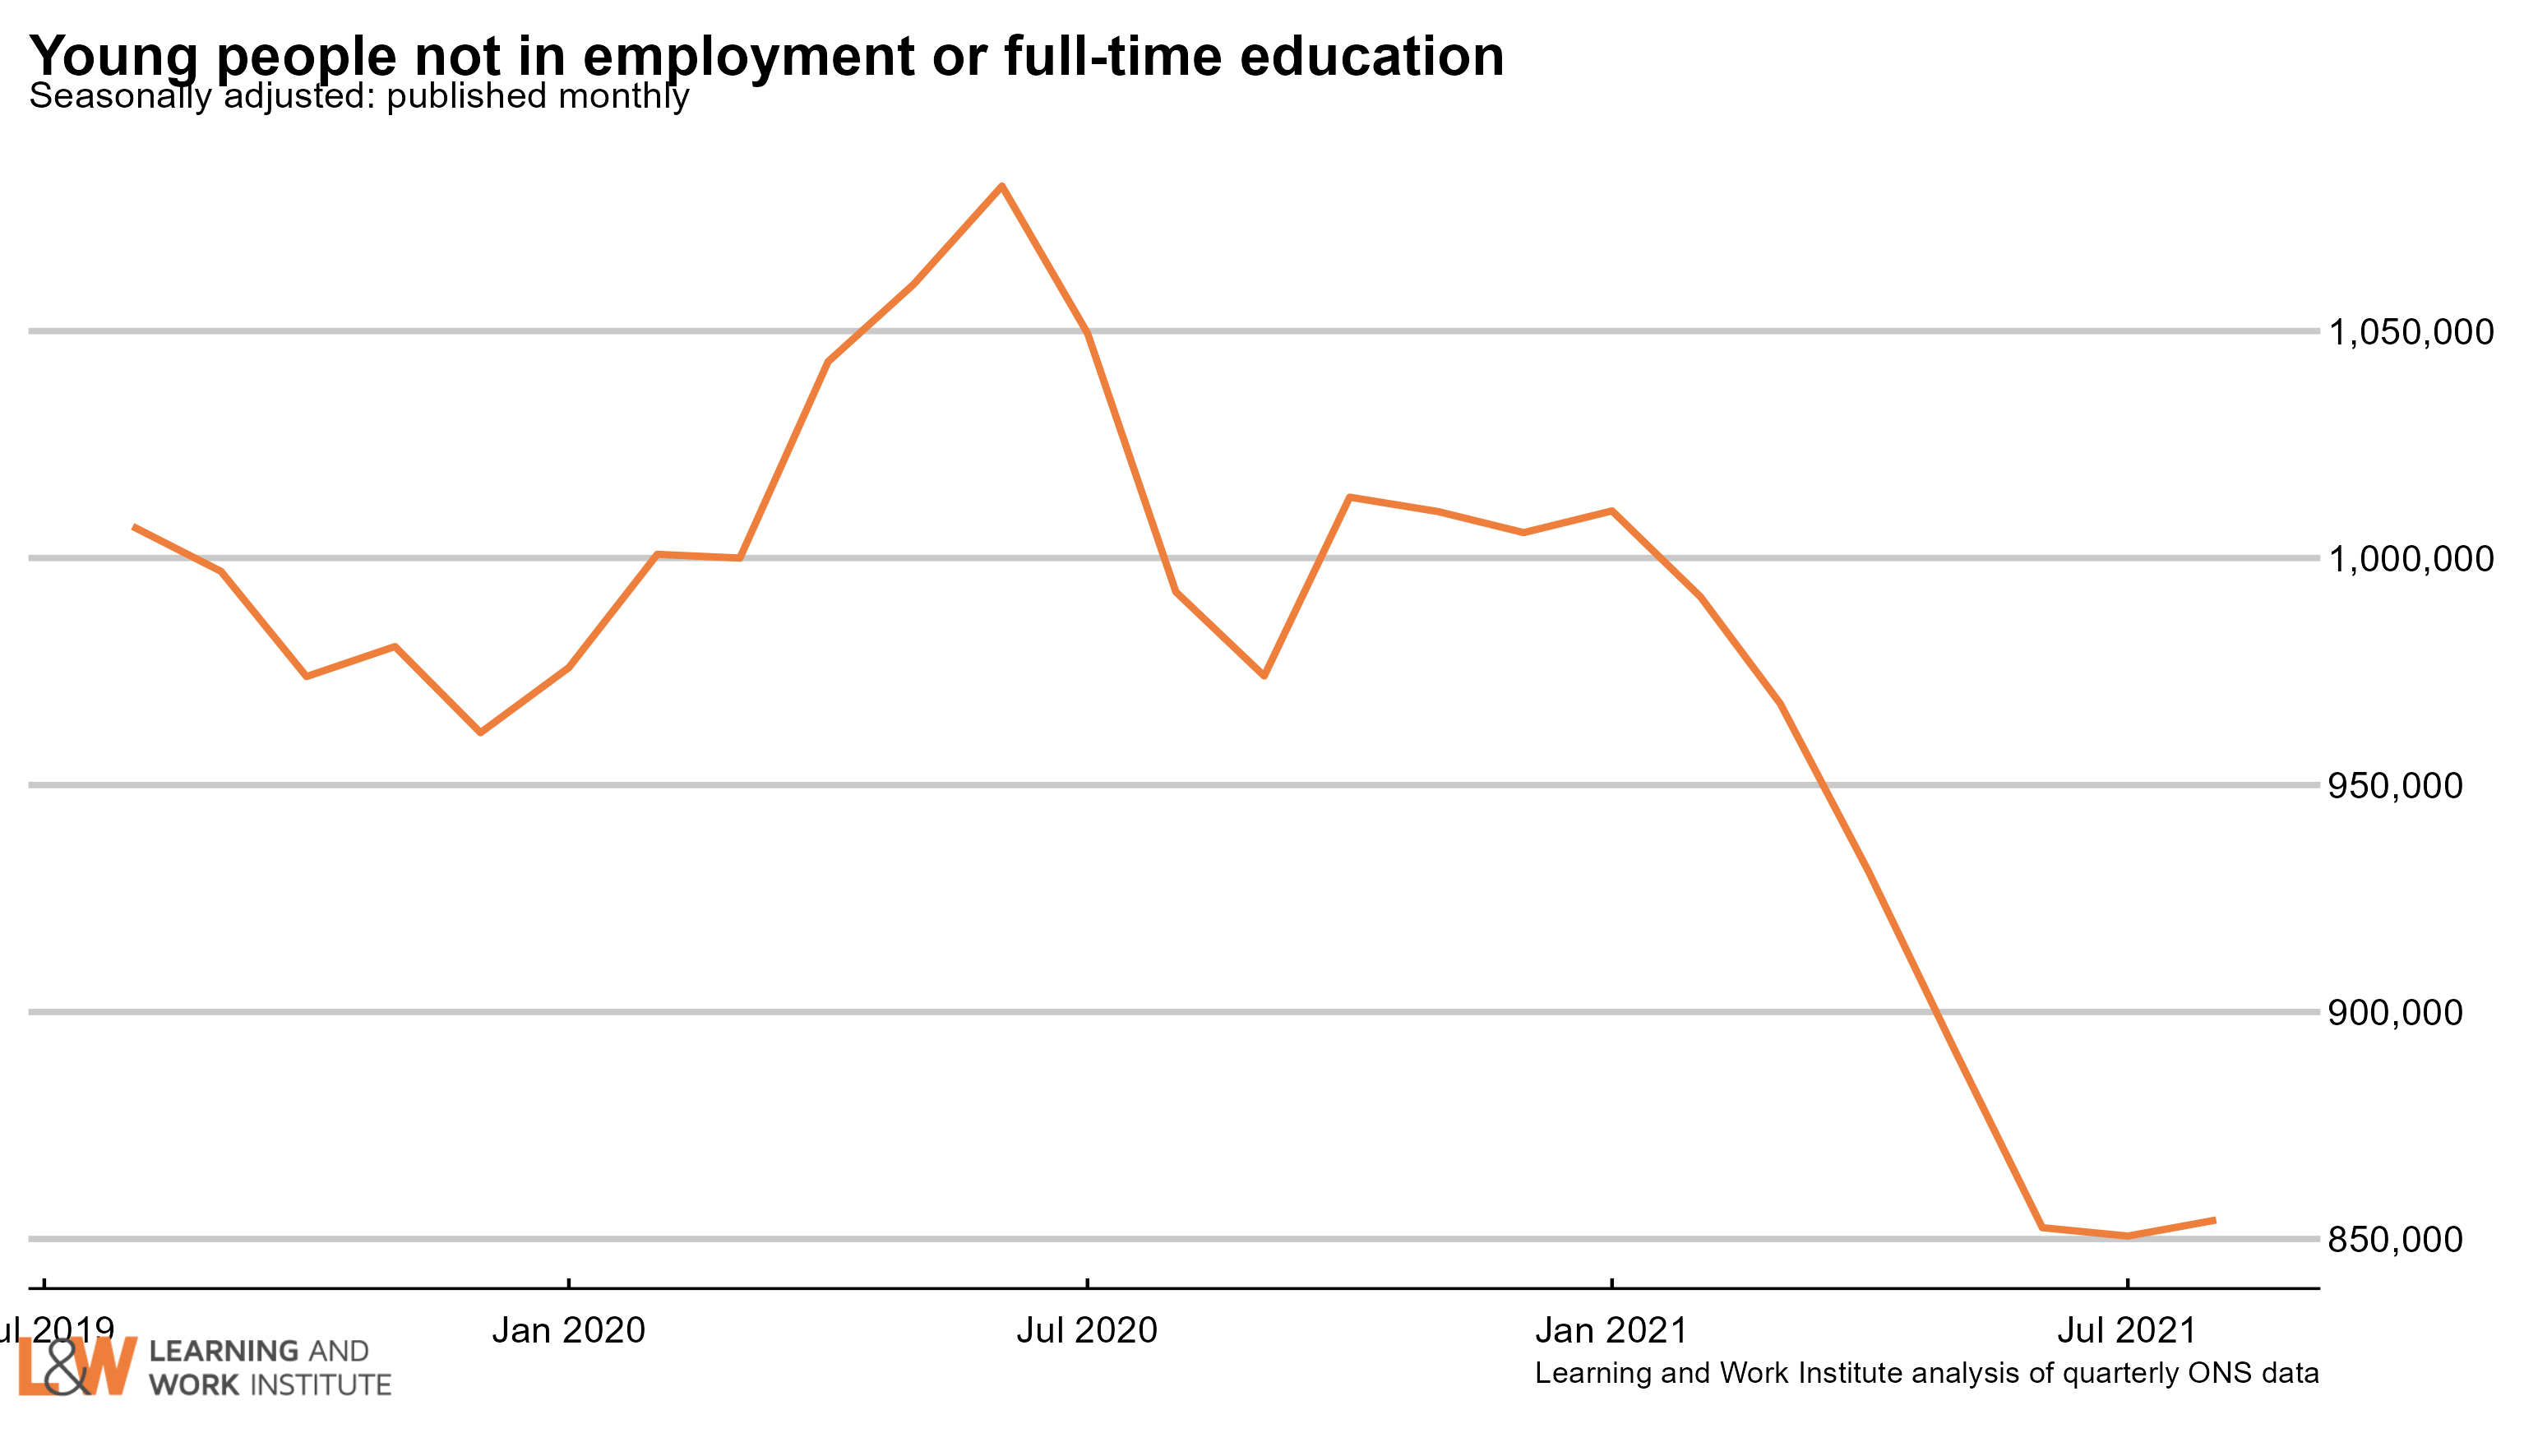
Chart 4: Young people not in employment, full-time education or training
The number of out of work young people who are not in full-time education (854,000) fell by 38,000 in the last quarter, or 4.2%. The number of economically inactive young people not in full-time education rose 19,000. The number of unemployed young people not in full-time education or training fell 56,000.
 |
|
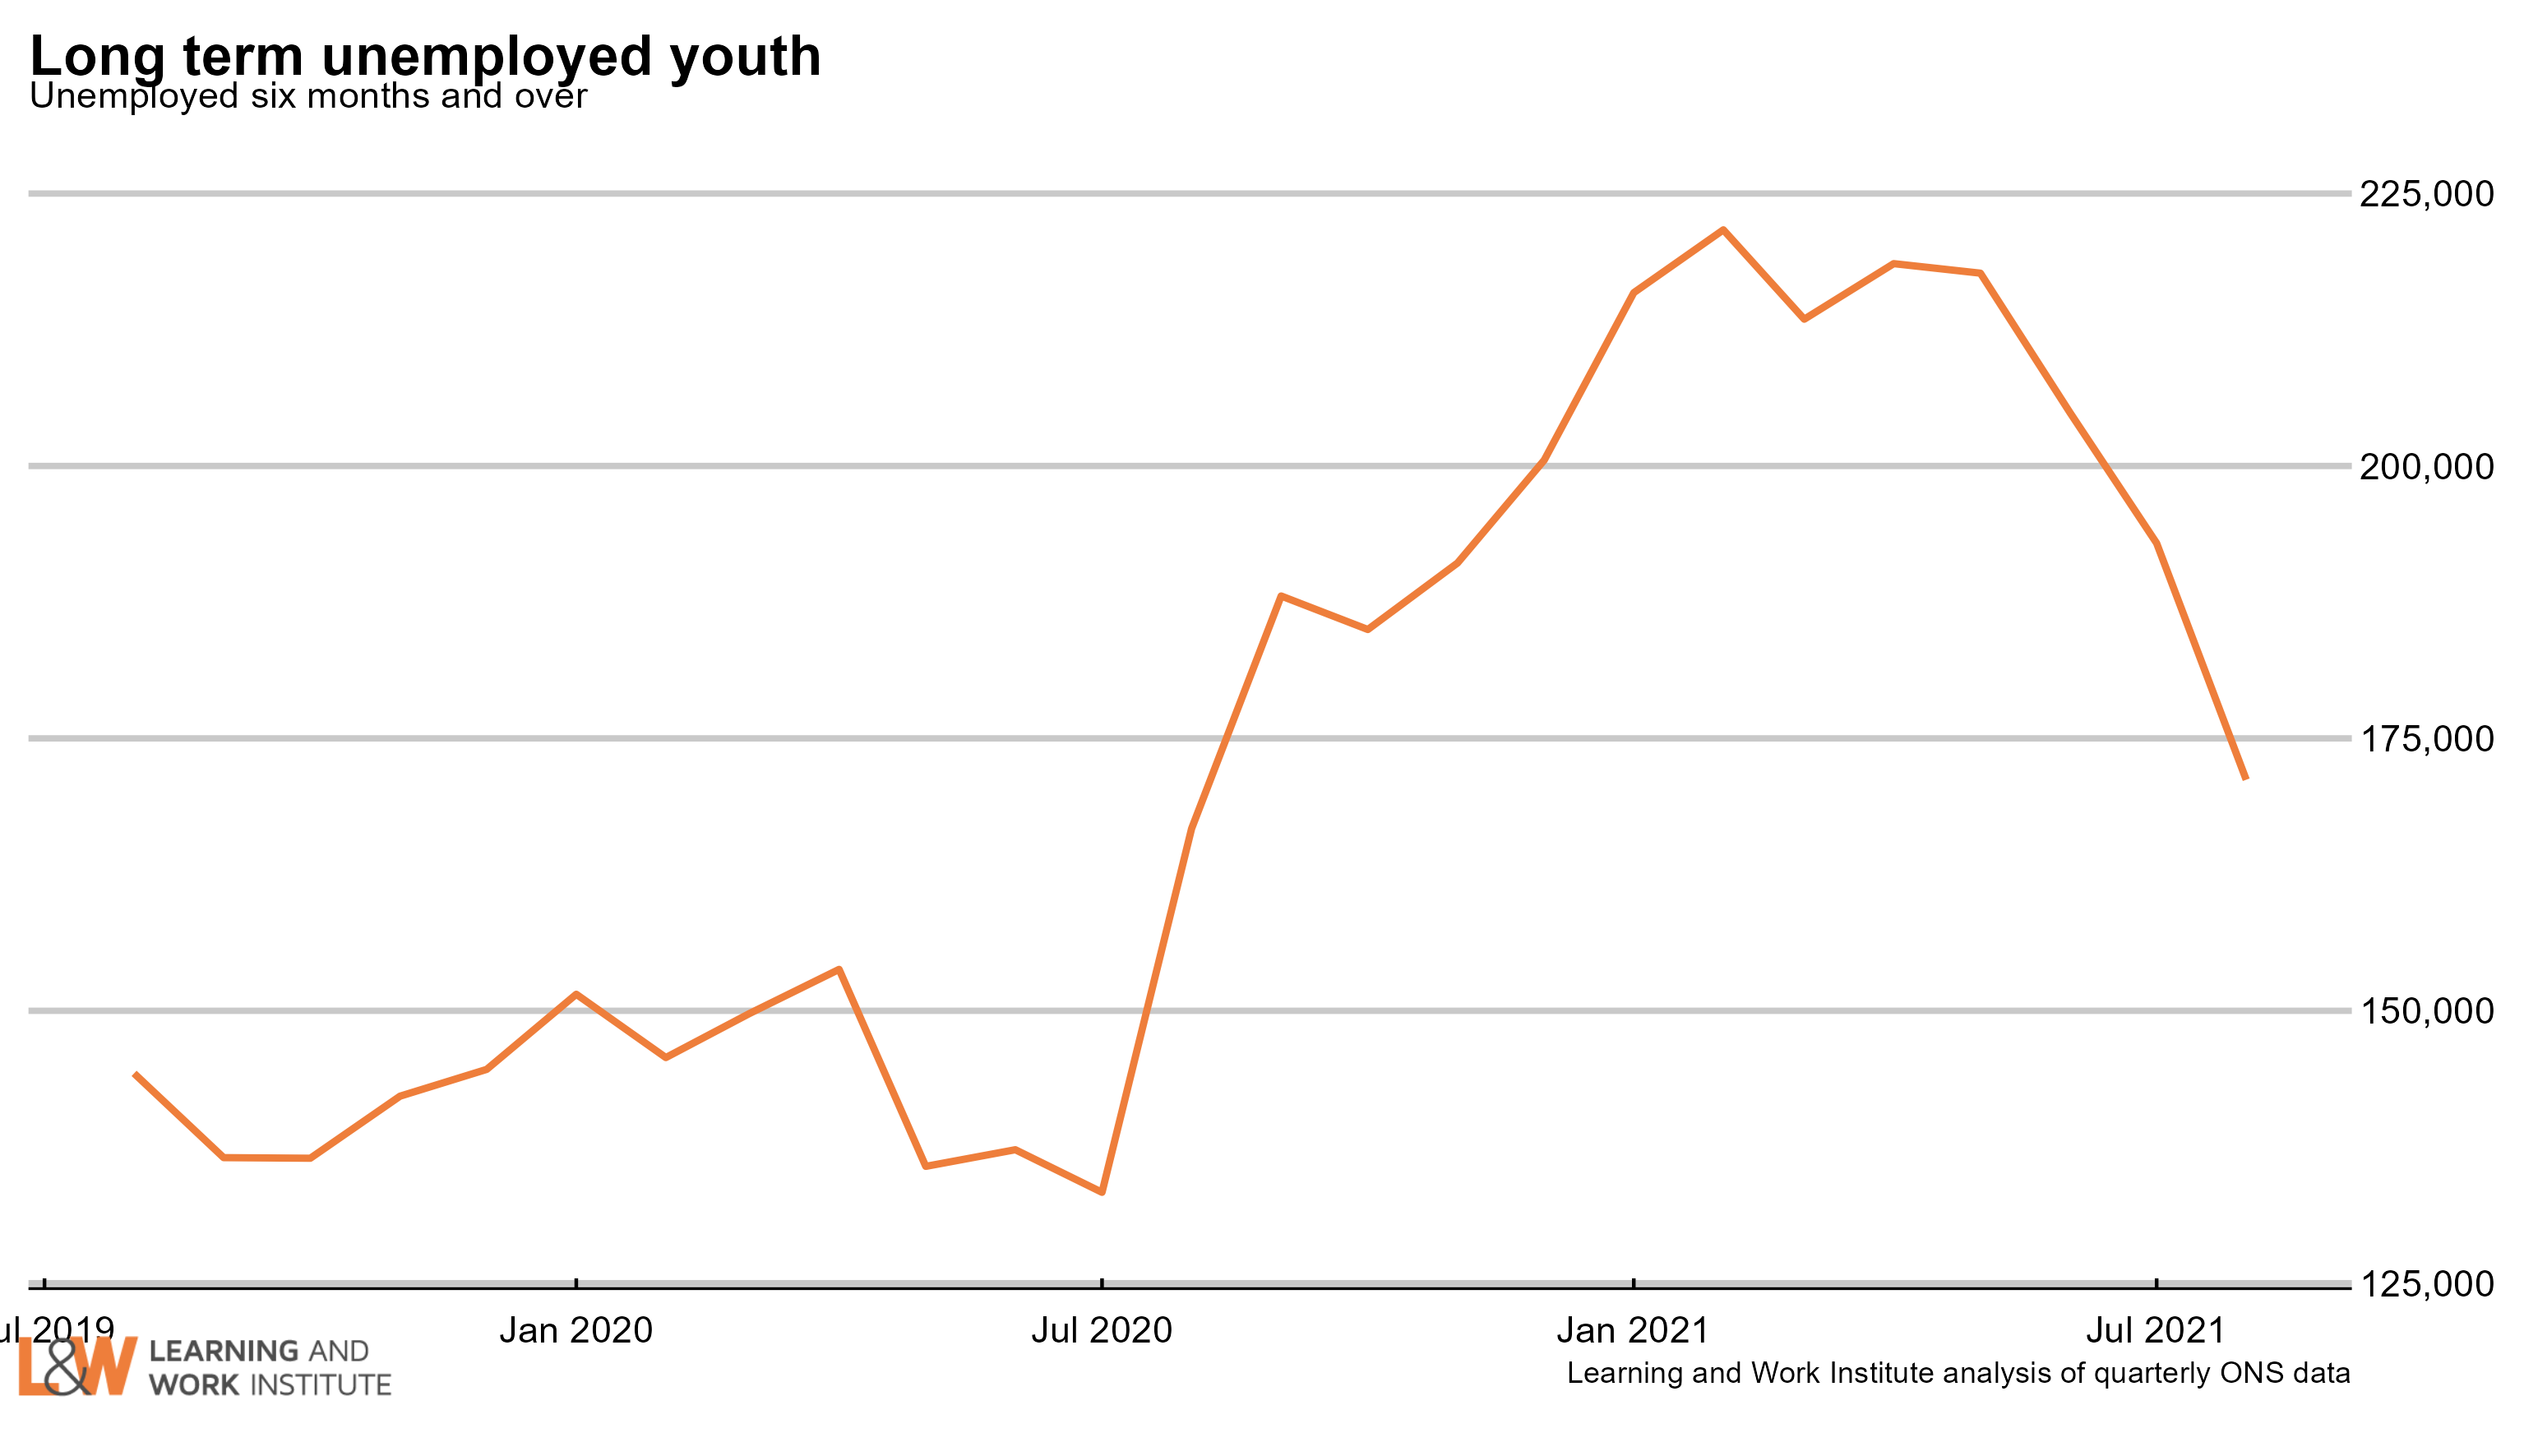
Chart 5: Youth long-term unemployment (six months and over, 16-24)
Youth long-term unemployment (which can include students) fell by 46,000 over the last quarter and is now 171,000.
 |
|
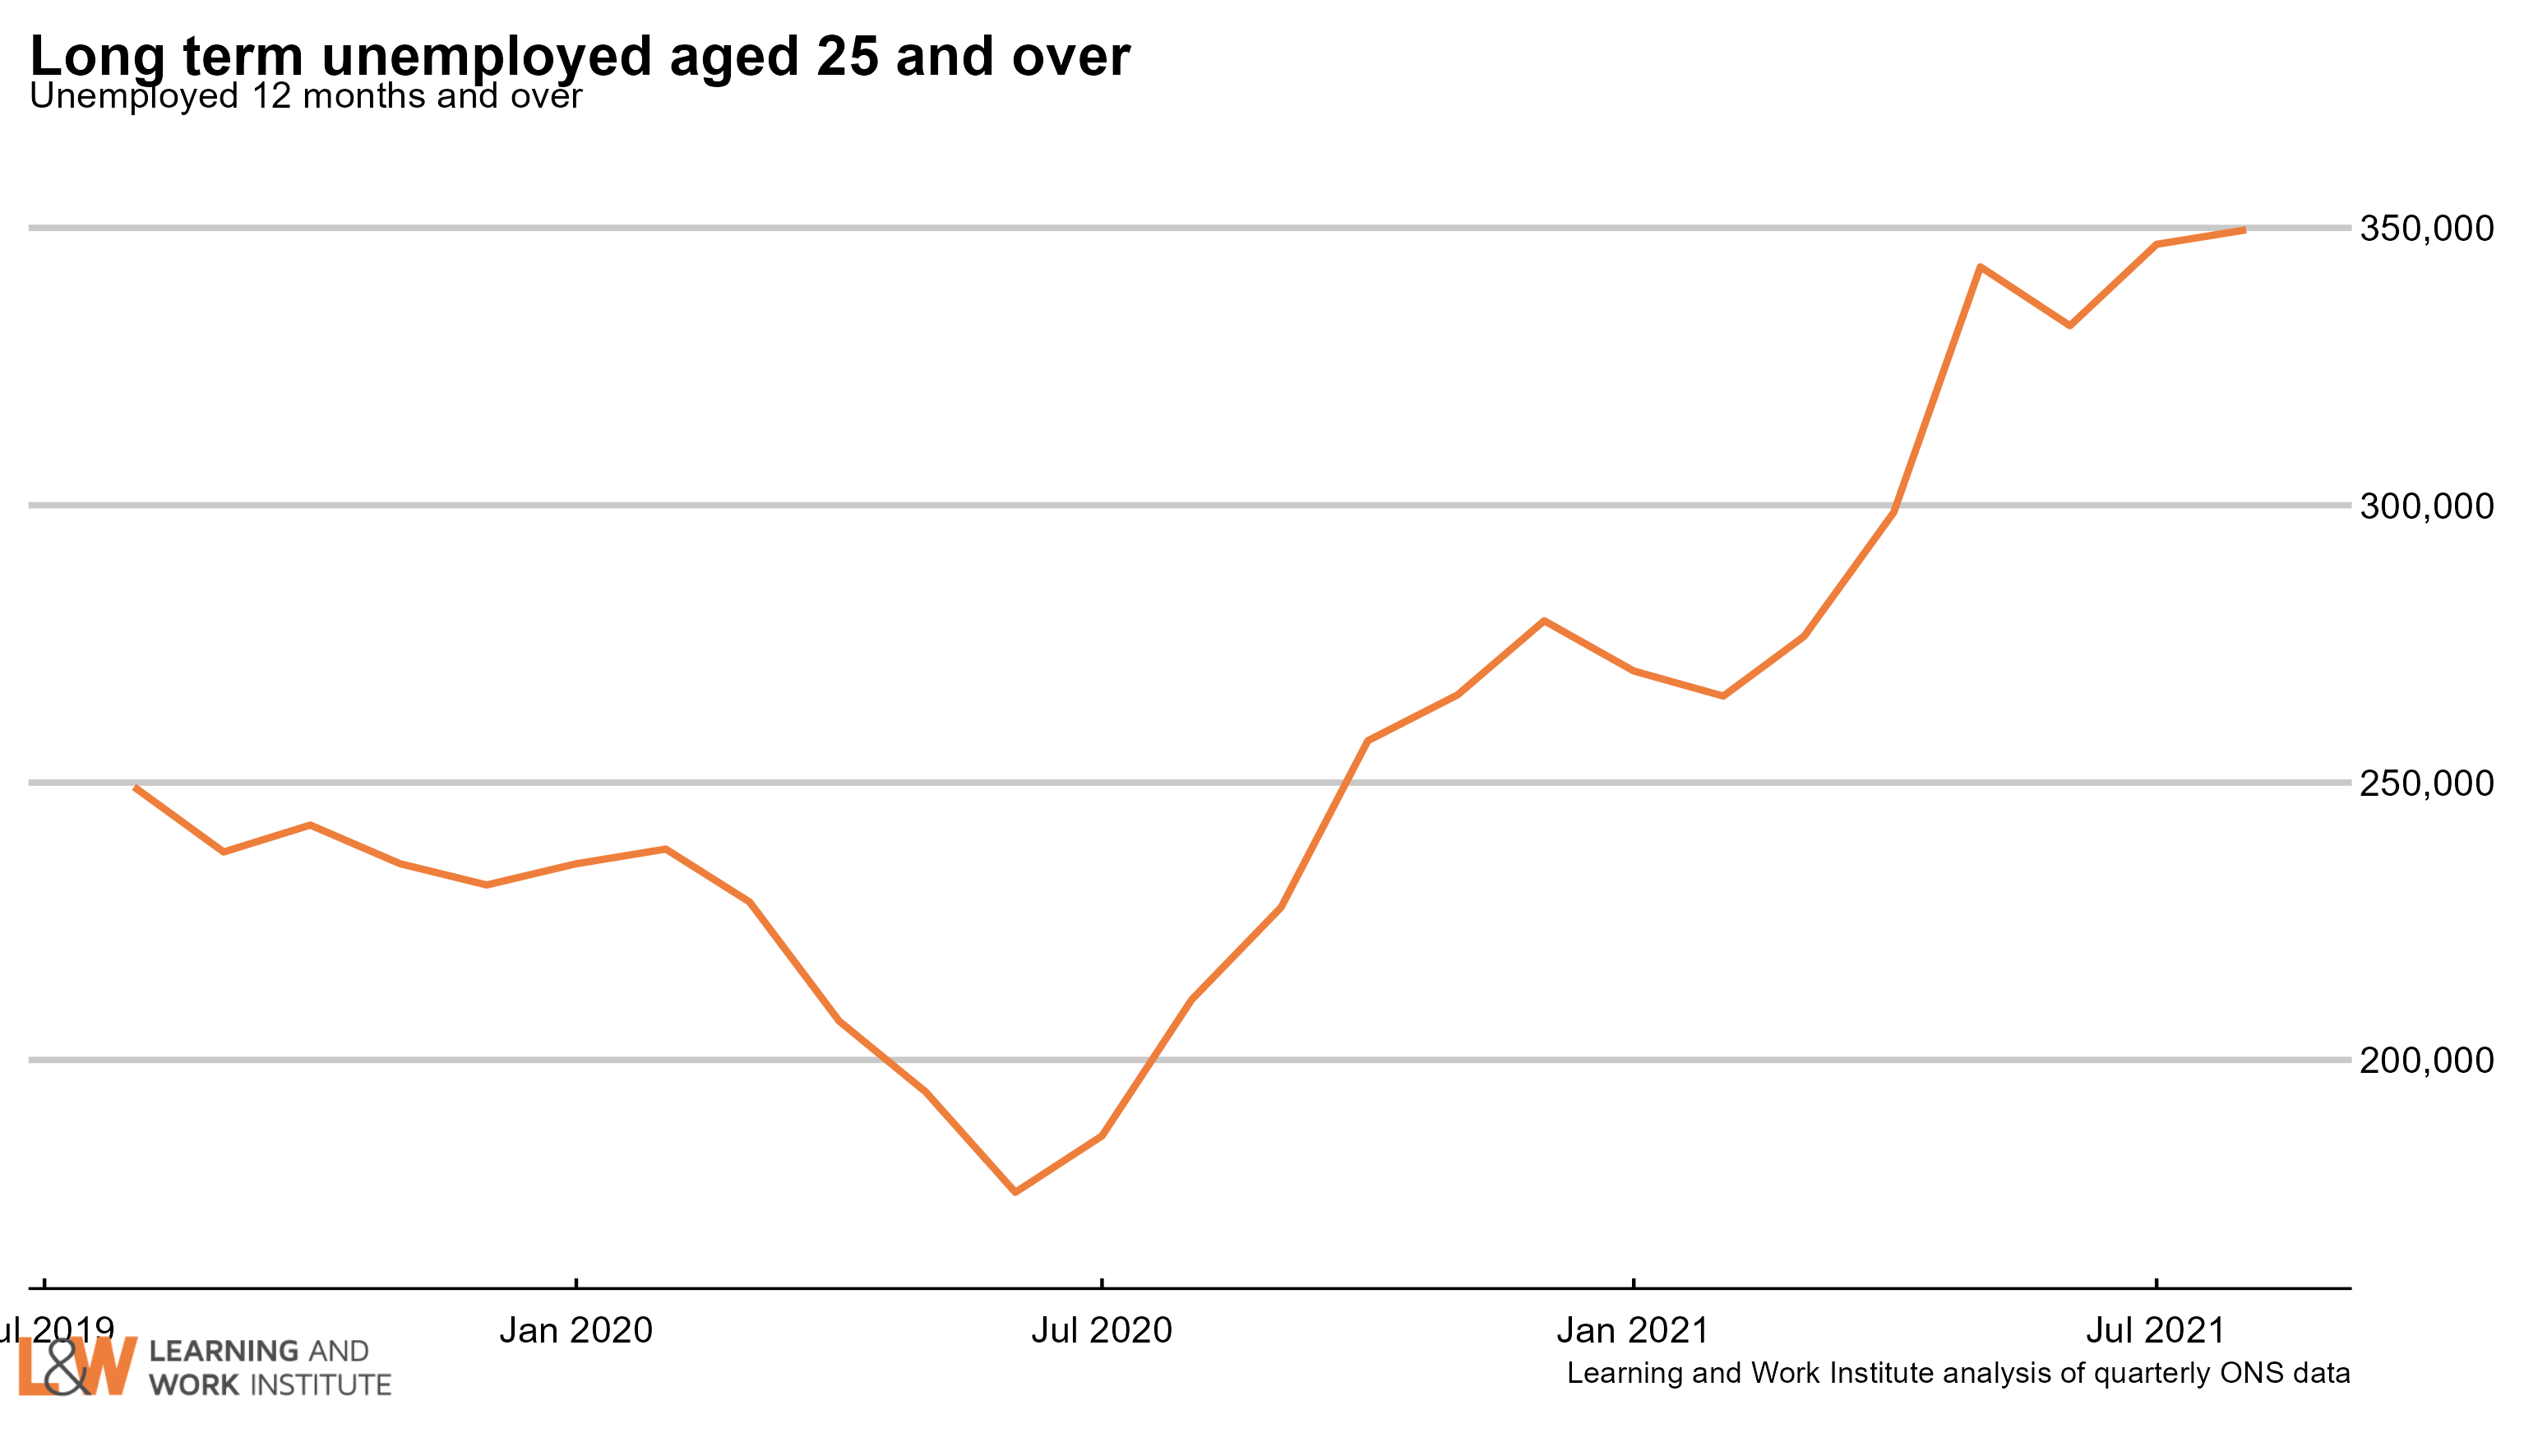
Chart 6: Adult long-term unemployment (12 months and over, 25+)
Adult long-term unemployment on the survey measure is now 350,000. This is the highest level since 2016.
 |
|
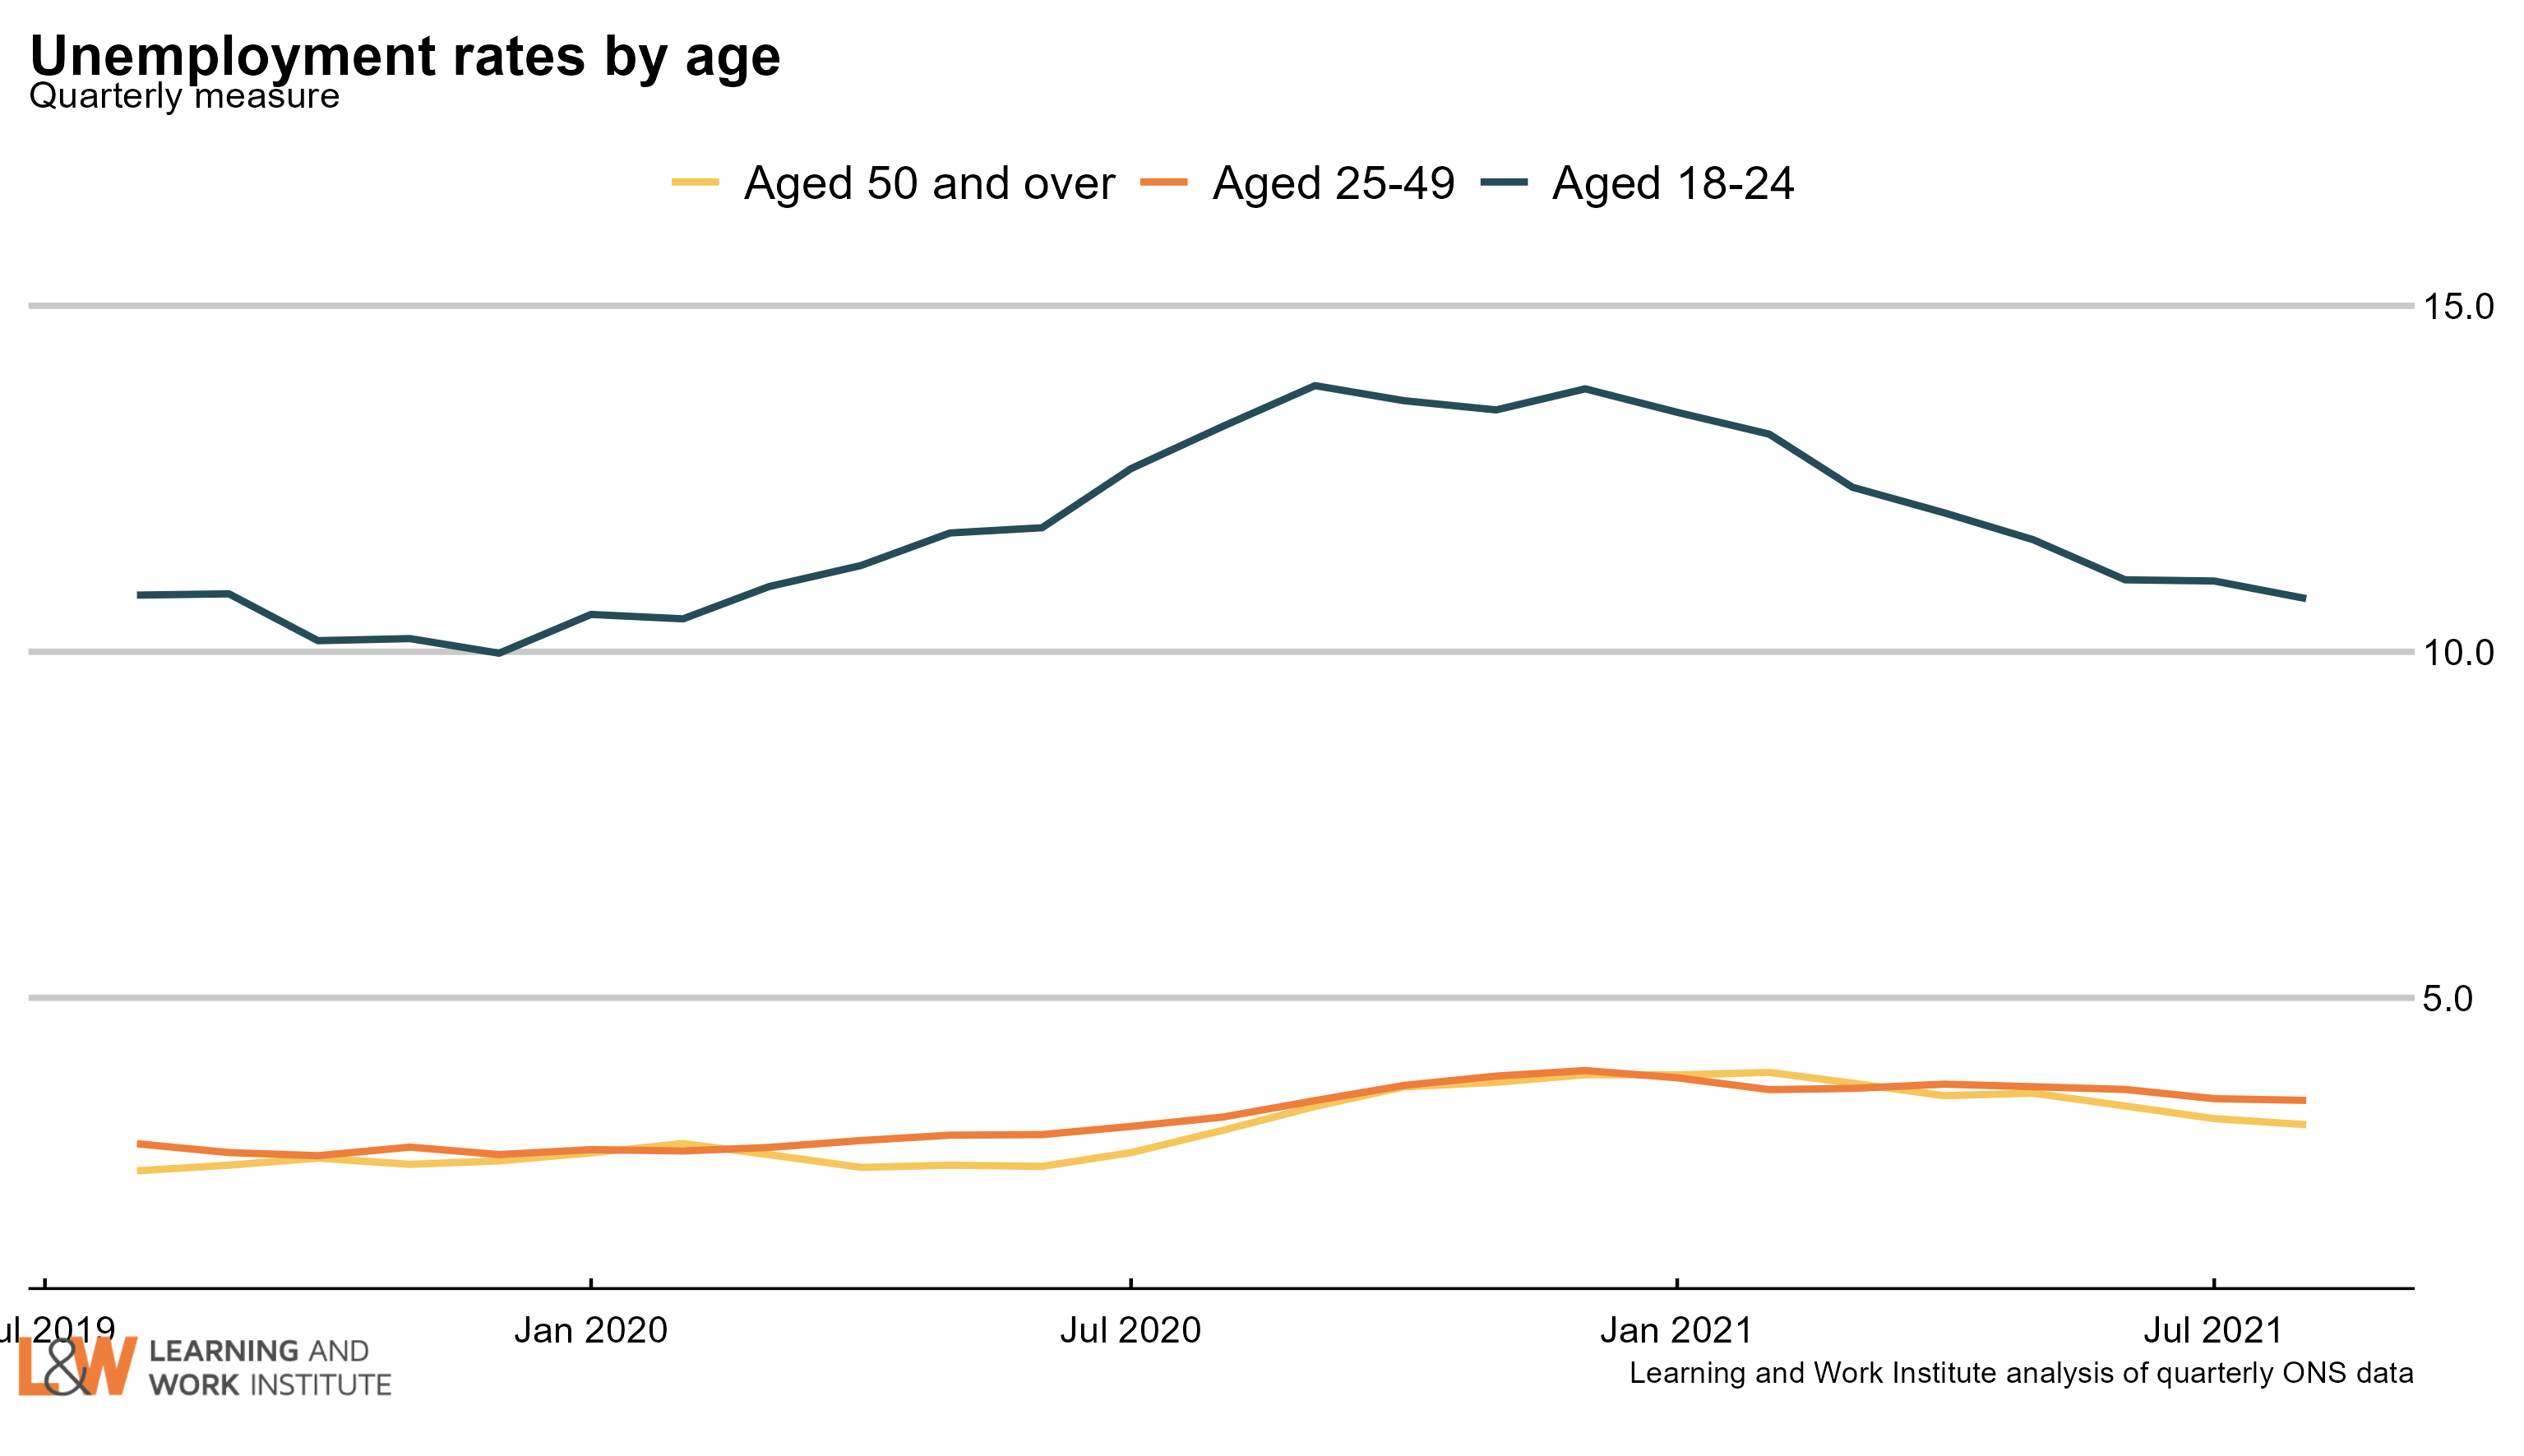
Chart 7: Unemployment rates by age
The 18 to 24 year old unemployment rate (including students) is 10.8% of the economically active population – excluding one million economically inactive students from the calculation. The rate for those aged 25 to 49 is 3.5%. For those aged 50 and over it is 3.2%. The quarterly change is down 0.8 percentage points for 18 to 24 year olds, down 0.2 points for 25 to 49 year olds, and down 0.4 points for the over-50s.
 |
|
Chart 8: Unemployment rate changes by age (counting February 2020 as 100)
The 18 to 24 year old unemployment rate (including students) is 0.3 percentage points higher than in February 2020. The change for those aged 25 to 34 is up 0.8 points. The change for those aged 35 to 49 is up 0.7 points. The change for those aged 50 to 64 is up 0.3 points. The change for those aged over 65 is down 0.1 points.
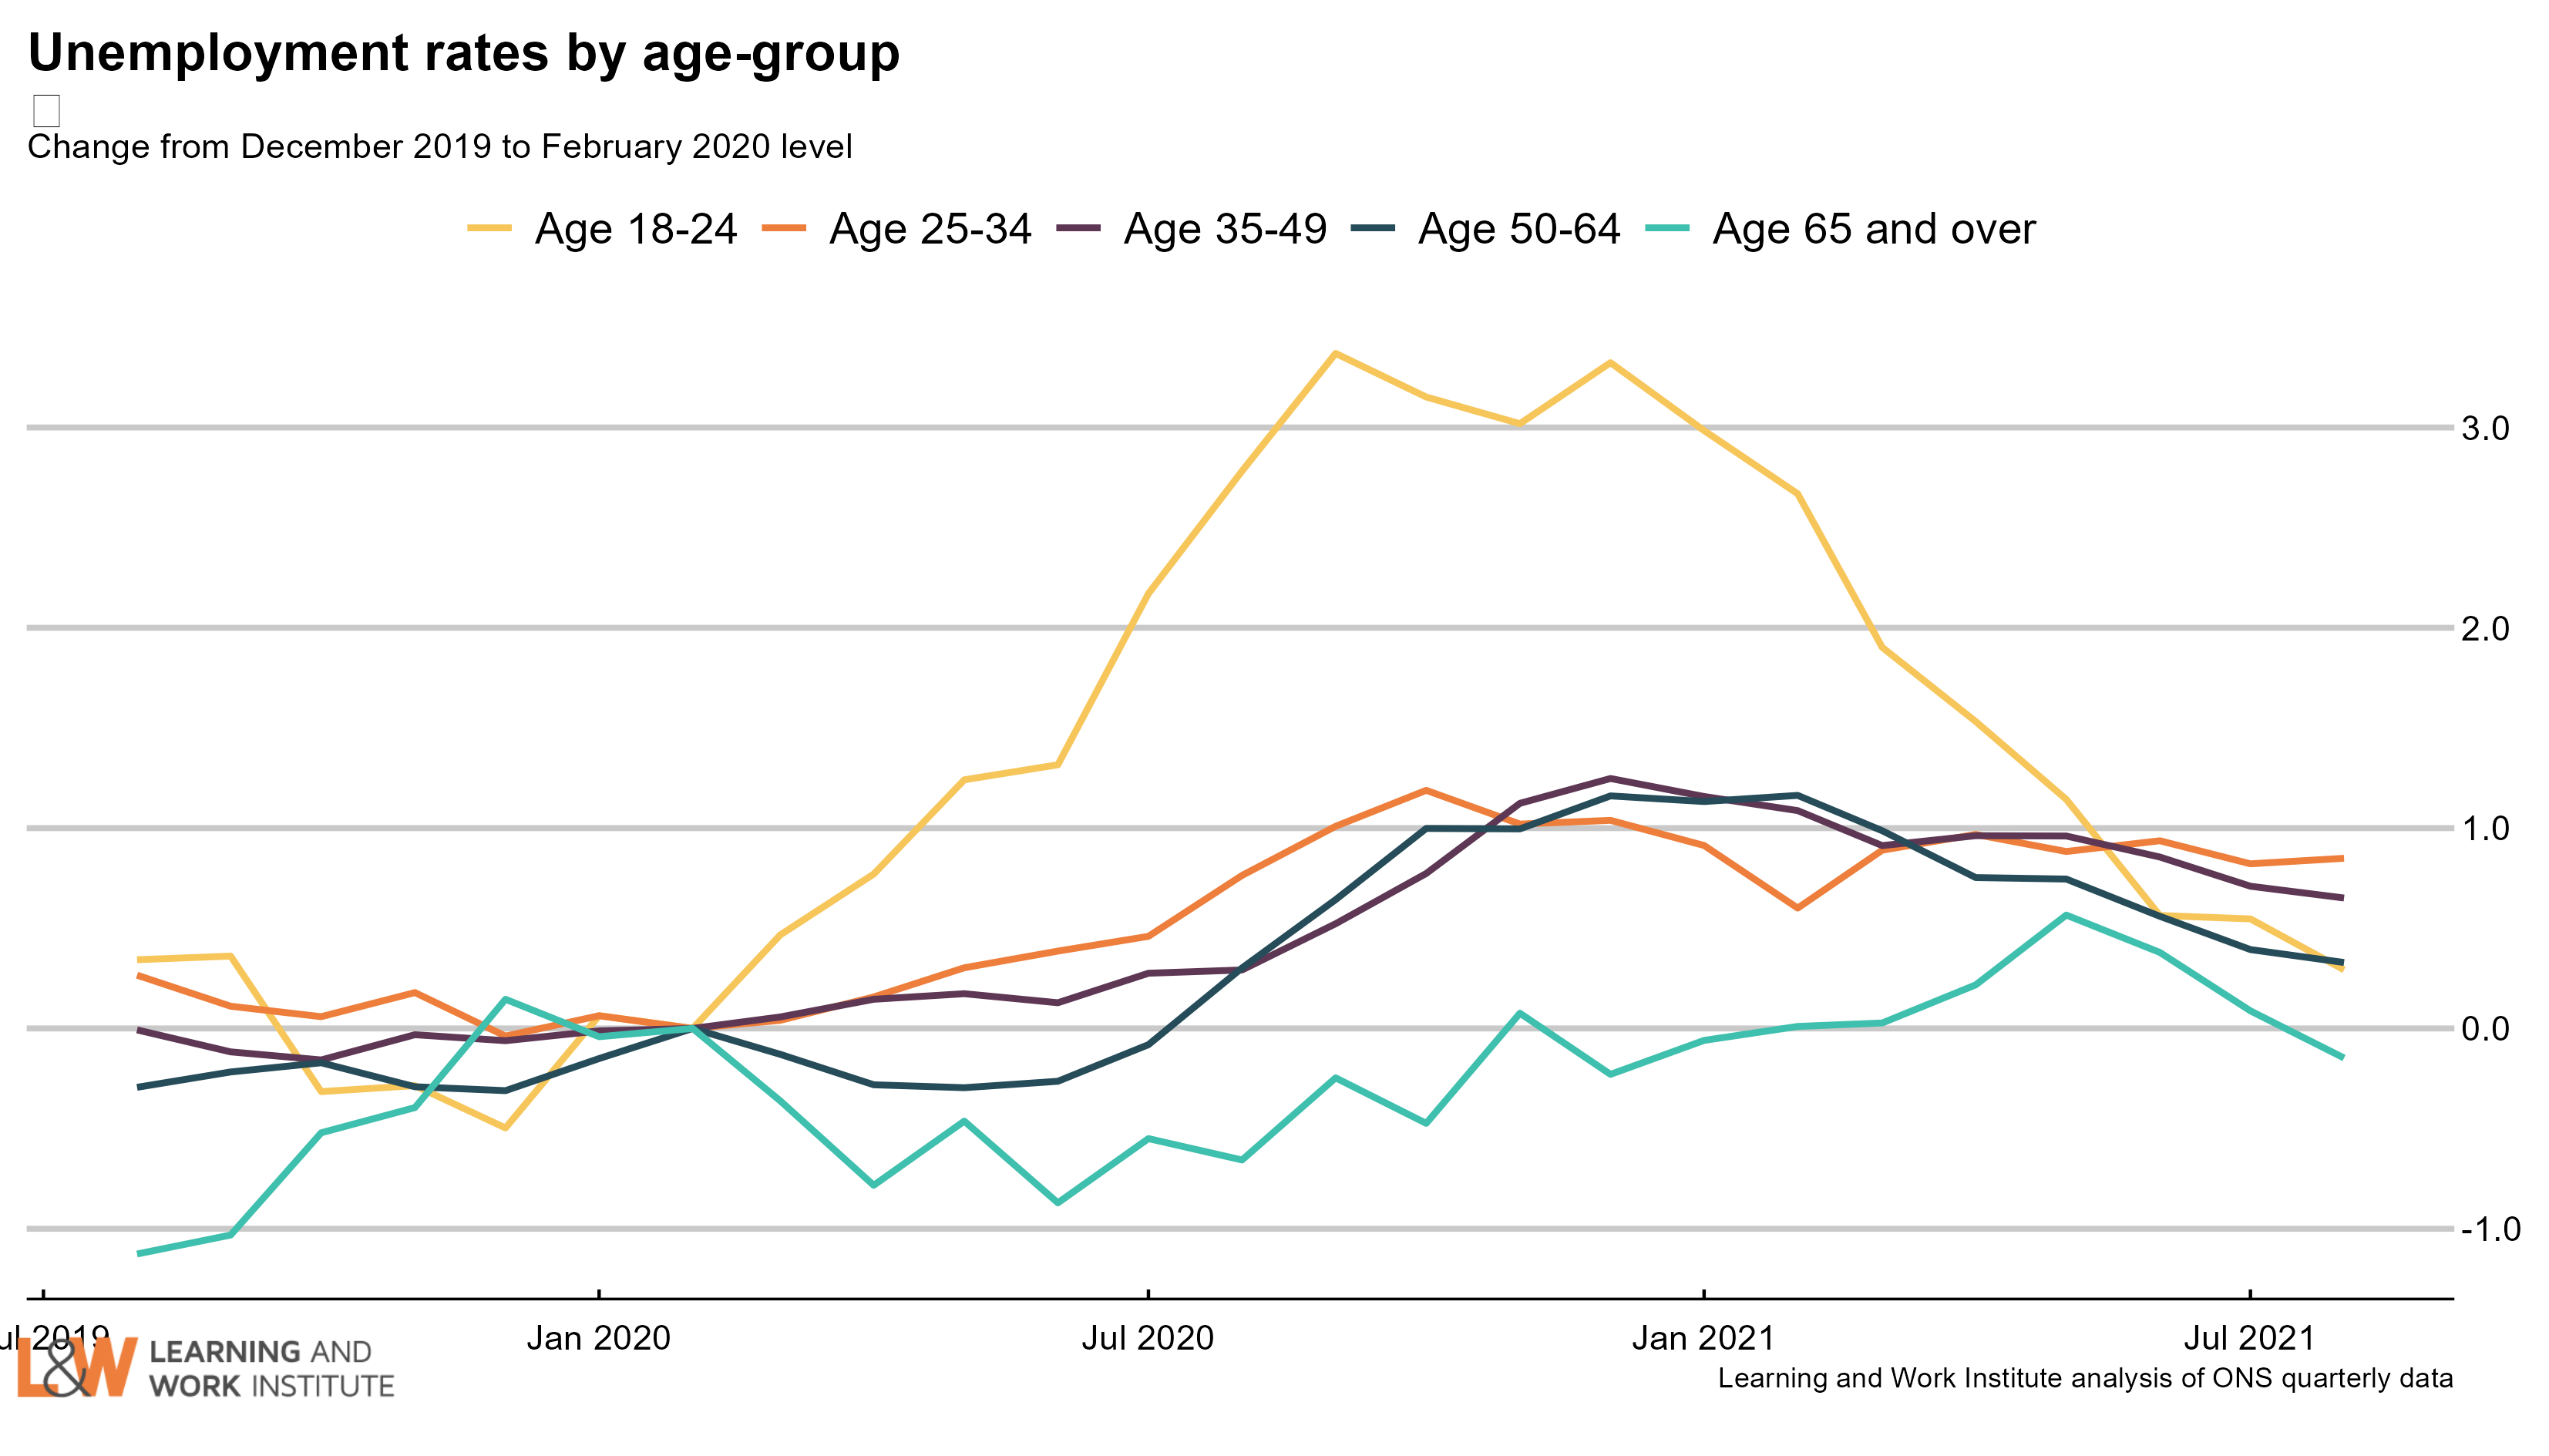
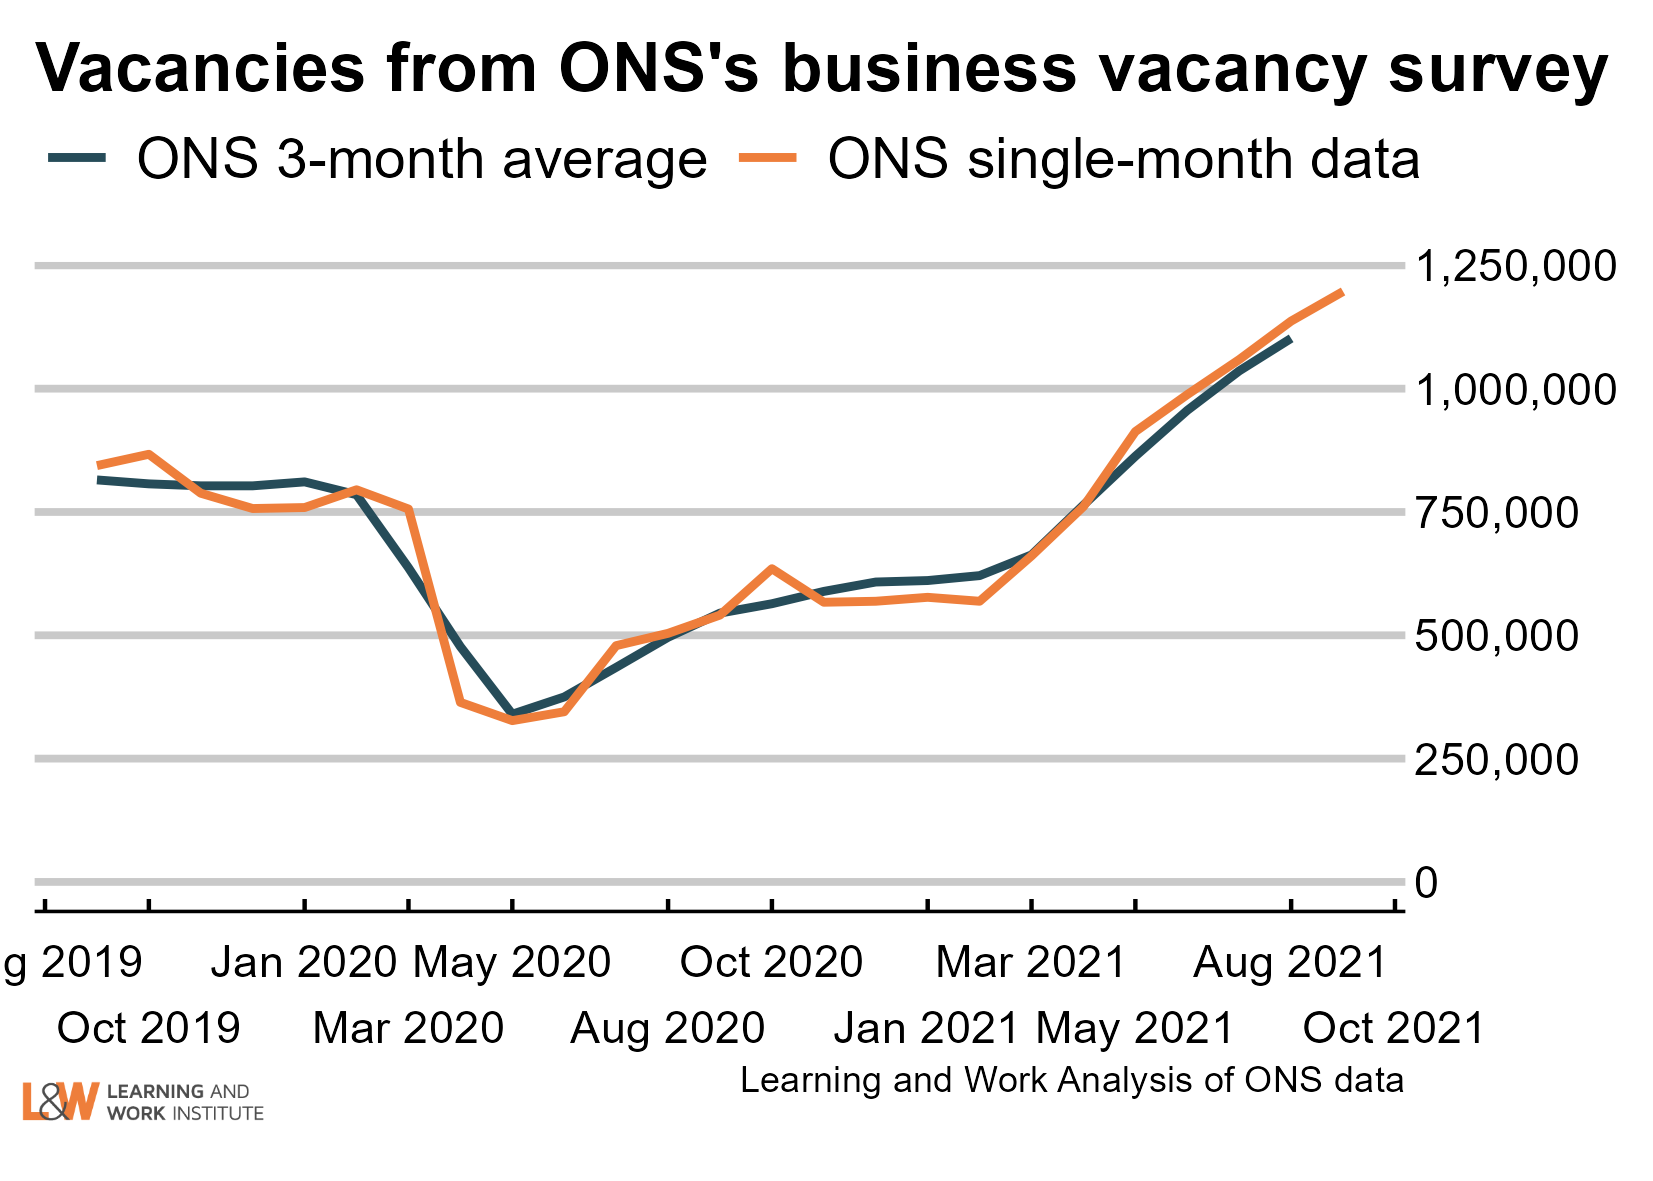
Chart 9: Vacancies – whole economy survey
Headline vacancies this month is up by 66,000 to 1,102,000. The ONS' experimental single-month vacancy figures increased by 209,000 In the last quarter to 1,197,000, showing continuing rises. The headline ONS vacancy figure is both seasonally adjusted and a three-month average. The chart shows both series.
 |
|
Chart 10: Experimental single month vacancies – whole economy survey
The Office for National Statistics' experimental single month vacancy estimates include sectoral information. Here, we show the changes on the same month two years ago, before the pandemic. The data is not seasonally adjusted, so comparisons with the same month each year are better. The numbers are thousands of vacancies, under each number, and on the right, the change in thousands of vacancies. 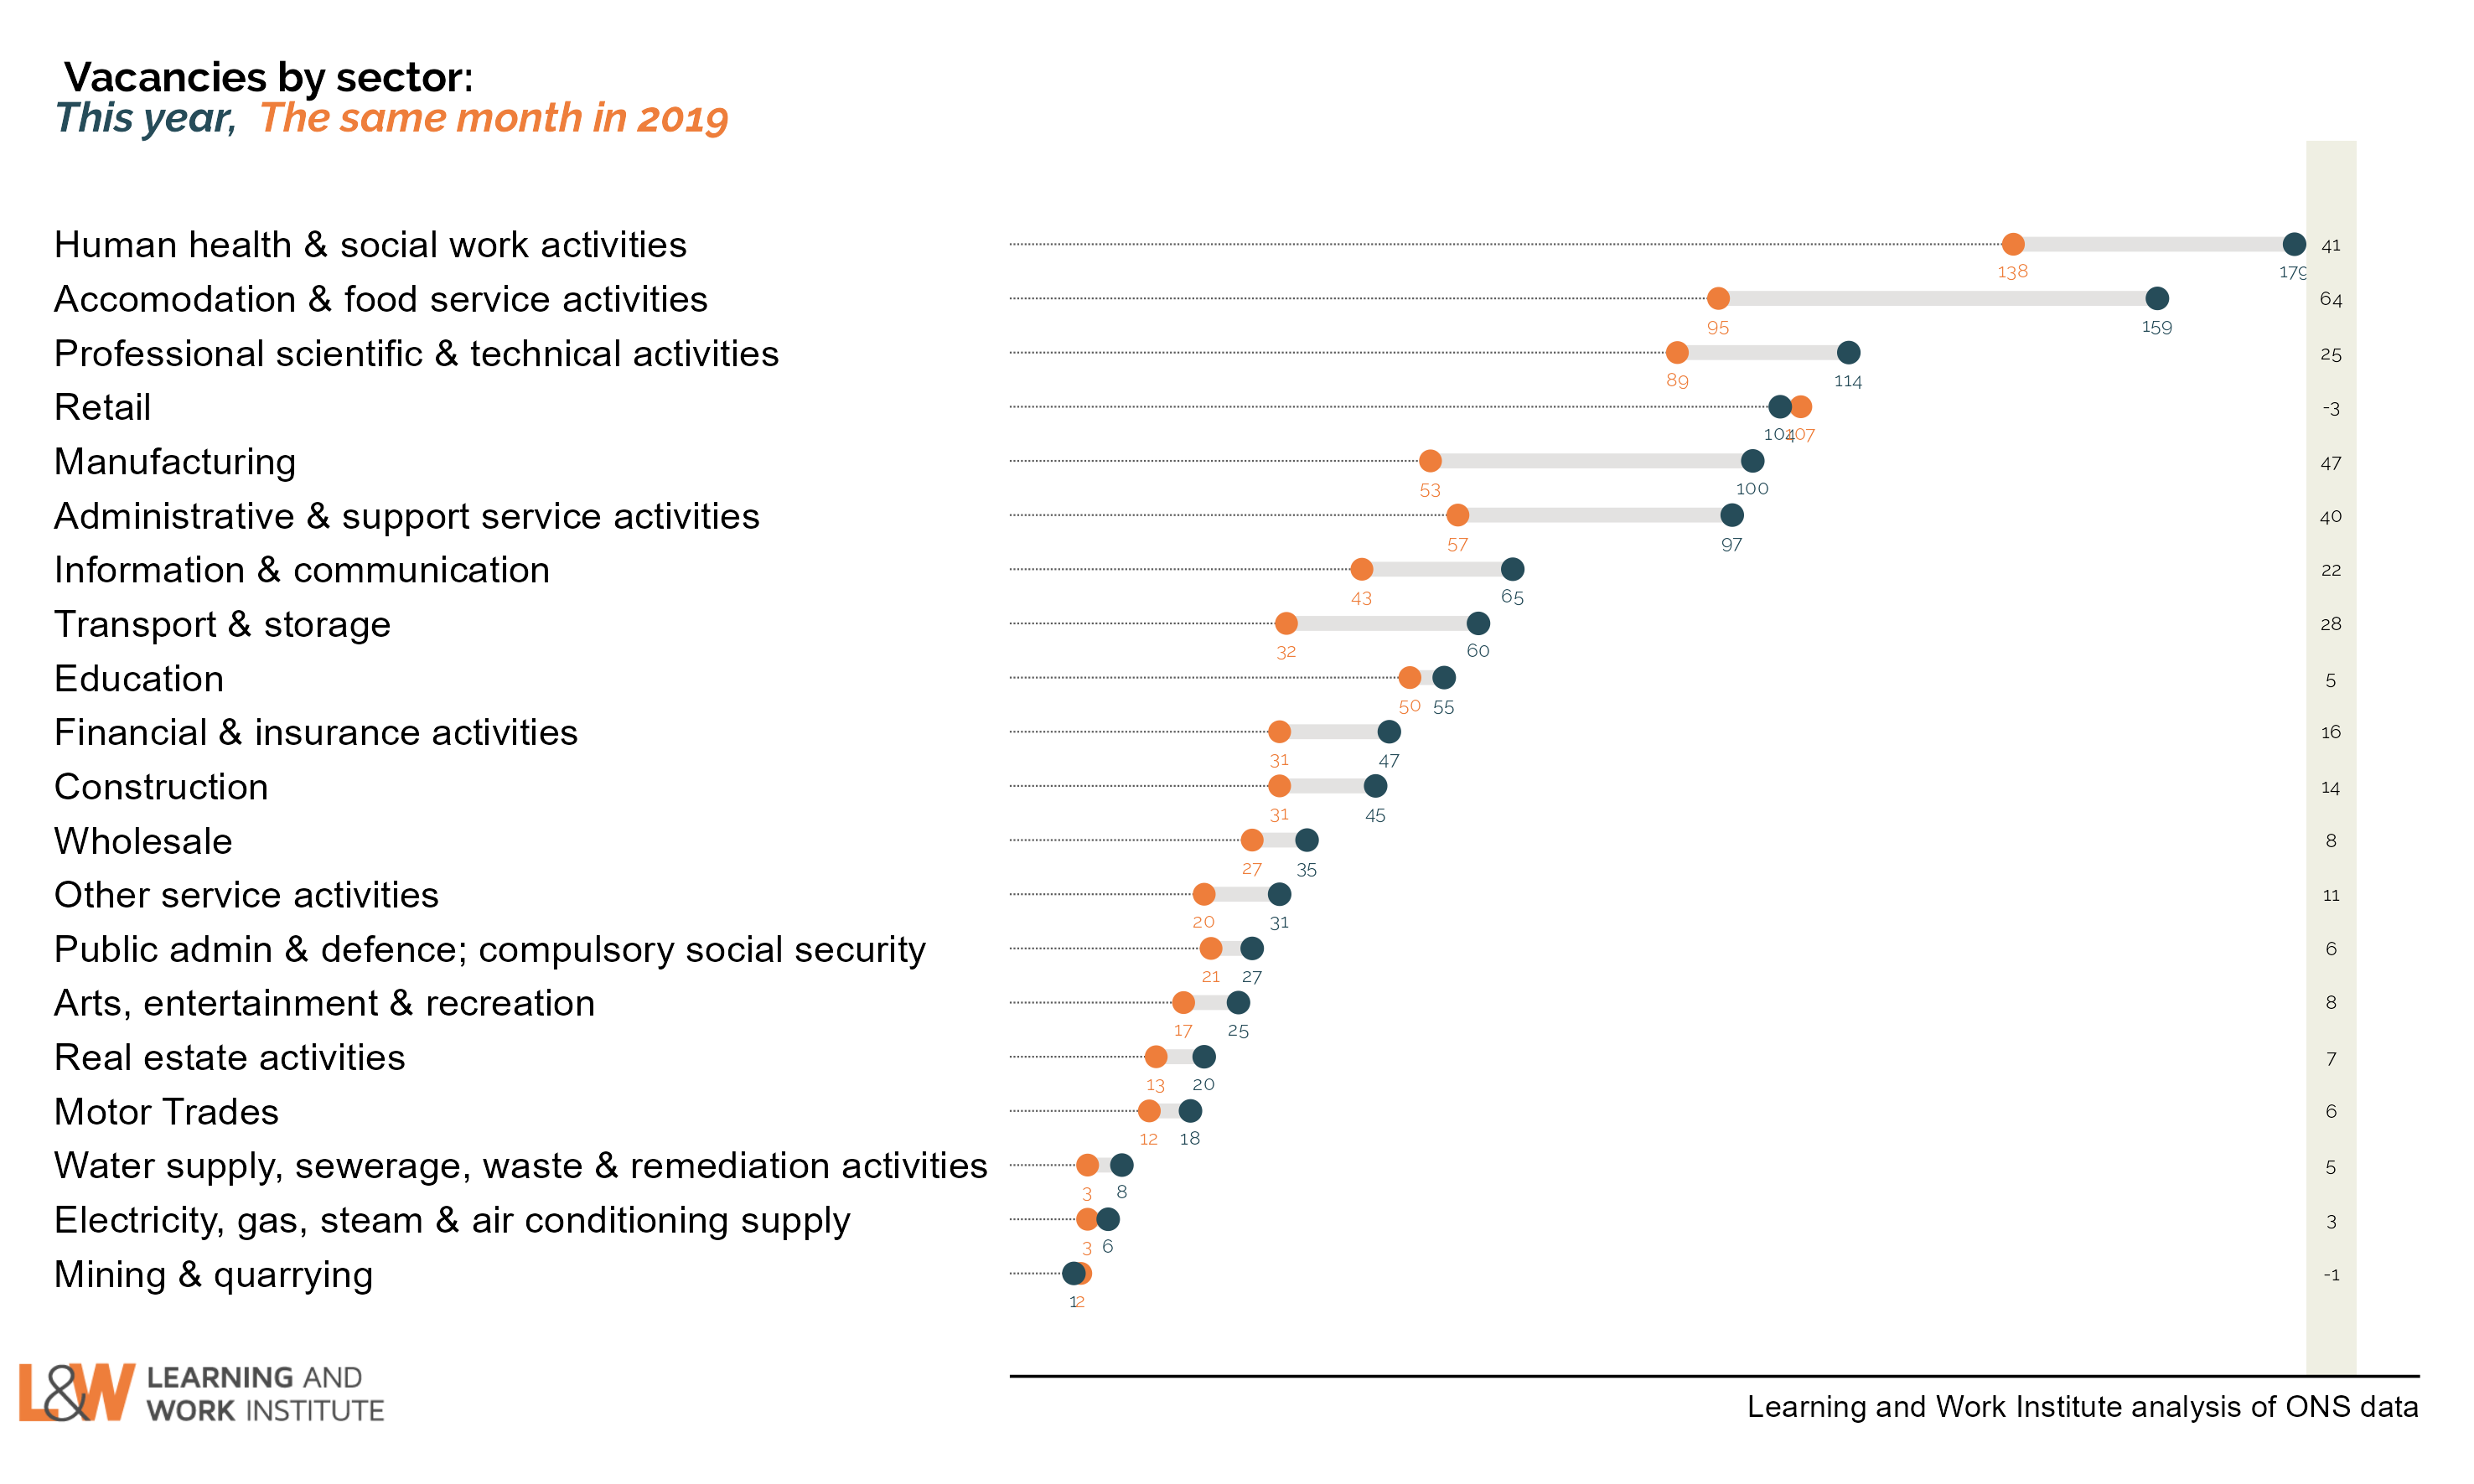 |
|
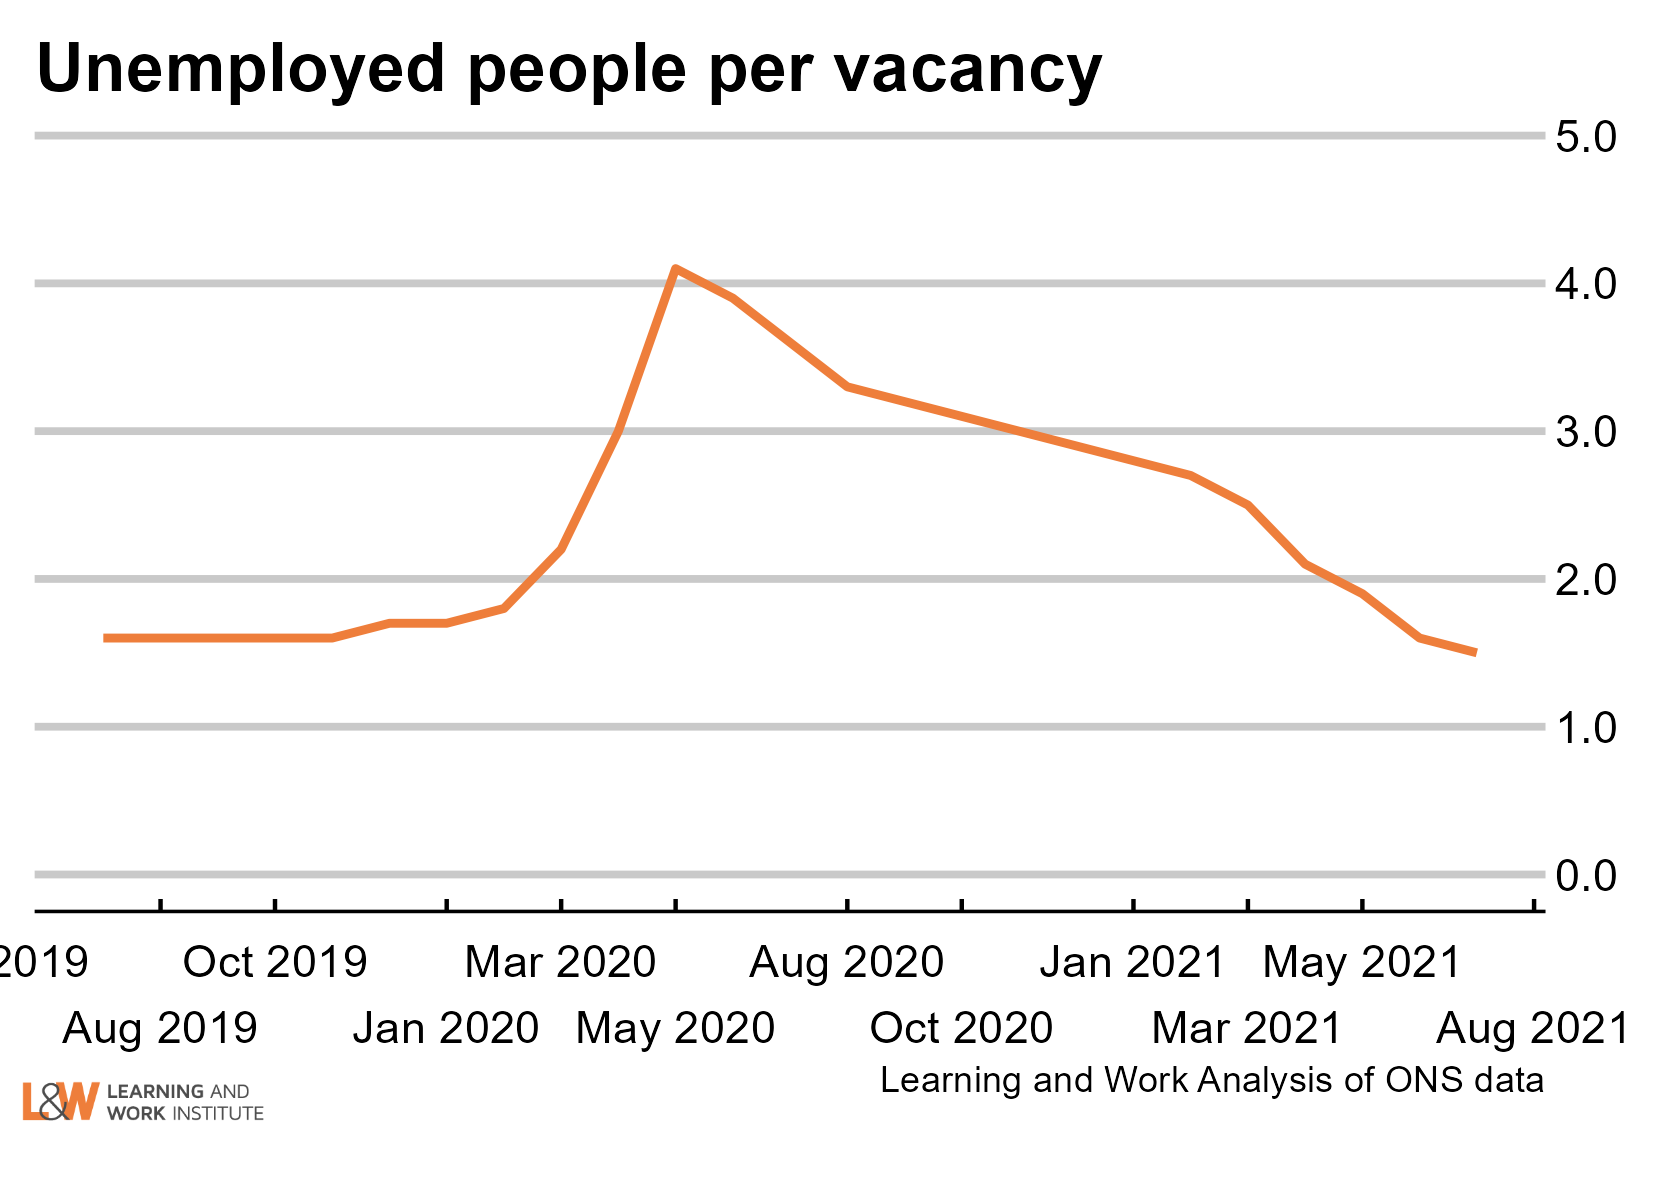
Chart 11: Unemployed people per vacancy
There are 1.5 unemployed people per vacancy. This is the same as in March to May 2019 and the joint lowest since the series started in 2001.
 |
|
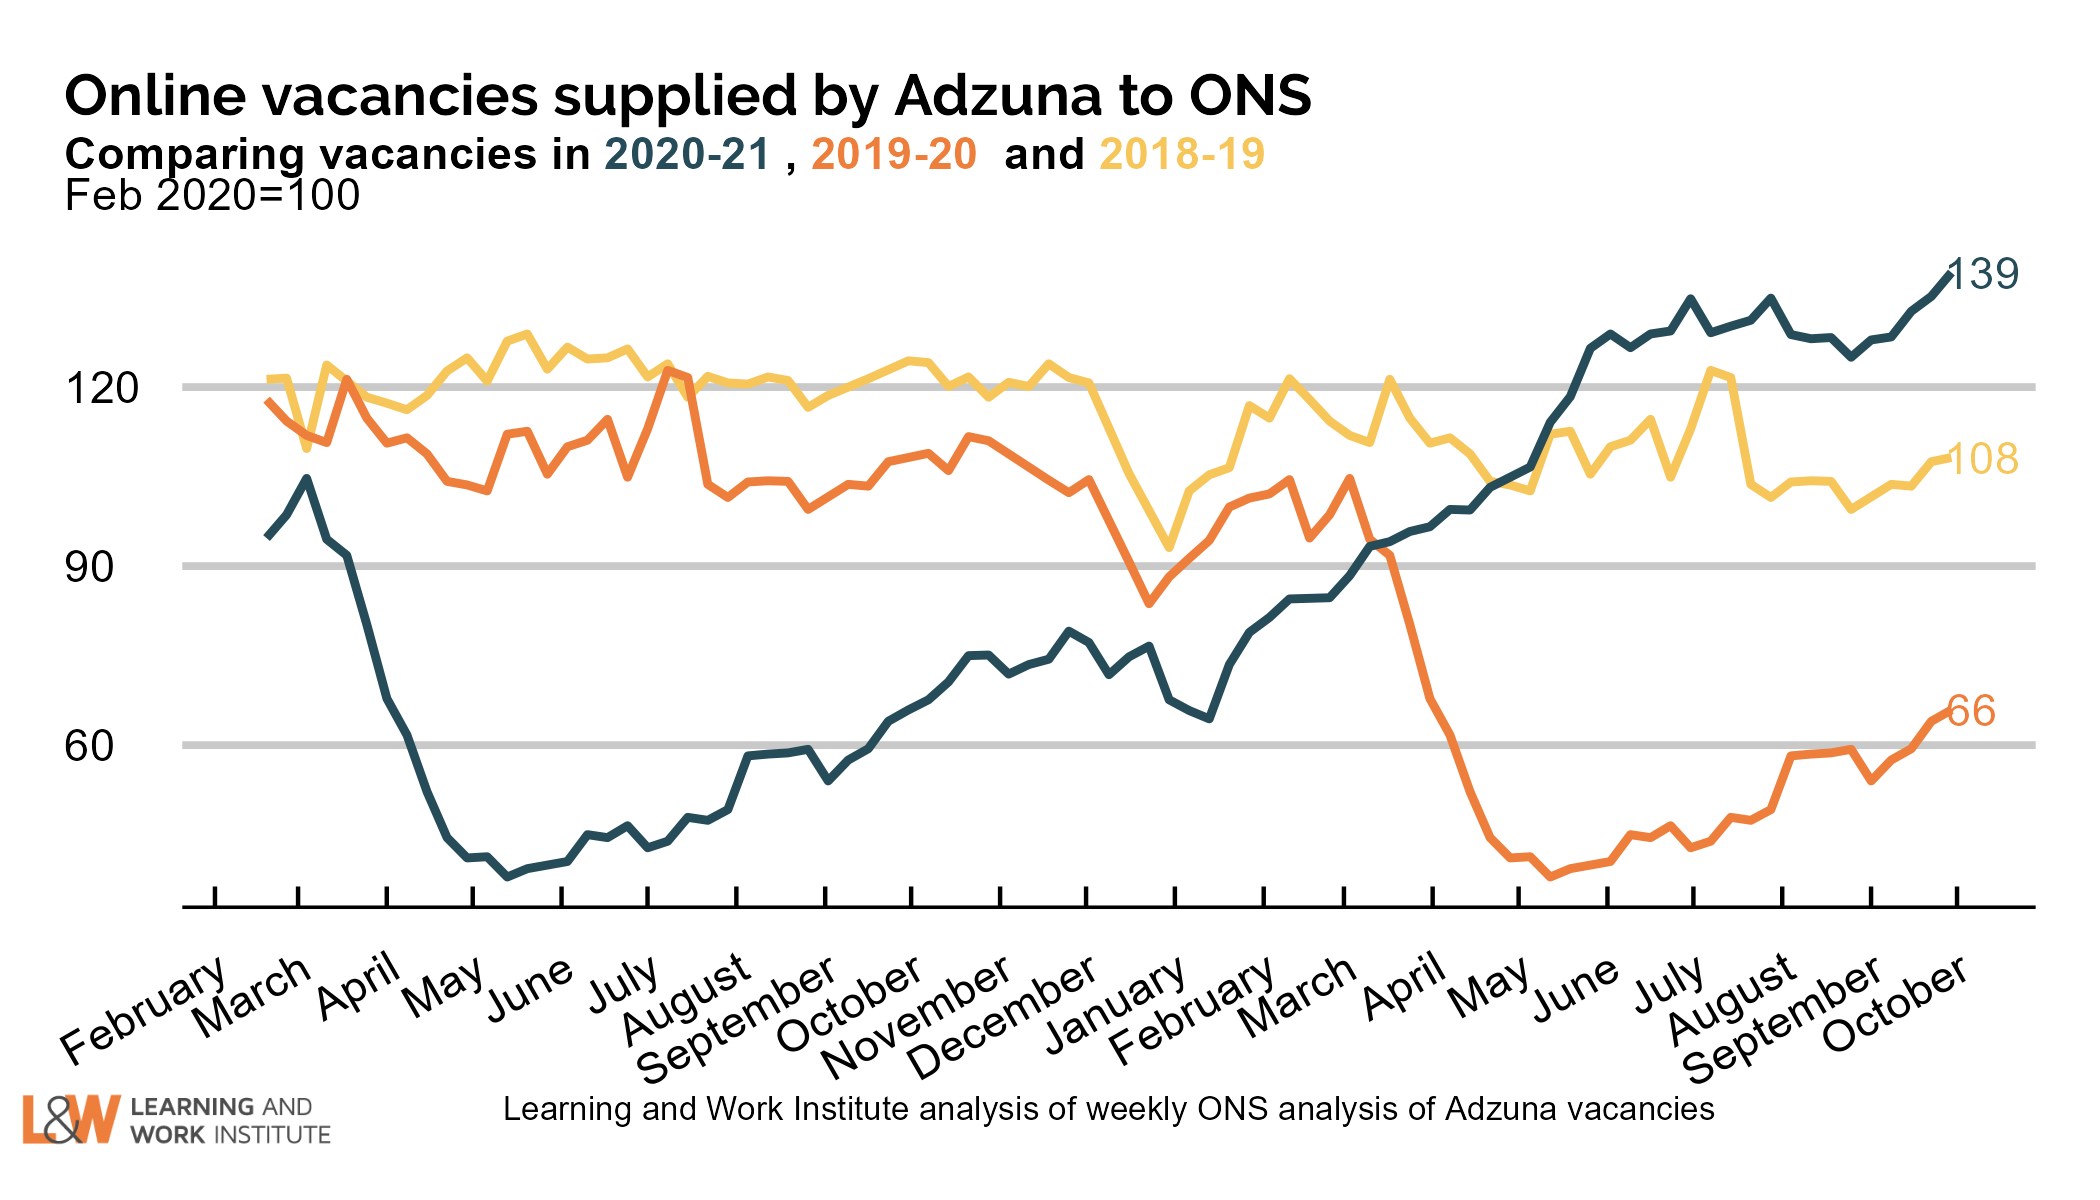
Chart 12: Online vacancies to early March from Adzuna
Job vacancies dropped to below half of the 2019 average following lockdown. Overall online vacancies are up to 139% of the Feb 2020 level. They are at their highest since this series started in 2018. Compared with the same week in 2018, the overall vacancy level is up 13%.
 |
|
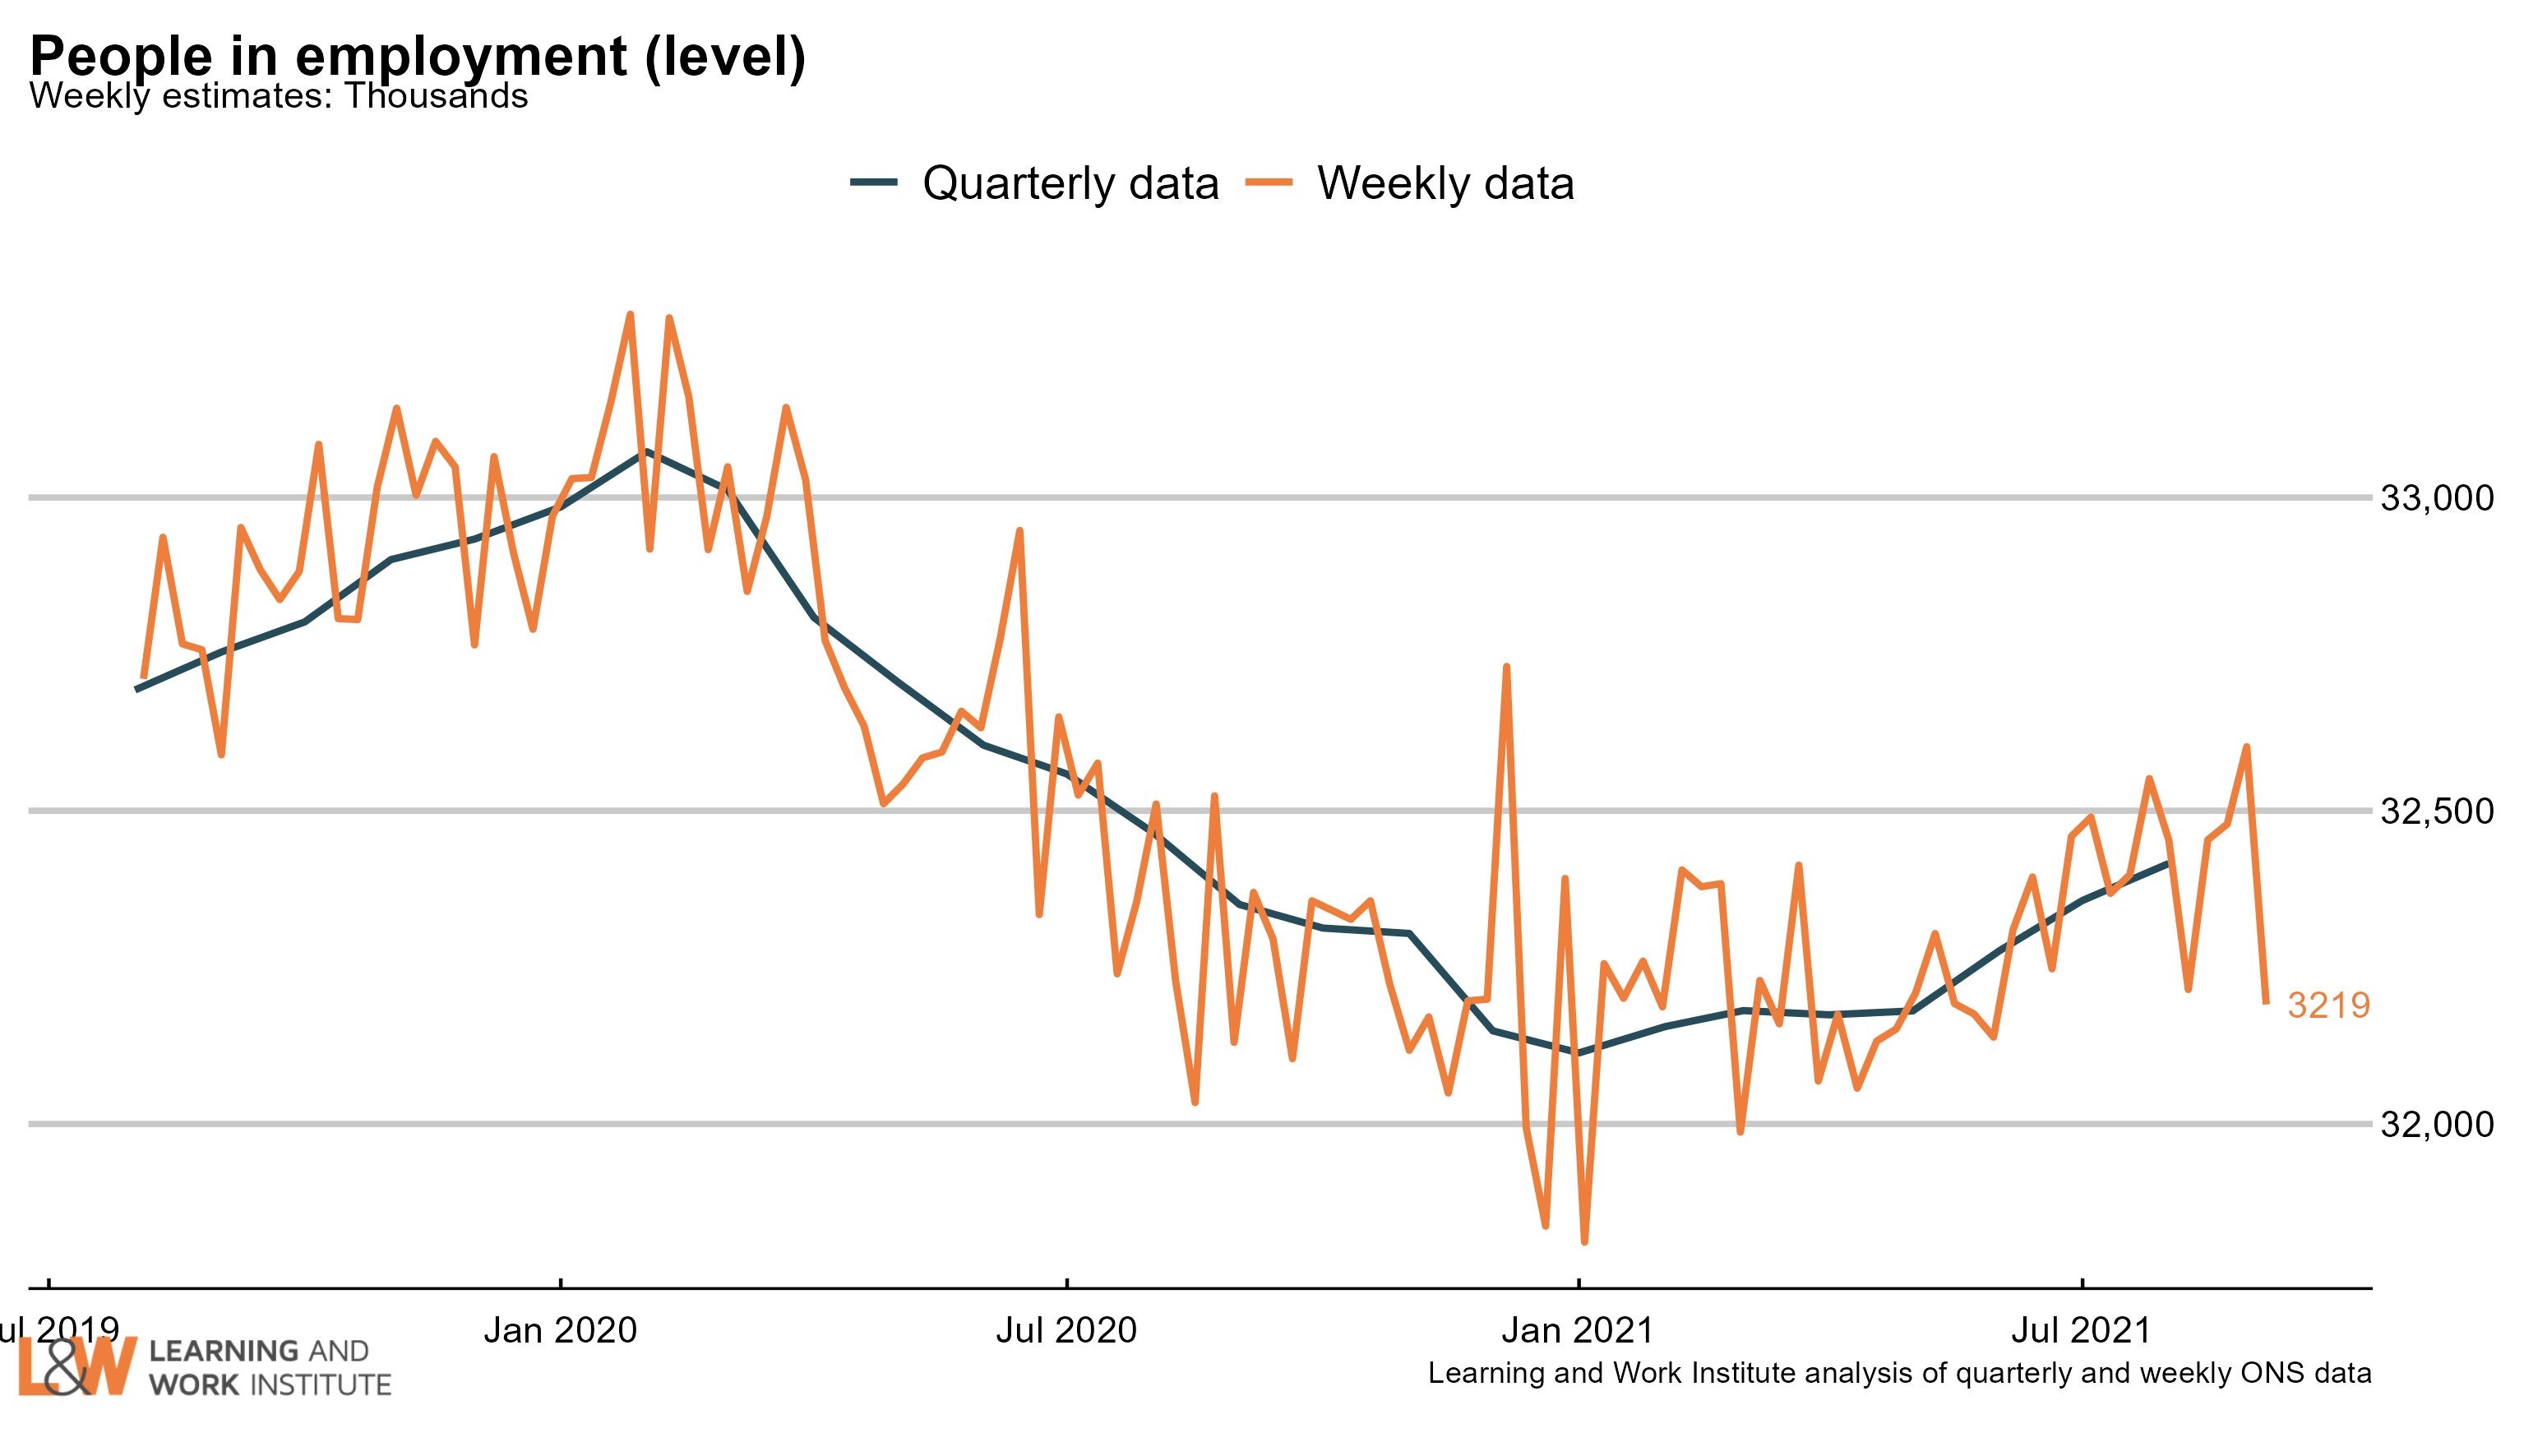
Chart 13: UK employment
Employment has risen by 59,000 on the figure published last month, to 32,416,000. The chart shows both the official figures and the experimental weekly figures. The trend is likely to be flatter than recently.
 |
|
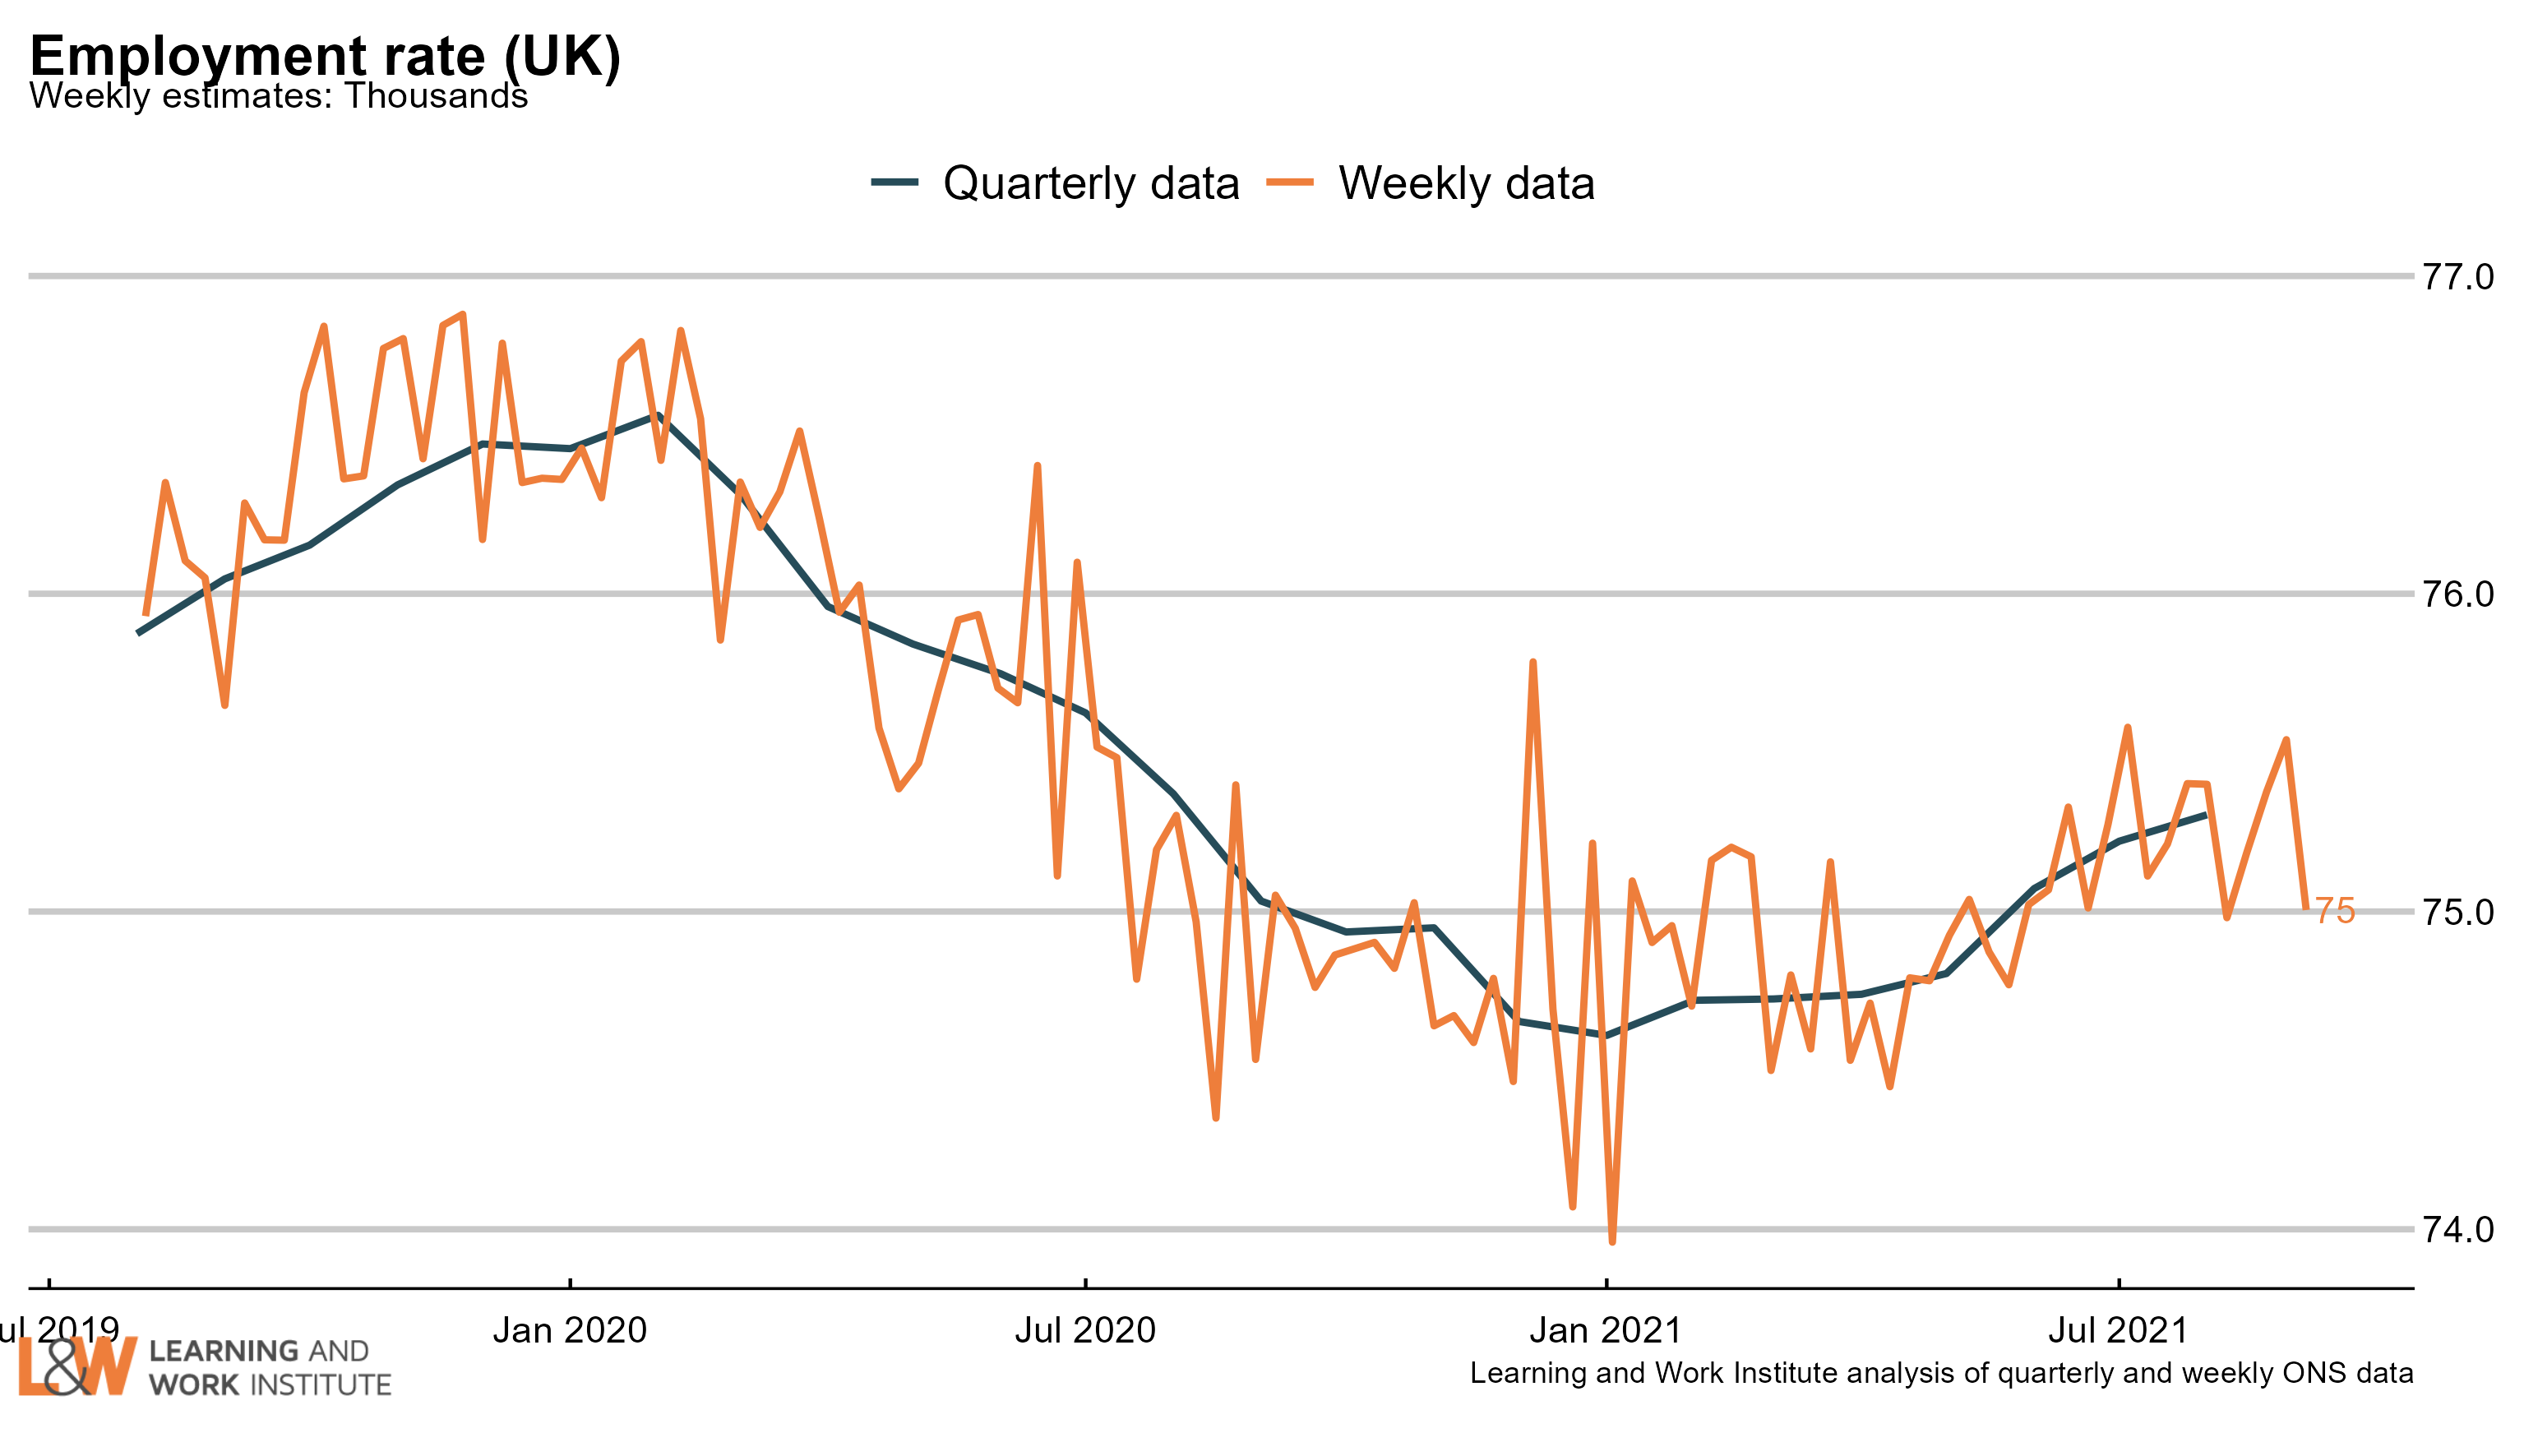
Chart 14: Employment rate in the UK
The employment rate rose by 0.5 percentage points over the quarter, to 75.3%. The chart shows both the official figures and the experimental weekly figures. The trend is also likely to be flatter than recently.
 |
|
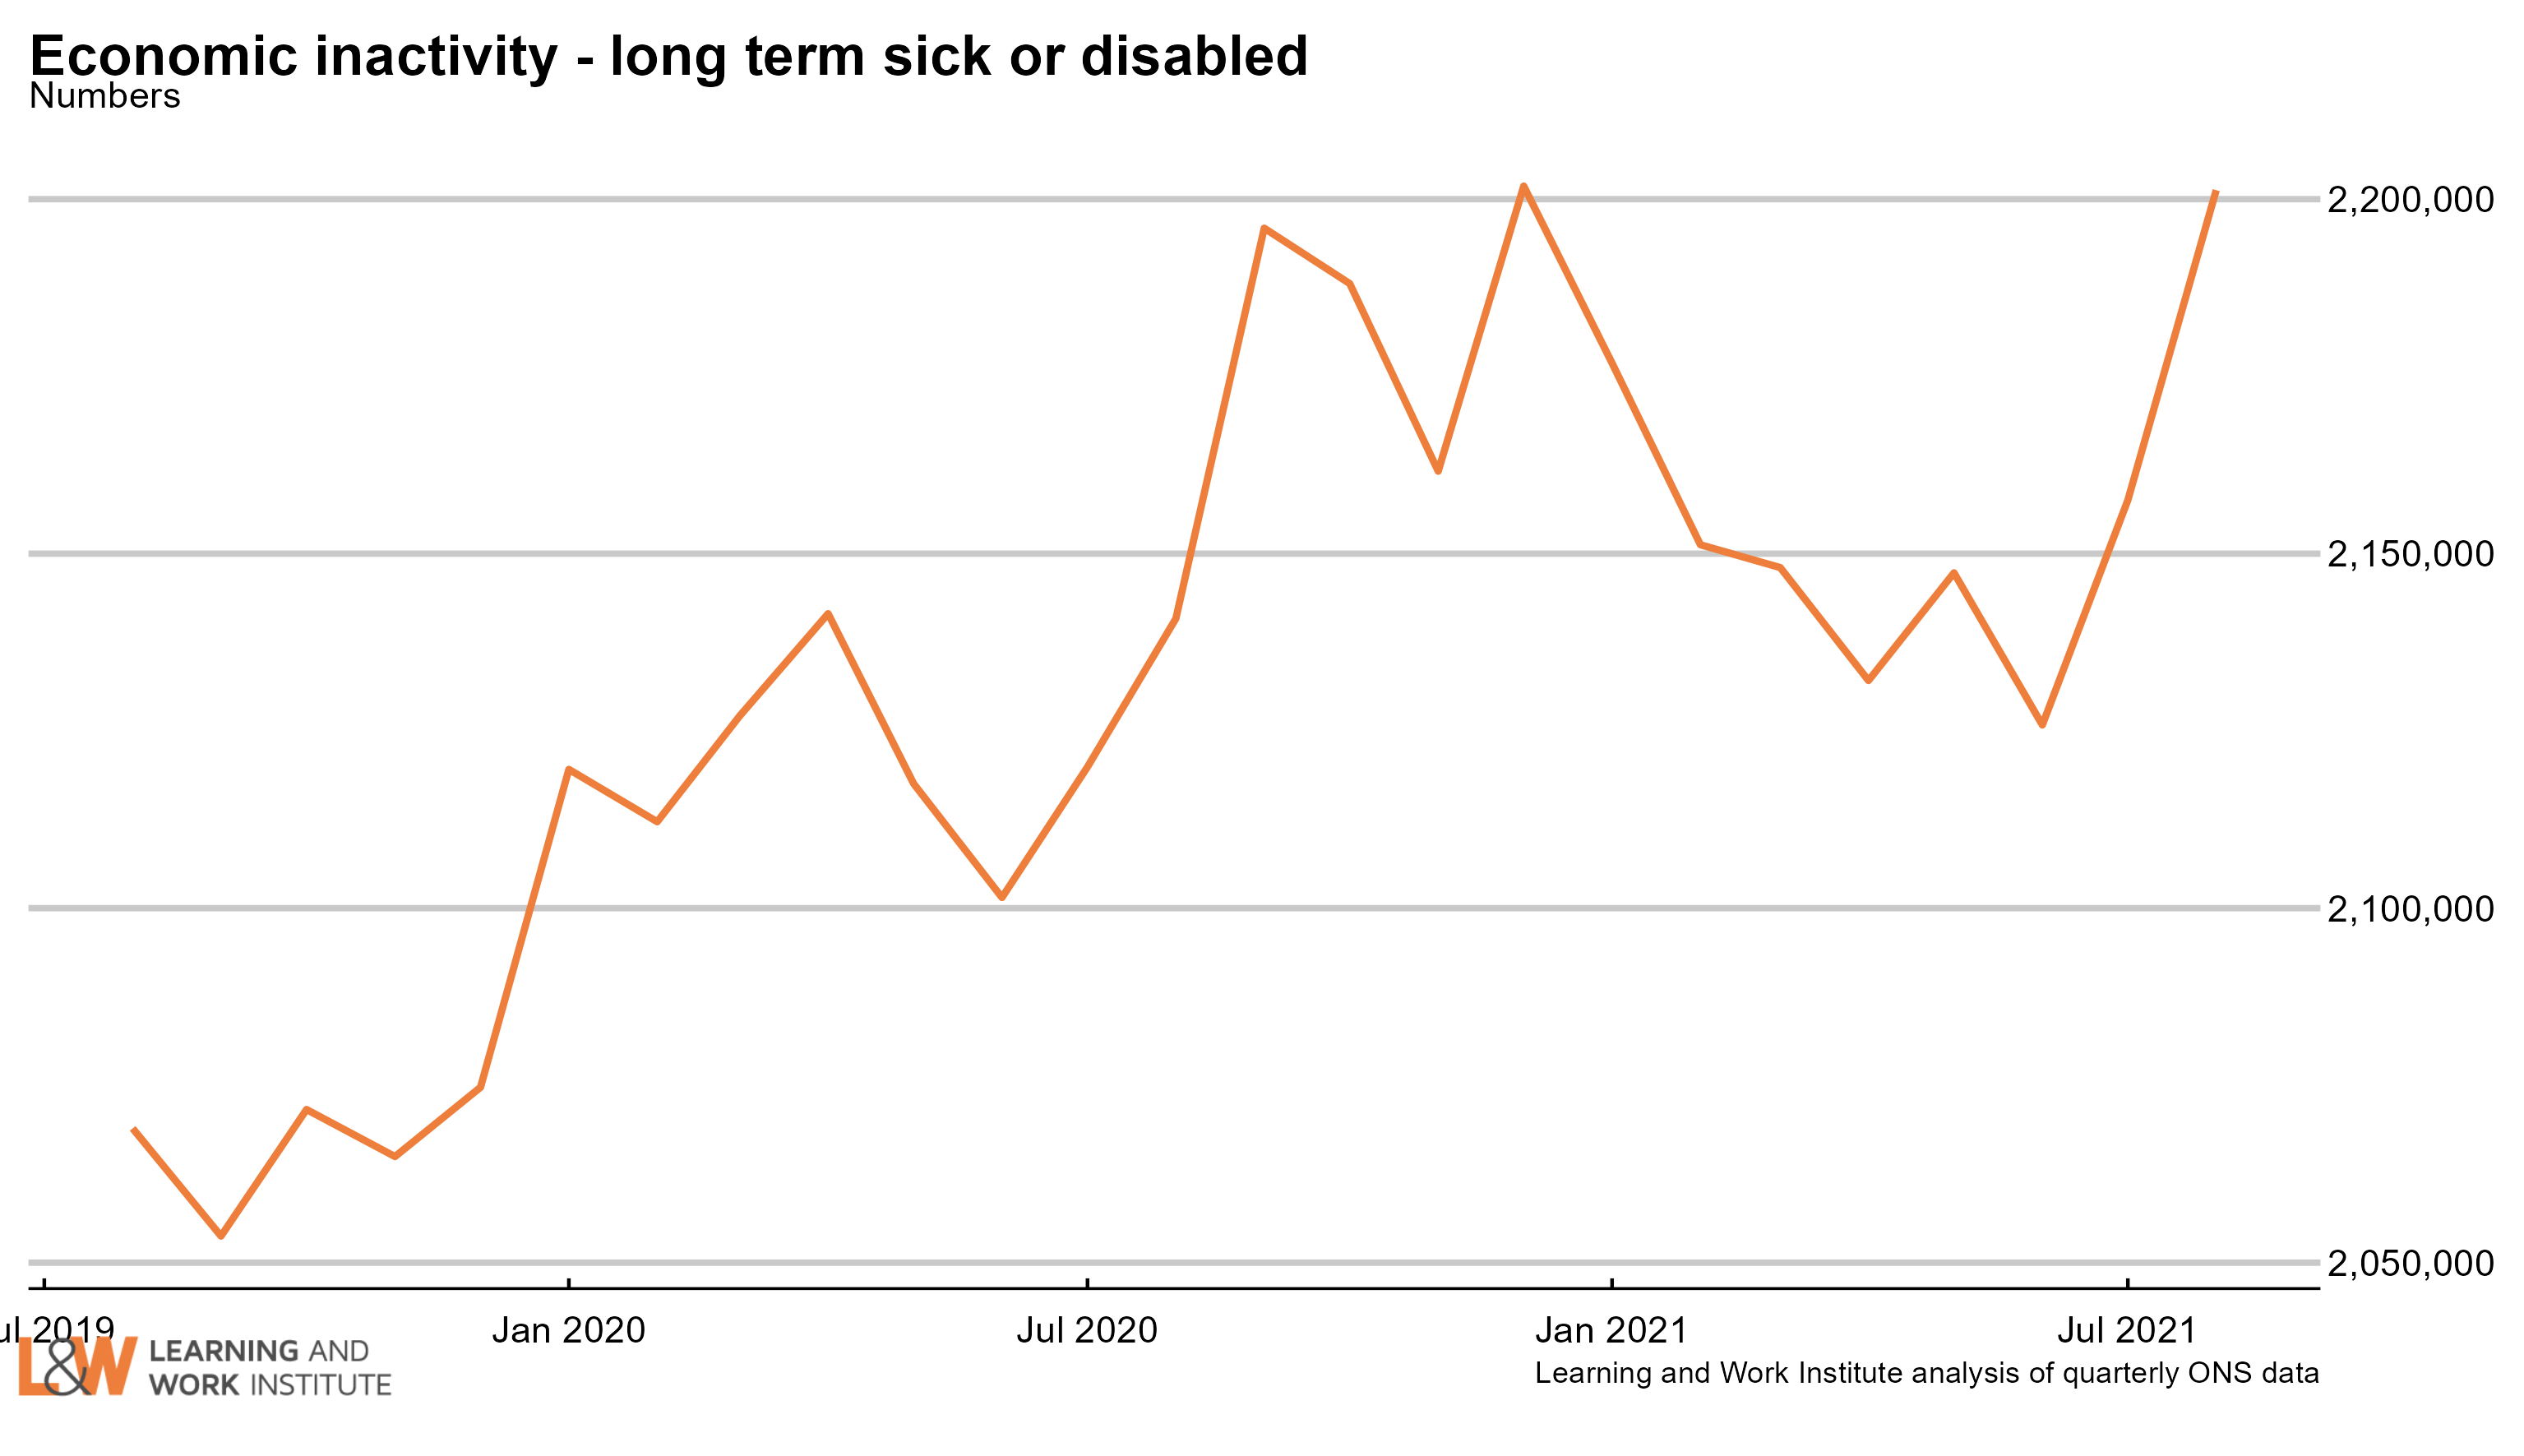
Chart 15: Economic inactivity – the long-term sick or disabled
The numbers of people who are economically inactive, that is, not working and not currently looking for work, who are long-term sick or disabled has risen sharply in the last two months to 2.2 million working age people.
 |
|
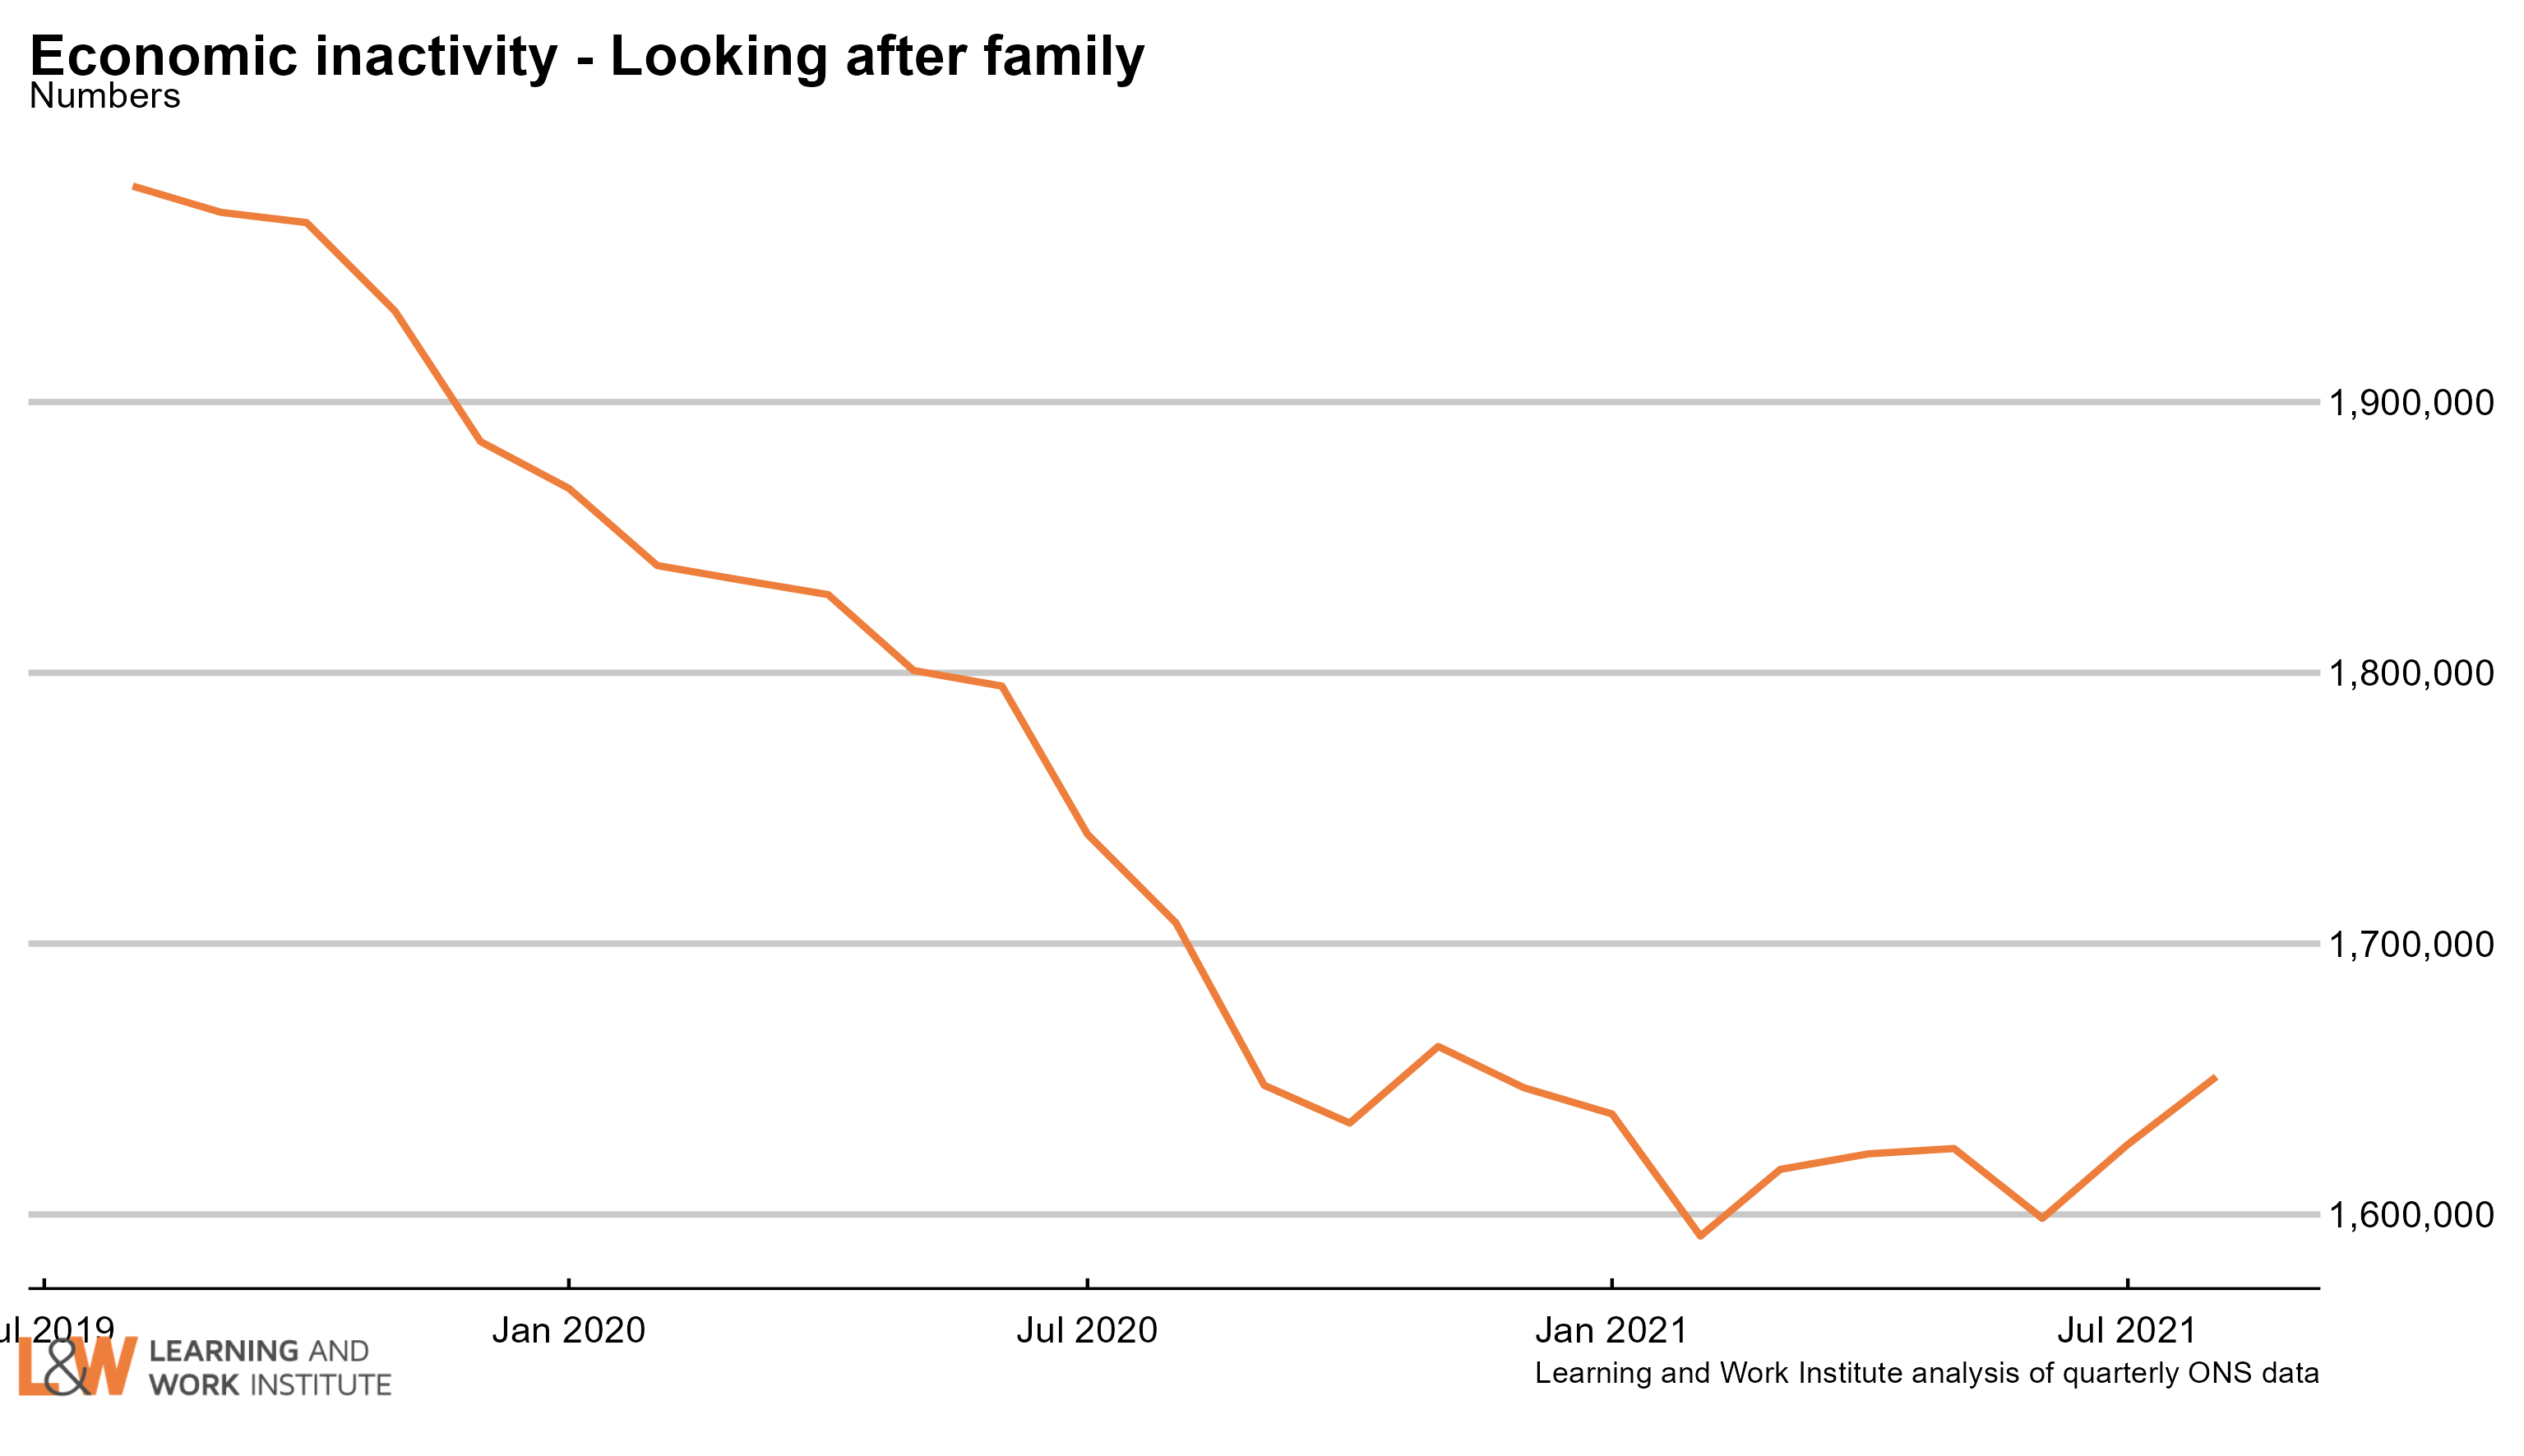
Chart 16: Economic inactivity – people looking after family
The survey figures (showing those looking after family) and not doing paid work or looking for paid work had been trending downwards but seems to have started rising.
 |
|
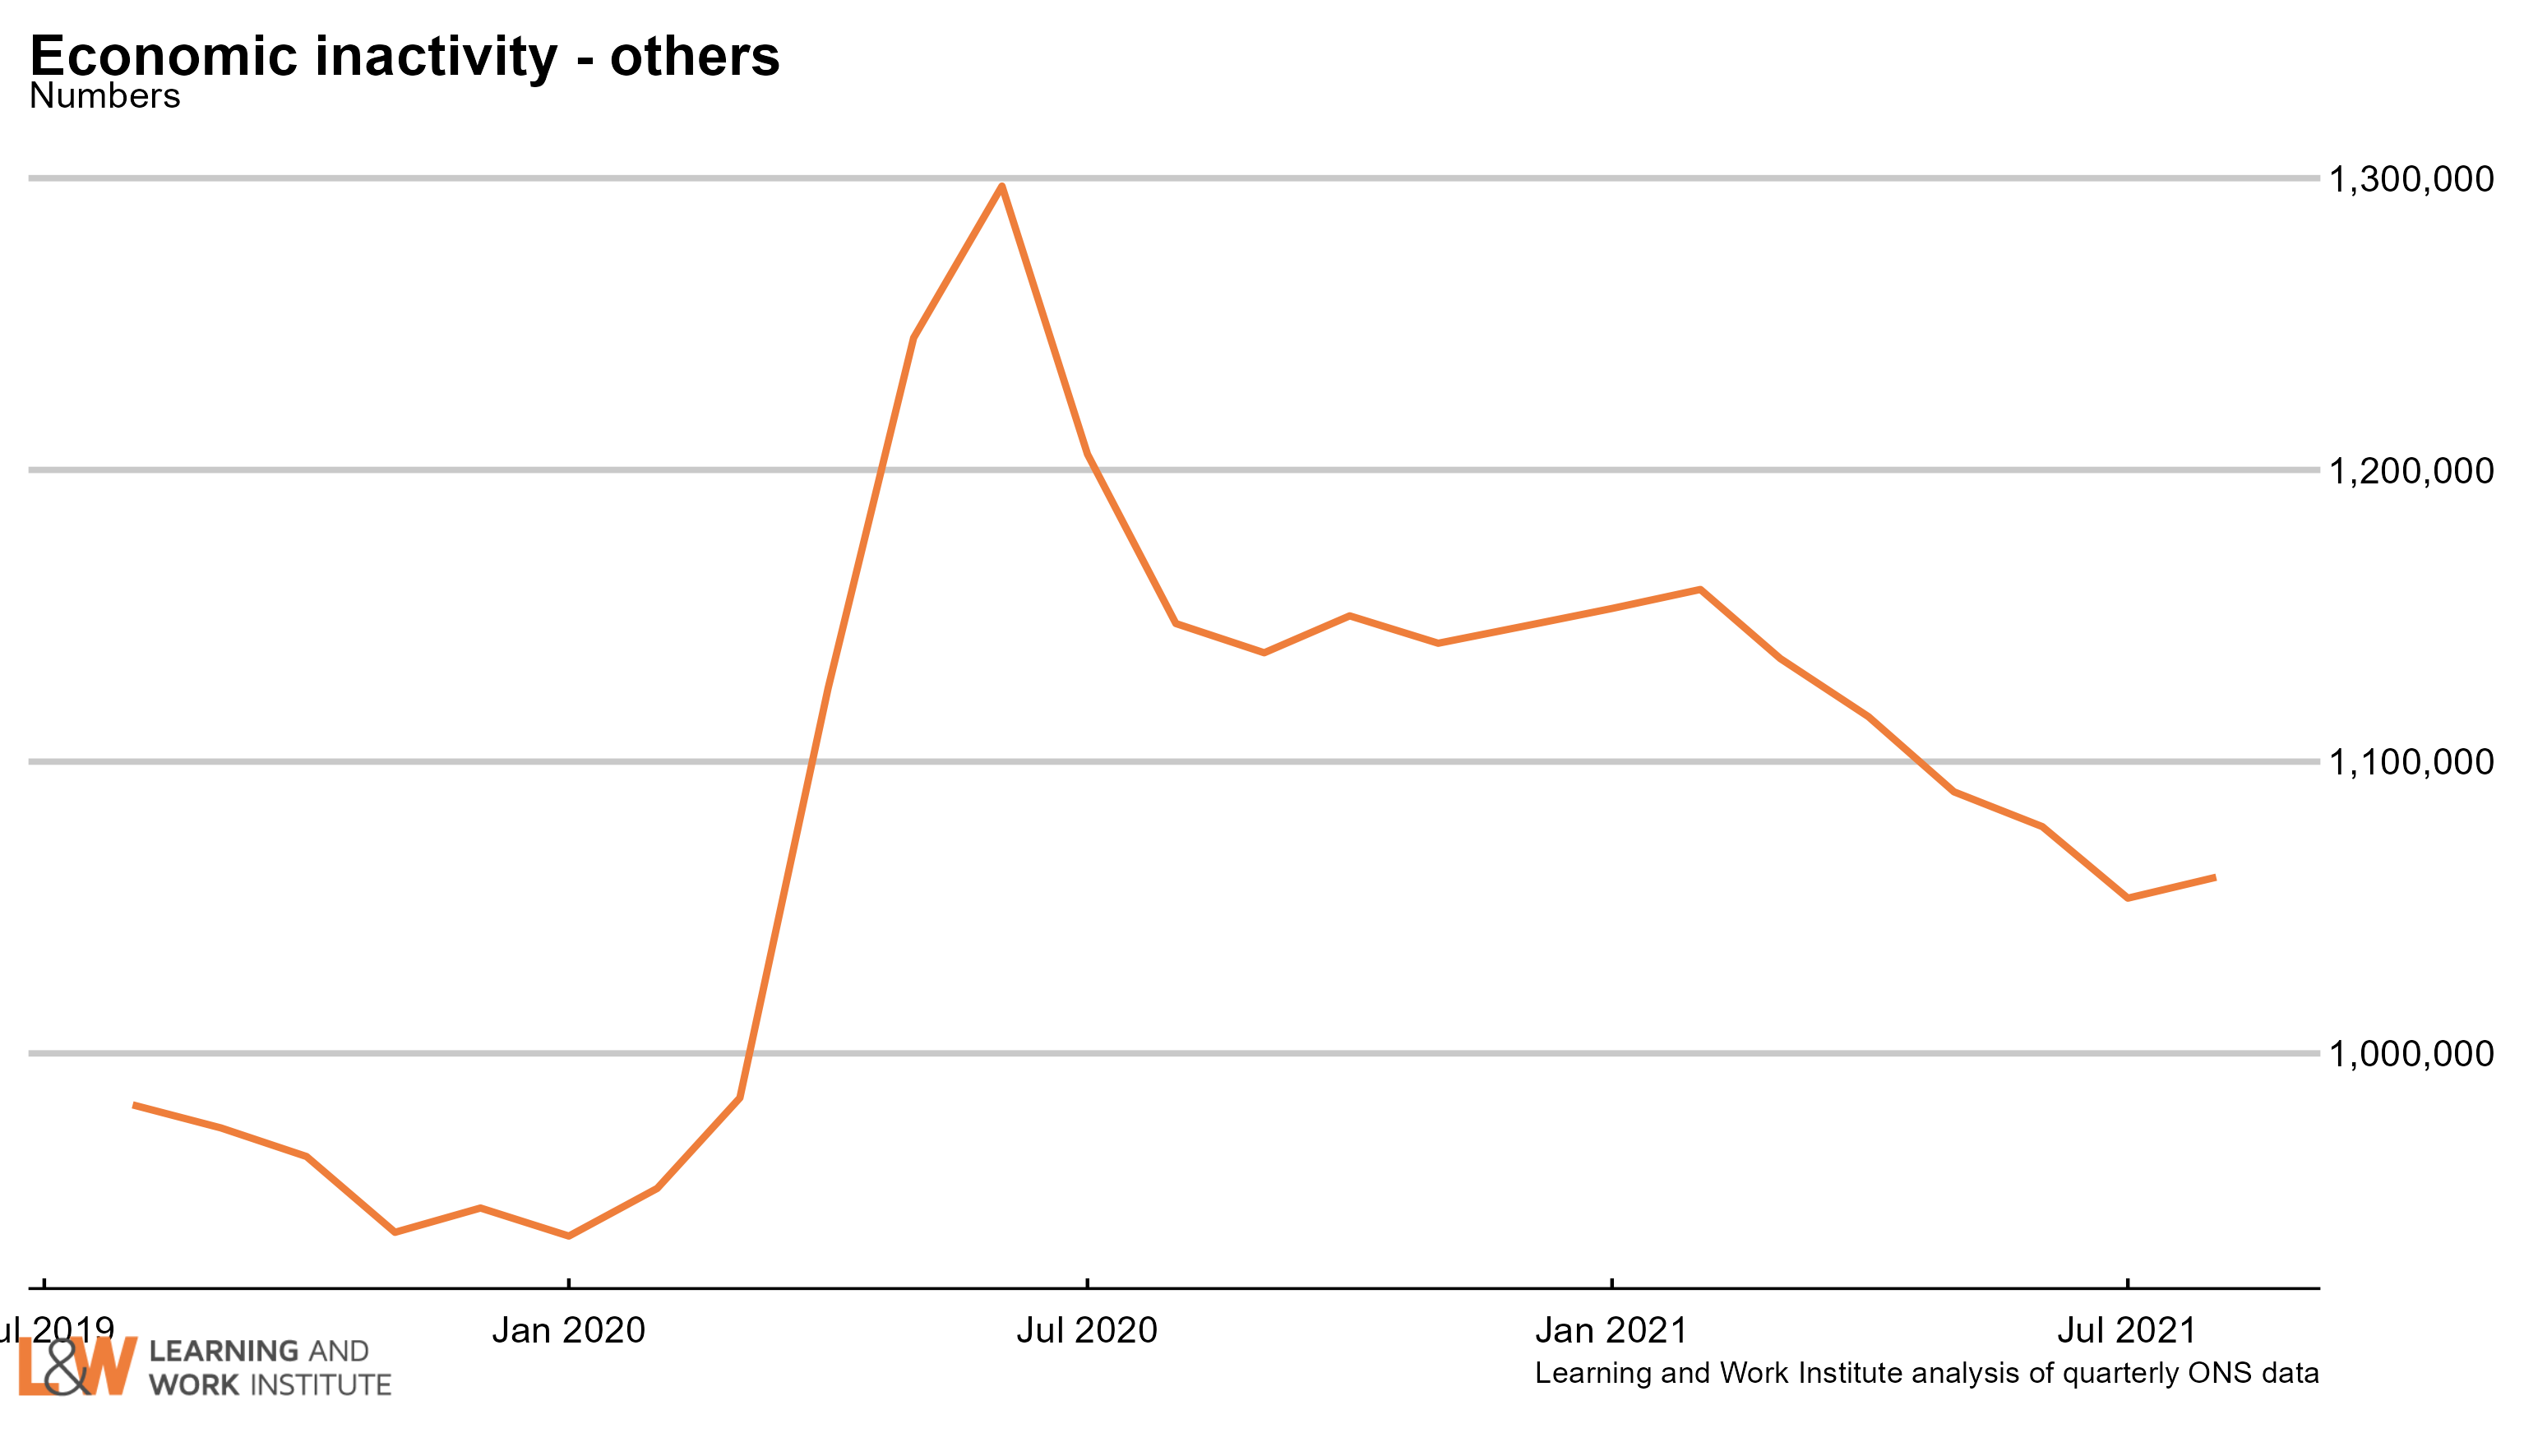
Chart 17: Economic inactivity – other inactive
In the Coronavirus period, people who were not working or looking for work due to Covid were included in this group. The number in this category increased sharply at the time, and has continued at a higher level than before. A very high proportion of this group want to work, and this increased over the period of the pandemic. The increase over the pre-pandemic level is now 107,000.
 |
|
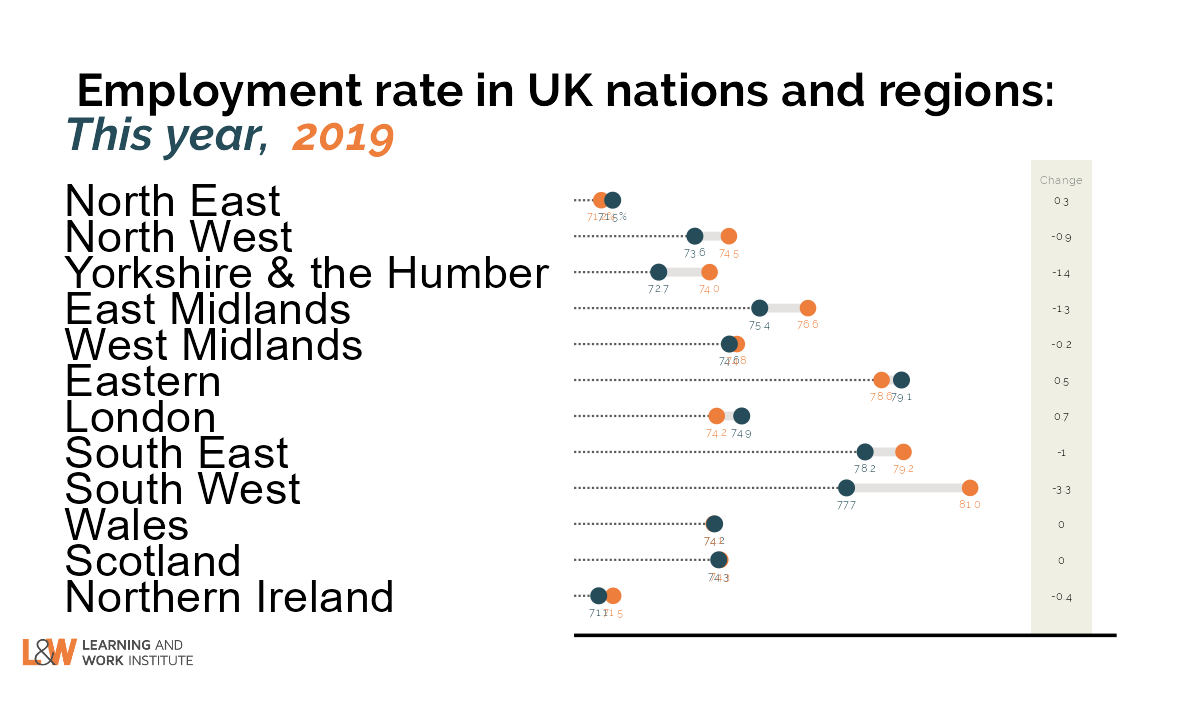
Chart 18: Employment rate two-year change in regions – June to August 2021
Compared with 2019, three regions showed a rise in the employment rate, led by the Eastern region and London. The employment rate fell in 7 regions, led by the South West and Yorkshire and the Humber.
 |
|
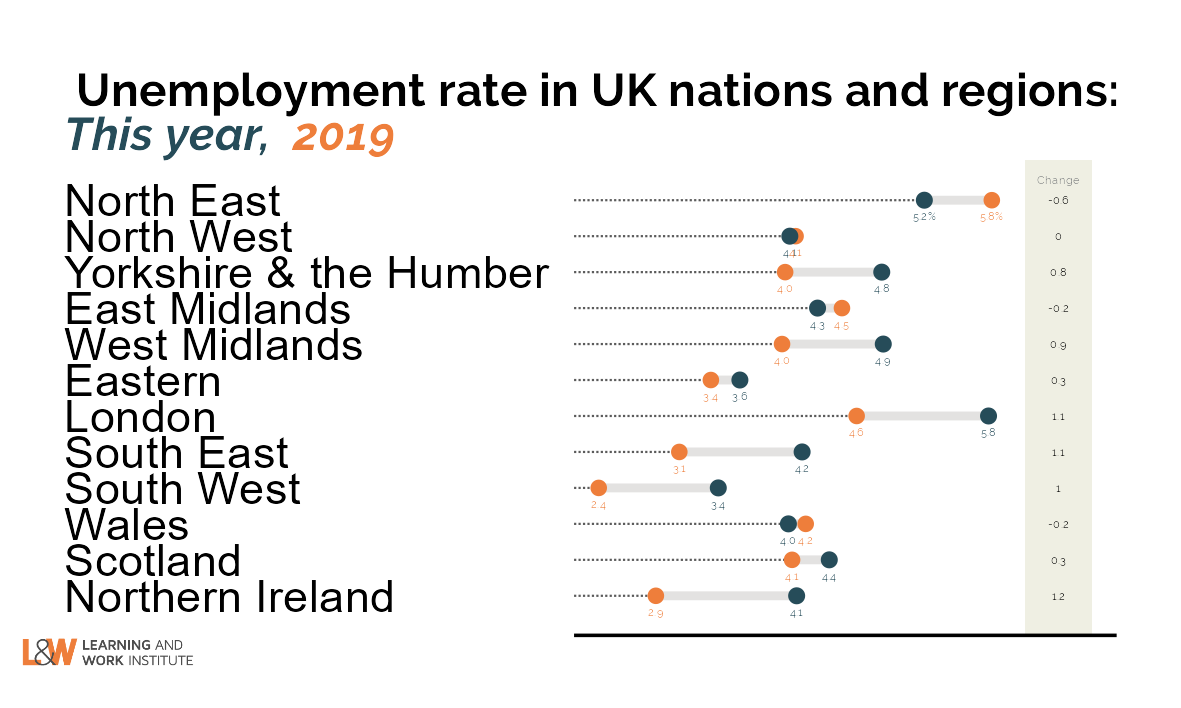
Chart 19: Unemployment rate two-year change in regions – June to August 2021
Compared with 2019, eight regions showed a rise in the unemployment rate, led by Northern Ireland, London and the South East. The unemployment rate fell in three regions, the North East, the East Midlands and Wales.
 |
|
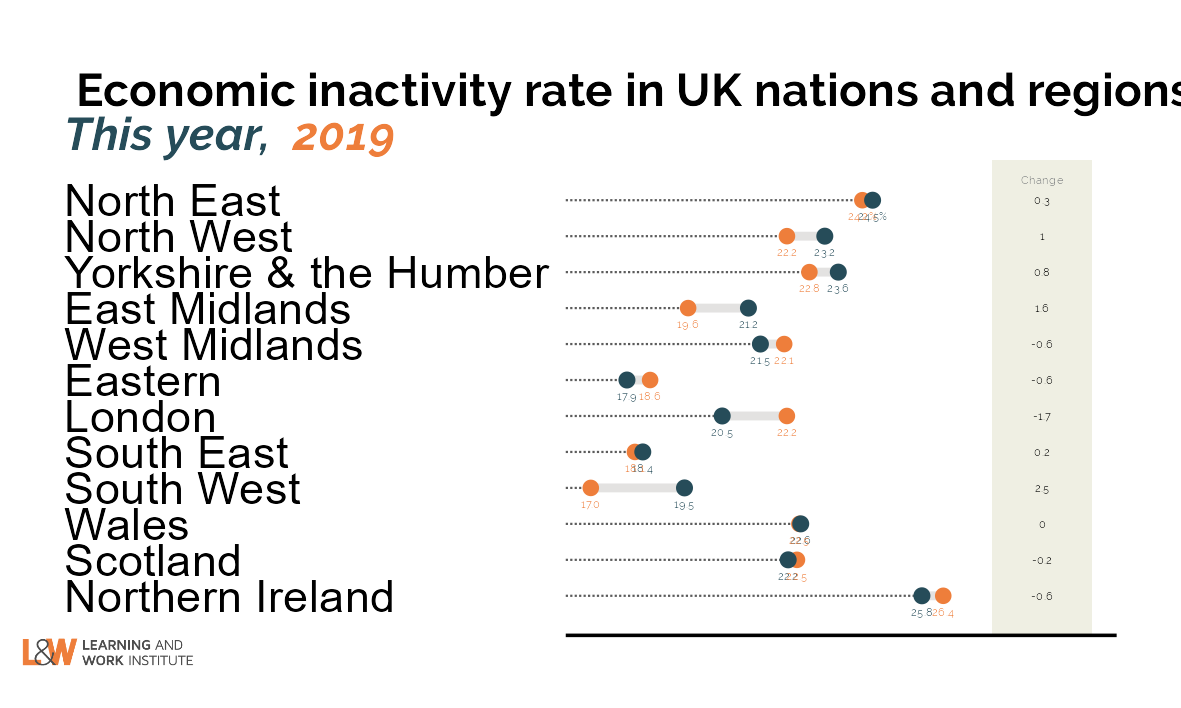
Chart 20: Inactivity rate two-year change in regions – June to August 2021
Compared with 2019, six regions showed a rise in the inactivity rate, led by the South West and the East Midlands. The inactivity rate fell in five regions, led by London.
 |
|
This newsletter is produced by Learning and Work Institute and keeps readers up to date on a wide range of learning and work issues.
If you have any questions, contact Paul Bivand
© 2020 Learning and Work Institute. All rights reserved. To subscribe click here
To unsubscribe, click here. To view this email in your browser click here. |
 |