|
Making learning and work count
Labour market LIVE from Learning and Work Institute
11 August 2020
- The ONS figure for claimant unemployed is 2,688,700, up by 94,400 on last month, and the claimant rate is 7.5%.
- The ONS figure for 18-24 claimant unemployed is 531,300 in July, up by 296,200 or 126.0% on March.
- Vacancies in July recovered by 135,000 after falling 480,000 between February and May.
- Unemployment (official measure) is 1,338,000, and has fallen by 9,000 from last month’s published figure (quarterly headline is down by 10,000), and the unemployment rate at 3.9% shows no change on last month and no change on last quarter.
- The number of workless young people (not in employment, full-time education or training) is 1,059,000, and has risen by 76,000 on the quarter, representing 15.4% of the youth population (increased by 1.1 percentage points).
- Youth unemployment (including students) is 543,000, up by 28,000 on the quarter.
- The employment rate is 76.4% and (showed no change on last month’s published figure and fell by 0.2 percentage points in the preferred quarterly measure).
Learning and Work Institute comment
This full briefing supplements the short briefing we published earlier on Tuesday 11 August 2020.
The headline labour market figures published on 11 August are not fully reflective of the underlying reality in the labour market. This is a product of the coronavirus crisis and the Government's policy responses to it.
Duncan Melville, chief economist at Learning and Work Institute, commented:
"The headline Labour Force Survey (LFS) numbers for employment and unemployment released today cover April to June of this year, but they fail to show the full negative impact from the COVID-19 pandemic and the lockdown measures put in place by the Government in response.
In the three months to April to June, employment is down by 220,000 - the largest quarterly fall since the Great Recession following the financial crisis. This fall is driven by a fall in the number of people who are self-employed - down by 238,000 in the quarter, while the number of employees actually rose by 52,000 in the quarter. These LFS employee numbers are in stark contrast with the data from HMRC on paid employees - on the same three-month rolling basis these are down by 565,000 and in the four months March to July they are down by 730,000. The difference between the LFS and the HMRC numbers suggests that the number of employees and employment overall could be around 600,000 lower than is being reported by the headline LFS numbers.
Furloughed employees should be included in both the LFS and the HMRC payroll numbers so this does not help explain the difference between the smaller falls shown by the LFS numbers relative to the HMRC ones. The ONS have identified around 300,000 people who say that they are in employment, temporarily away from work because of the COVID-19 crisis but received no pay in June. Such individuals would fall outside of the Coronavirus Job Retention Scheme and as the ONS say might not be people who are 'employed as we would normally understand it' such as informal workers previously working in establishments which were closed due to lockdown measures, who say they still have a job. This would help explain around half the difference between the LFS and the HMRC numbers, but the rest of the gap remains something of a mystery.
Even given the above LFS employment falls, the small fall in LFS unemployment of 10,000 in the three months to April to June is very surprising. In the current circumstances, it appears that increases in worklessness have been showing up much less in unemployment than in economic inactivity. Firstly, the normal job search requirements for receipt of Universal Credit were suspended between late March and the end of June. Additionally, individuals who are out of work appear to have been discouraged from seeking work by the collapse in vacancies and, or unable to start work because of caring responsibilities especially for school age children. In the three months to April to June, economic inactivity among people of working age rose by 82,000 and over the same period the number of economically inactive people wanting to work rose by 218,000. Overall, the number of people wanting to work rose by 208,000. This rise is much more in line with the fall in employment from the LFS of 220,000 over the same period. Hence, in current circumstances the change in the numbers wanting to work appear a better measure of changes in unemployment in a broader sense.
The claimant count numbers suffer from the opposite problem to ILO unemployment in that its rise is very probably overstating the rise in unemployment. Analysis by the Resolution Foundation suggests that there have been delays to the process of Universal Credit claimants having their work status accurately reflected. The consequence being that some furloughed workers who made out of work claims for Universal Credit would initially be placed on the Claimant Count. It is notable that last month the May Claimant Count numbers were revised down by an unprecedented 142,000. This month the June Claimant Count numbers were revised down by 37,000.
In place of LFS employment measures, total hours worked give a much more accurate depiction of the amount of labour market activity, in current circumstances. Furloughed employees count as being in work but are not actually working any hours. Hence, the Coronavirus Job Retention Scheme is holding up employment levels while the fall in total working hours reflects the reduction in demand for labour. Total hours worked fell by 21 percent or by 218 million hours between the week beginning 16 March, the last week before lockdown measures were instituted, and the week beginning 20 April and since then up to the last week of June total hours worked increased by 3 percent or 22 million hours. This rise occurred in May with hours worked broadly unchanged in June and suggests that there has been a small uptick in labour market activity since late April.
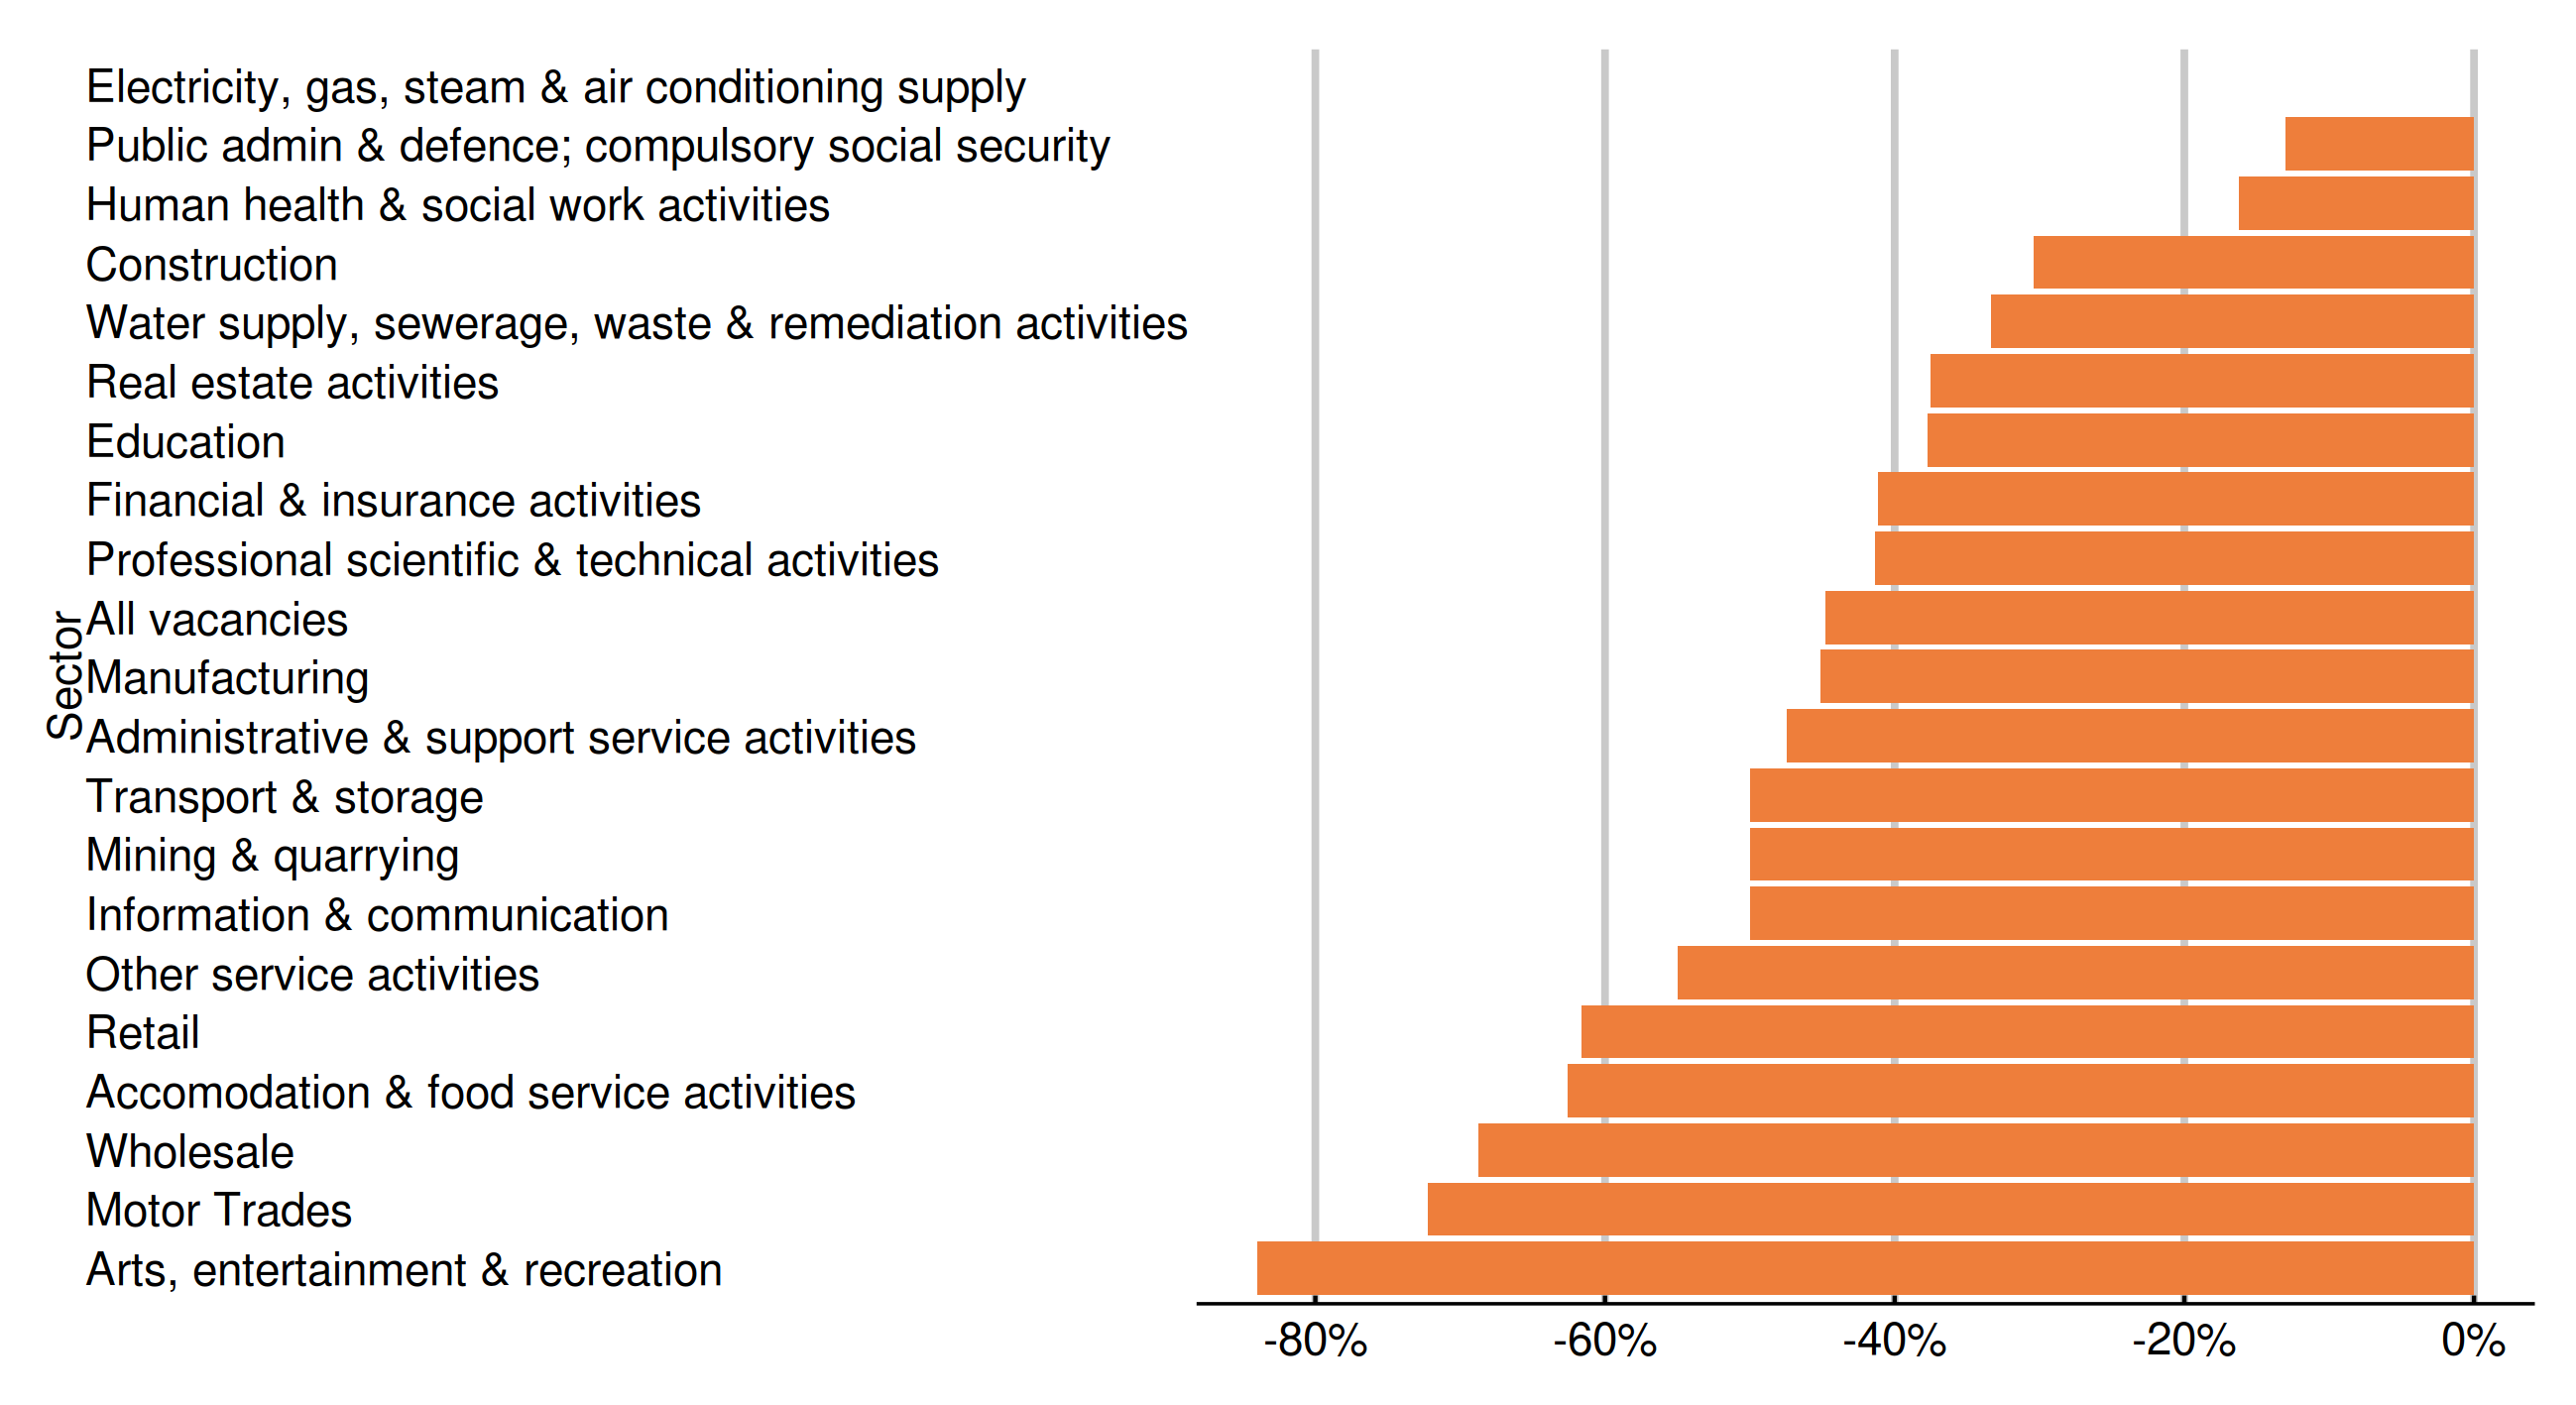
This view is supported by the trends in the numbers of employees who are temporarily away from paid work. Between the last pre-lockdown week beginning 16 March, and the week beginning 20 April this number increased by 5.8 million, and since then up to the last week of June, this number fell by 931,000. Vacancy numbers have also followed a similar pattern: down by 60 percent between February and May picking up from 315,000 in May to 472,000 in July.
Despite this slight pickup, the labour market remains very depressed compared to the pre-lockdown position, at the end of June hours worked were 19 percent lower, the number of employees temporarily away from paid work were 4.8 million higher, and in July vacancies were 41 percent lower than in February.
Unfortunately, the slight pickup in the labour market will not last. From the start of this month employers have had to pay the national insurance and pension costs of workers they have furloughed and the amounts employers have to pay towards the costs of furloughing will continue to increase up until October when the Coronavirus Job Retention Scheme ends. In consequence, large numbers of employers are likely to make substantial numbers of workers redundant. Already in the three months to April to June, the number of redundancies has increased by 27,000 to 134,000 - the highest level of redundancies since early 2013.
Last month I noted that a survey by the British Chambers of Commerce found that 29 percent of businesses expected to cut jobs in the following three months. This month there is further evidence which suggests a wave of redundancies is coming in the next few months. Yesterday, the Chartered Institute for Personnel Development and the Adecco Group reported that one in three organisations were expecting to cut jobs during July to September. Consistent with this the Bank of England reported both a sharp rise in employers' expectations that they would make significant redundancies in the next 12 months, and an increase in the rate of redundancies in June and July. The Bank also reported intelligence from the Insolvency Service suggesting that redundancy intention notifications rose markedly in June.
In line with these expectations for a rise in layoffs, recent forecasts from the Bank of England and the National Institute for Economic and Social Research (NIESR) both pointed to a substantial rise in unemployment by the end of this year and that unemployment would stay at above pre-crisis levels for an extended period. They differ in the extent of the rise in unemployment and how long unemployment will remain elevated. The Bank of England project that unemployment will peak at 7.5 percent at the end of this year which I estimate would equate to around 2.6 million unemployed nearly double the current level of unemployment. Unemployment is then expected to stay above pre-crisis levels until the second half of 2023. NIESR take a more pessimistic view, they anticipate unemployment reaching 10.0 percent at the end of this year which I estimate would equate to around 3.5 million unemployed. They then expect unemployment to stay above pre-crisis levels throughout the period they forecast which is 2024. Last month I reported on the projections released by the Office for Budget Responsibility, which set out a central scenario suggesting official unemployment could peak at 11.9 percent at the end of this year.
The above projections for much higher unemployment for an extended period are not inevitable. They can at least be moderated by policies that keep people attached to the labour market. Hence, on top of the measures already announced the Government should look again at extending support for jobs in the hardest-hit sectors, and it must ramp-up employment and training support for those who may lose their jobs and those who unfortunately do.
Paul Bivand, associate director for statistics and analysis at Learning and Work Institute, said:
"This briefing contains mostly information from the Office for National Statistics, where they have been keen to provide the very latest data on an experimental basis.
Meanwhile, the DWP data release this time consists of Universal Credit statistics to a range of different dates (starts to May, claimant levels to July, households to May), and all other benefits and the benefit combinations data to February 2020.
As very large numbers of people claiming benefits on ill-health grounds remain on Employment and Support Allowance, including new claimants as well, this delay in publication is unhelpful to those trying to see how the benefits system is responding to the crisis." |