 |
|
Making learning and work count
Labour market LIVE from Learning and Work Institute
17 August 2021
- Unemployment is 1,600,000, down by 36,000 from last month’s published figure (quarterly headline has fallen by 53,000) and the unemployment rate 4.7%, fell by 0.1 percentage points on last month and is down by 0.2 percentage points on last quarter.
- The ONS figure for claimant unemployed is 2,293,000, and is down by 7,800 on last month, and the claimant rate is 5.7%.
- The number of workless young people (not in employment, full-time education or training) is 852,000, fell by 39,000 on the quarter, now representing 12.5% of the youth population (down by 1.7 percentage points).
- Youth unemployment (including students) is 530,000, and has fallen by 13,000 on the quarter.
- Vacancies in May-Jul 2021 rose (in the ONS official series) to 953,000 after recovering strongly from the low point of 340,000 in April to June 2020.
- There are now 1.8 unemployed people per vacancy.
- The employment rate is 75.1% (increased by 0.3 percentage points on last month’s published figure and is also up by 0.3 percentage points in the preferred quarterly measure).
Learning and Work Institute comment
The labour market figures published on 17 August point to a strengthening recovery in the labour market.
Duncan Melville, Chief Economist at Learning and Work Institute, commented:
"Today's numbers from the Labour Force Survey (LFS) showed employment was up by 95,000 in April to June 2021 compared to the previous quarter. This is a larger increase than figures published in recent months by the ONS. The LFS data also showed a fall in unemployment similar to recent months. A notable and welcome change this month is the fall in economic inactivity amongst working age people of 96,000. This is the first substantial fall in inactivity since December 2019 to February 2020 prior to the onset of the pandemic. This suggests that the continuing recovery is now
attracting individuals to re-enter the labour market and find work.
Other more timely data also suggests that the labour market recovery continued into July and August. In July, the number of payrolled employees rose markedly by 182,000 - the third consecutive month of increases close to 200,000. Note, however, that the massive 356,000 June increase in payroll numbers released last month has today been revised down to 193,000. For the three months May to July, vacancy levels reached an all time high of 953,000 and the single month (seasonally unadjusted) vacancy numbers for July exceeded one million for the first time. The online job advert figures from Adzuna indicated that increasing vacancy levels continued into this month. Standing in contrast with these numbers is the surprising small fall, down by just 8,000, in the claimant count in July. In the previous two months combined the claimant count fell by 287,000 so another large fall for July had been
anticipated. This raises concerns about the functioning of Jobcentre Plus in helping people to move back into work.
One feature that many have been pointing to in recent weeks is the combination of substantial numbers of workers on furlough, 1.9 million, at the end of June, with very high vacancy levels and signs that many employers are struggling to find people to fill vacancies. Looking at the vacancy and furloughed workers data on a sectoral basis shows that industries which accounted for larger shares of vacancies in May to July also accounted for larger shares of furloughed workers. Thus, there does not seem to be a mismatch between where the potential available (furloughed) workers are and where the available jobs are. Hence, the labour market appears to be 'gritted up' and is not working as effectively as it could to match the available workers with jobs.
Wage growth figures also point to a strong labour market. The headline annual wage
growth in average total pay (including bonuses) was 8.8 percent and the growth in regular pay (excluding bonuses) was 7.4 percent for April to June 2021. However, these headline numbers are affected by firstly, the very high numbers of workers who were furloughed on reduced pay levels a year ago and secondly, the pattern of job losses over the pandemic which has disproportionately impacted on lower paid workers, pushing up the overall average pay levels. Adjusting for these distortions the ONS estimate that underlying wage growth is running at between 3.5 and 4.9 percent which is well above recent growth rates. After more than a decade of very low wage growth following the Great Recession, this boost, if sustained, would be a welcome boost to living standards. However, it is already leading to speculation that the Bank of England will see this as a threat to inflation and so will raise interest rates sooner than had been expected.
Today's numbers suggest
that the labour market is recovering robustly. However, we still expect unemployment to rise once the Coronavirus Job Retention Scheme ends next month. We anticipate that while many furloughed workers will return to work, or increase their working hours if partially furloughed, some will be made redundant, and this will push up unemployment. The consensus from the latest July Treasury survey of independent forecasters is that the unemployment rate is expected to reach 5.4 percent in the last quarter of 2021.
In contrast, the latest Bank of England prediction in this month's Monetary Policy Report is that the unemployment rate will be around its current level at the end of the year. The Bank's view is driven by their expectation that the number of furloughed workers will fall from 1.9m at the end of June (last actual) to an average of "around half a million" over July to September. Recent survey evidence suggests that the number of individuals on furlough
had fallen to around 1.0m by the end of July, and the number of furloughed workers can be expected to fall further in August and September. Even so, the Bank's expectation seems optimistic. With this expected number of formerly furloughed workers, the Bank expects a combination of rising economic activity to absorb many back into work and others to leave the labour market. Consequently, the Bank takes the view that unemployment will not rise. We think this is likely to be overly optimistic especially in the light of the fall in economic inactivity shown by today's figures. Hence, policy will still need to focus on tackling higher unemployment this year and next. This view is reinforced by the expectation that the substantial rise in long term unemployment we have already seen will continue. Individuals who have experienced a long period of unemployment find it especially difficult to get back into work."
Paul Bivand, Associate Director, Statistics
and Analysis at Learning and Work Institute said:
"This month the HMRC employee numbers show a large rise, following on earlier sharp rises. The survey estimates, for both total employment and employee numbers, do not show this rise. HMRC's latest month 'flash' estimates are regularly revised down. There may be administrative issues. However, such issues are known and taken into account as far as possible. The survey estimates of employees were far below the HMRC numbers before the pandemic, and the fall in HMRC jobs brought them much closer to alignment. This recent change reverses that closer alignment. However, there is, in the survey information, no sign of a substantial rise in self-employment (where people may employ themselves as employees through a limited company, accounting for some of the discrepancy). We will watch these discrepancies in future months.
This month there are no major statistical changes, but the ONS have released
a number of datasets that they had held over to revise this month from last month's releases.
These datasets include labour market flows (a large increase in flows to work - in April to June 2021, 1.95 million people started new jobs, 59% of whom had been out of work); the employment rate gap for disabled people has dropped from a pandemic peak, but not retutned to pre-pandemic levels; ethnic minority economic activity; and economic activity by country of birth or nationality."
Employment rose by 95,000 between January to March 2021 and March to May 2021. In the last 12 months employment fell by 329,000.
Unemployment has fallen by 53,000 between January to March 2021 and March to May 2021, and the unemployment rate fell by 0.2 percentage points to 4.7% in the quarter.
Economic inactivity is down by 96,000 between January to March 2021 and March to May 2021, and the inactivity rate fell by 0.3 percentage points to 21.1% in the
quarter.
The national claimant count decreased by 7,800.
Youth unemployment has fallen by 13,000. There are 530,000 unemployed young people, and 320,000 (4.7% of the youth population) who are unemployed and not in full-time education.
Self-employment is down by 411,000 this year. The number of employees has risen by 112,000 over the year. Involuntary part-time employment fell by 49,000 this quarter to 982,000, 12.7% of all part-time workers. Involuntary temporary employment rose 23,000 to 536,000, 33.2% of all temporary workers.
|
 |
Chart 1: UK unemployment (ILO)
The latest unemployment rate has fallen by 0.1 percentage points in the month to 4.7%. 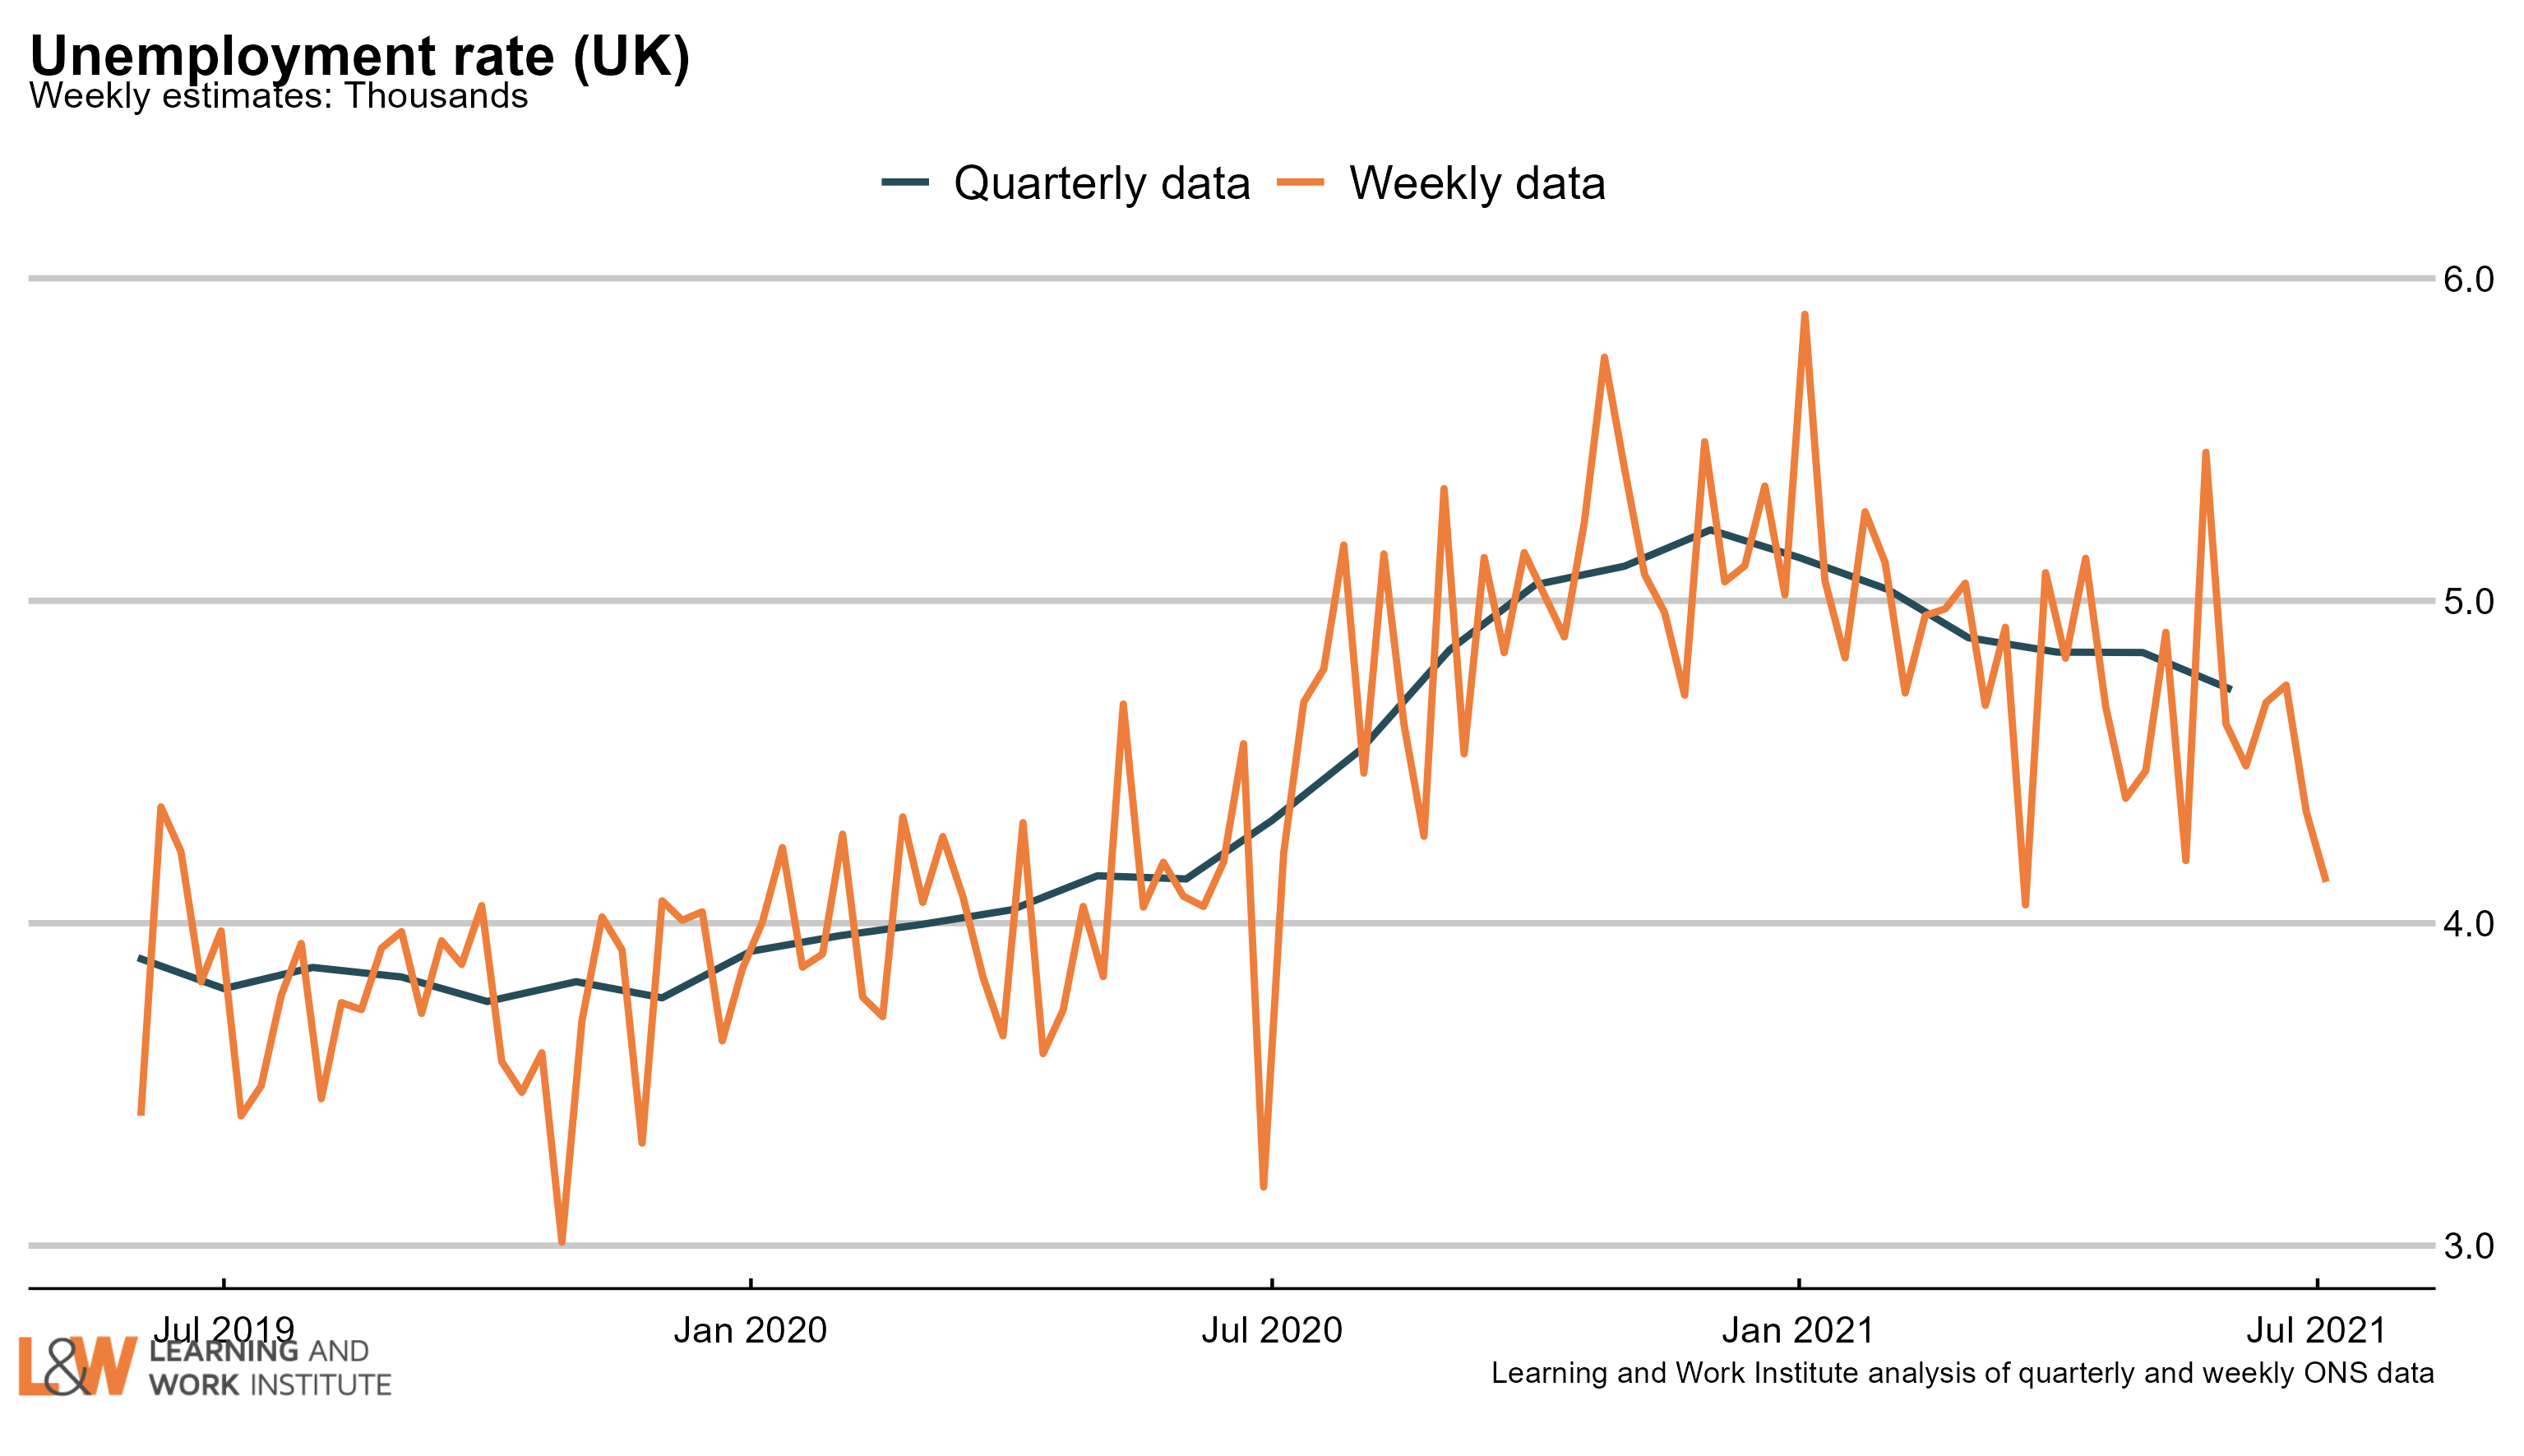 |
|
Chart 2: The claimant count and UK unemployment compared
The number of unemployed people who are claiming unemployment-related benefits is now 692,700 higher than the number of unemployed in the official measure. 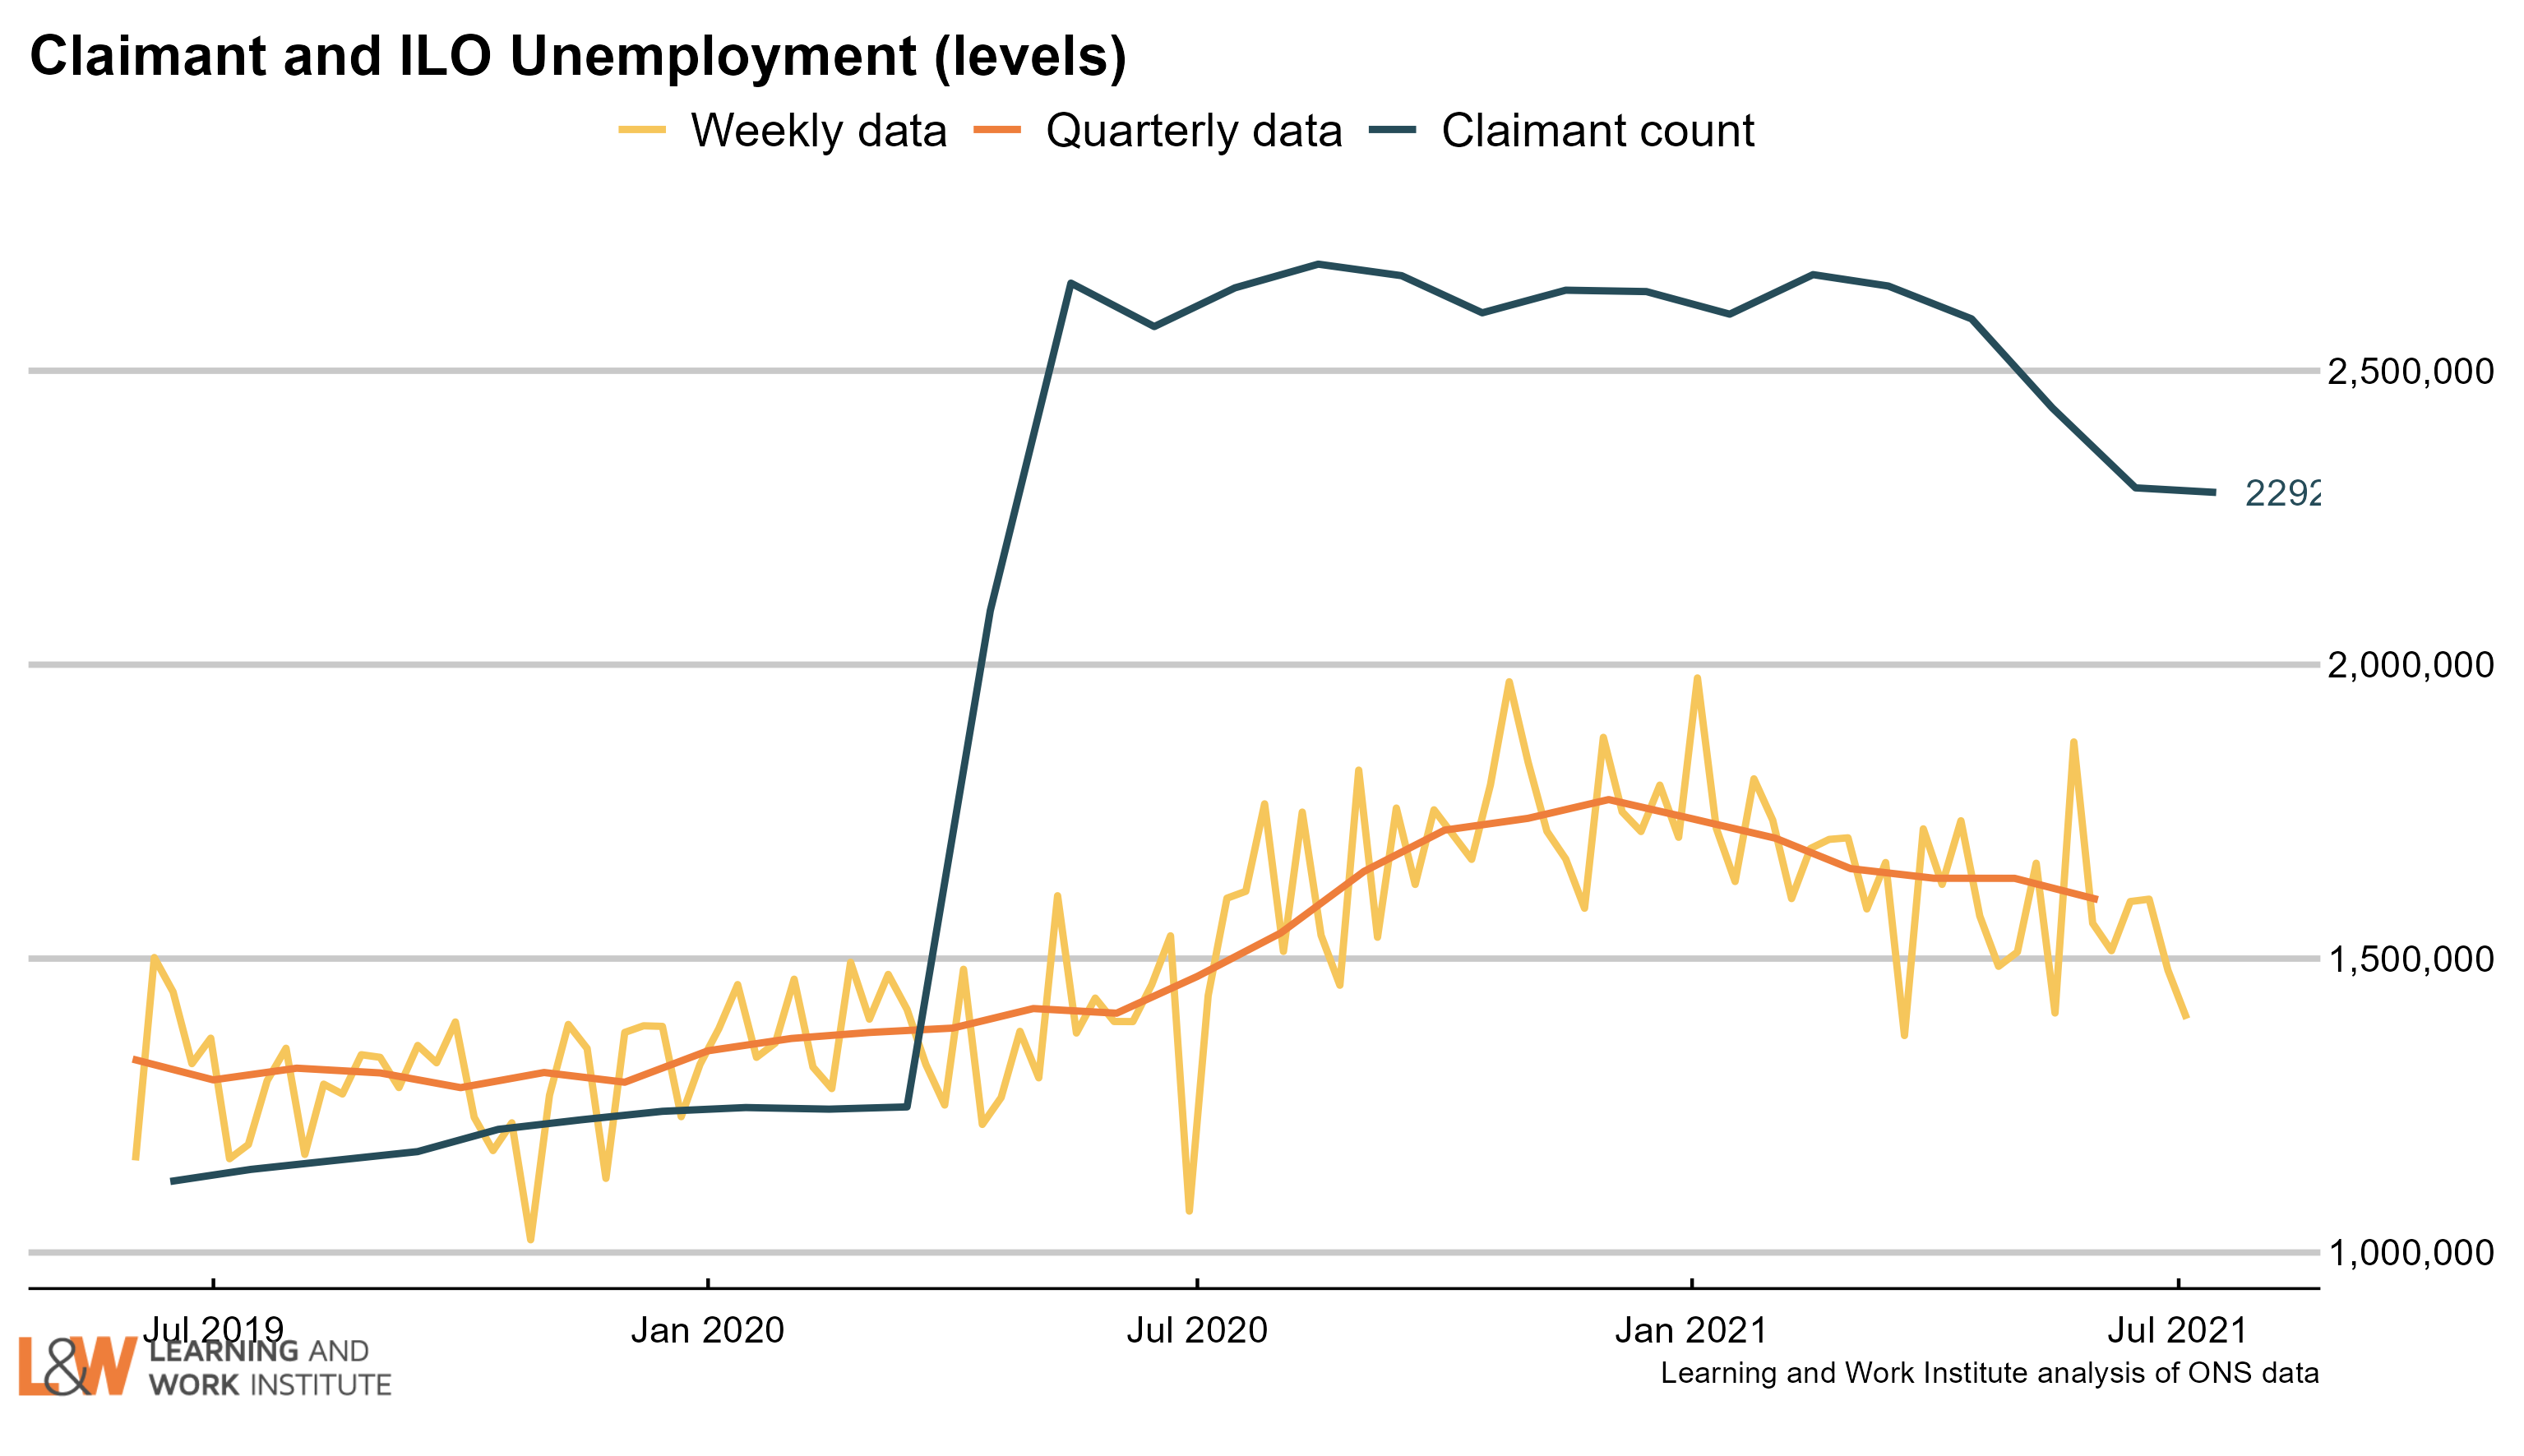 |
|
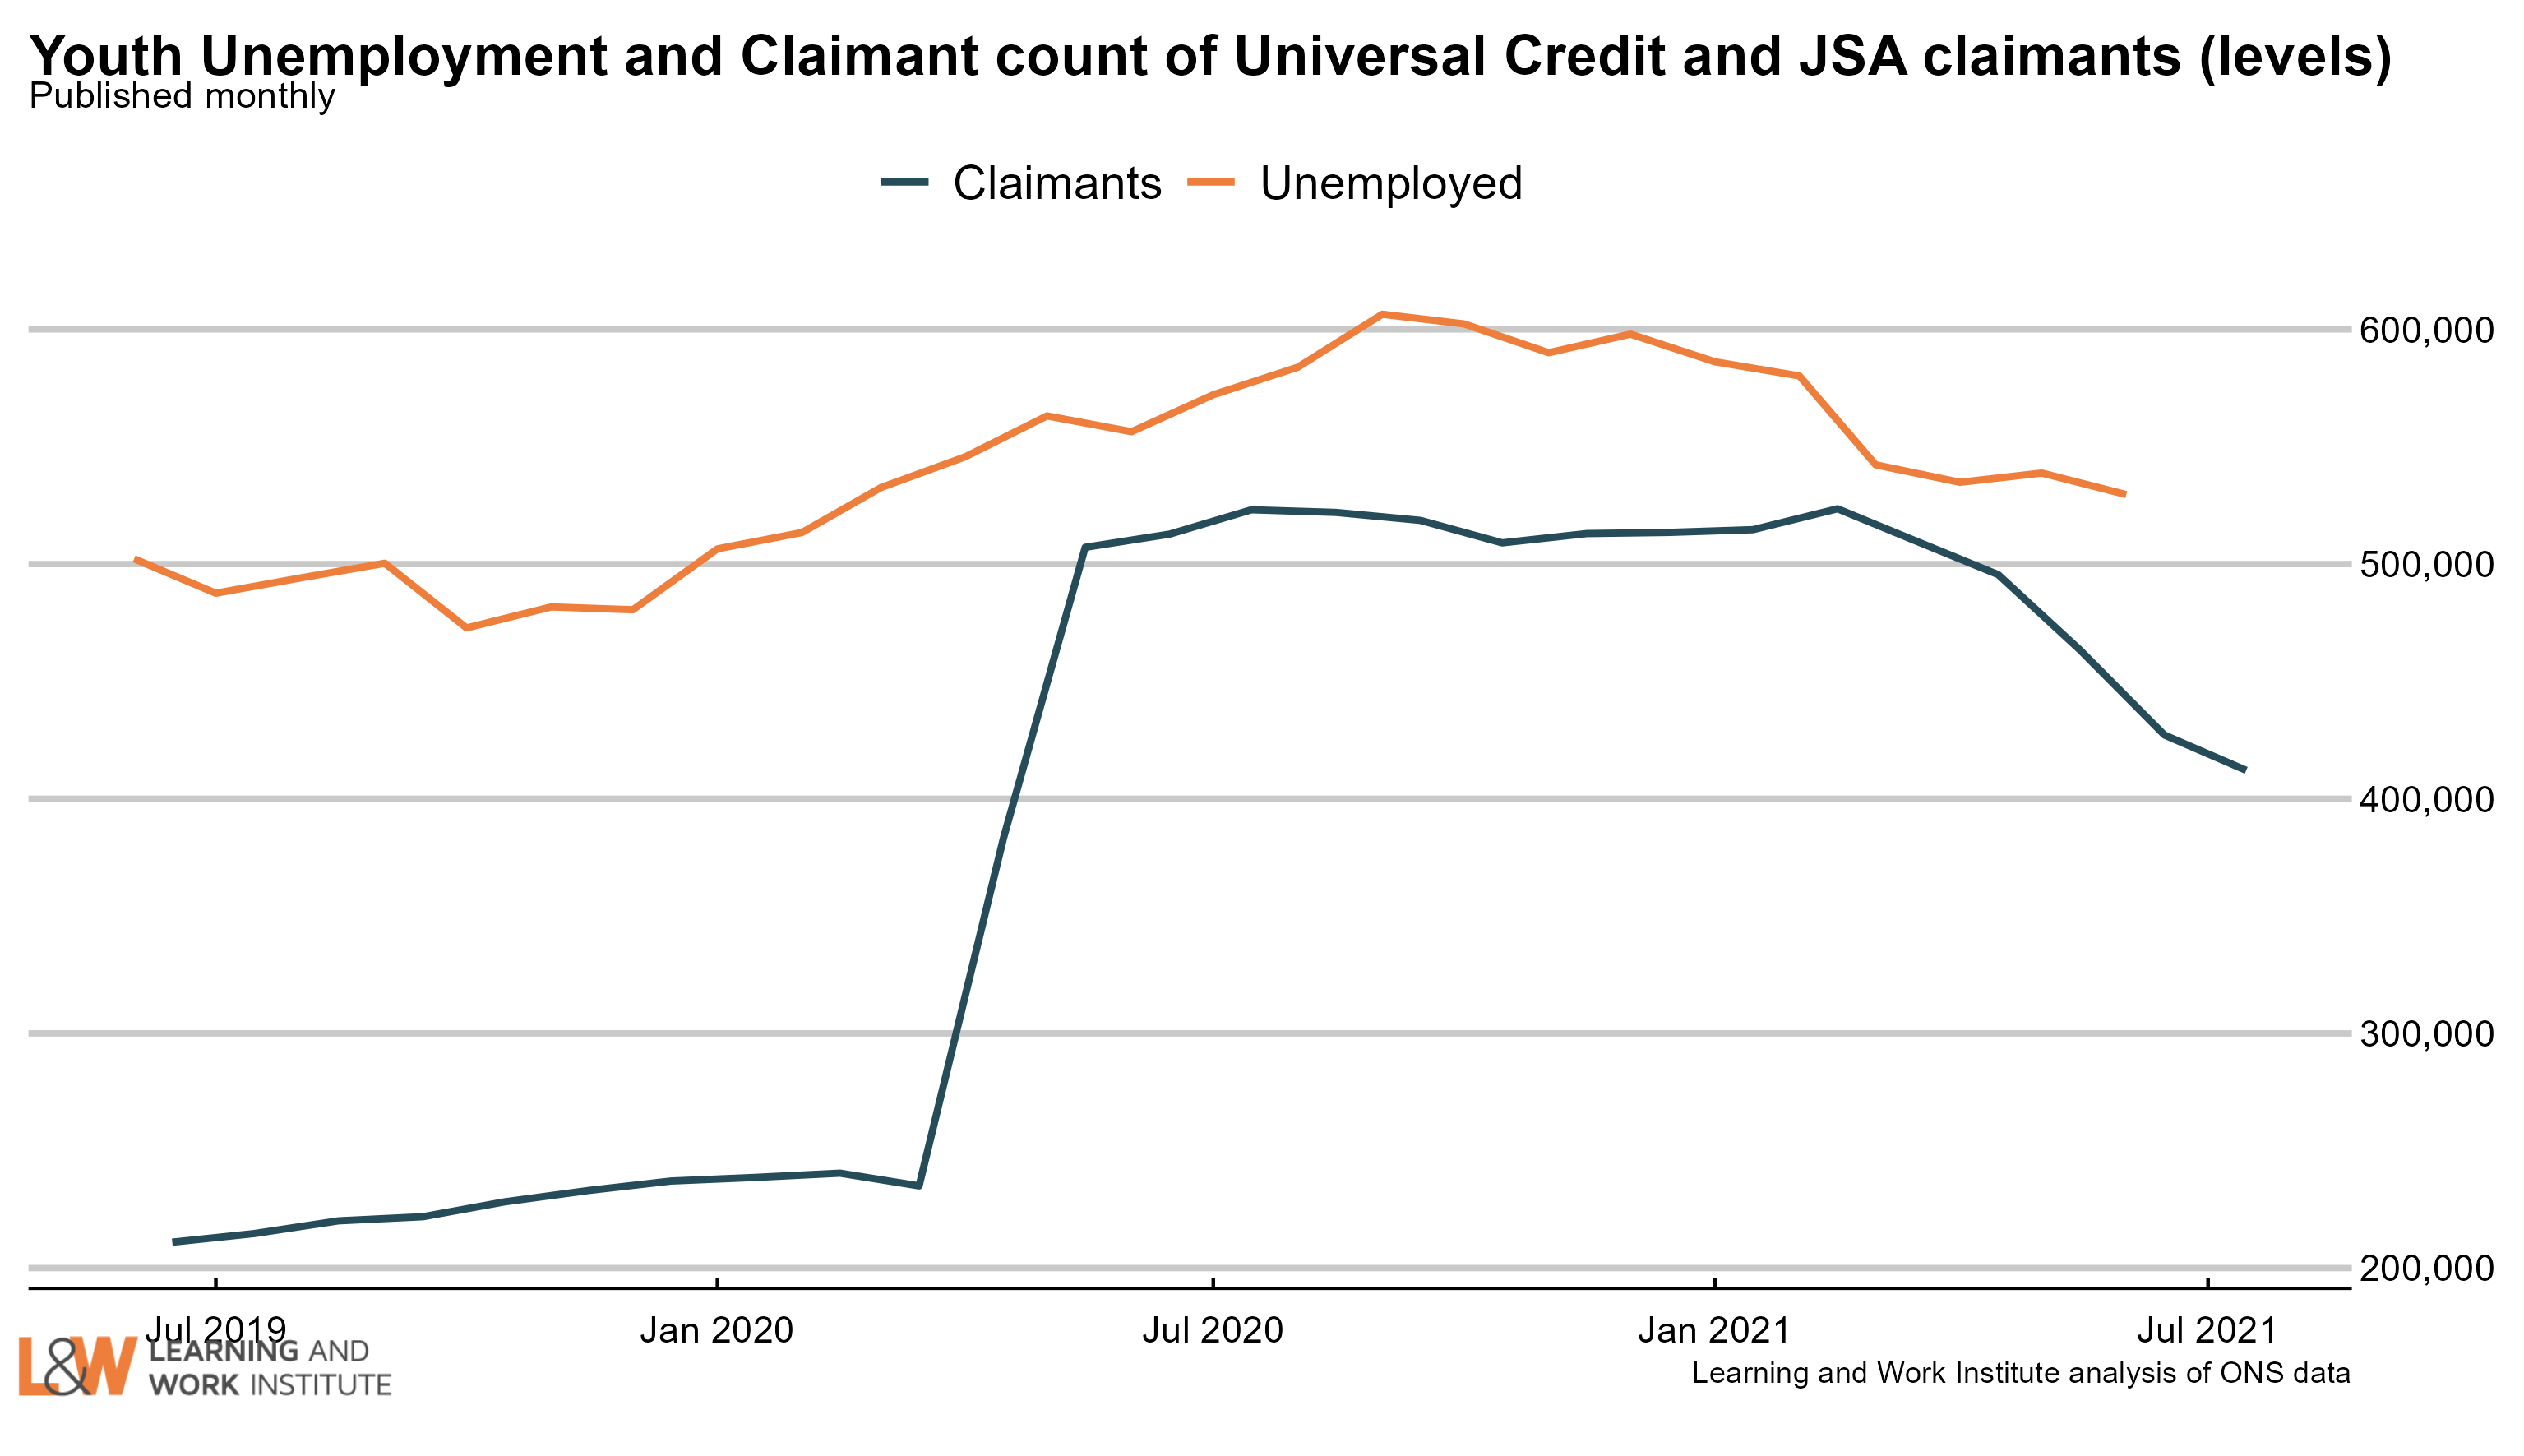
Chart 3: Youth unemployment
The number of unemployed young people fell by 9,000 since last month’s figures, to 530,000.
Meanwhile, the number of young Universal Credit or Jobseeker’s Allowance claimants fell last month by 15,000, to 412,100.
 |
|
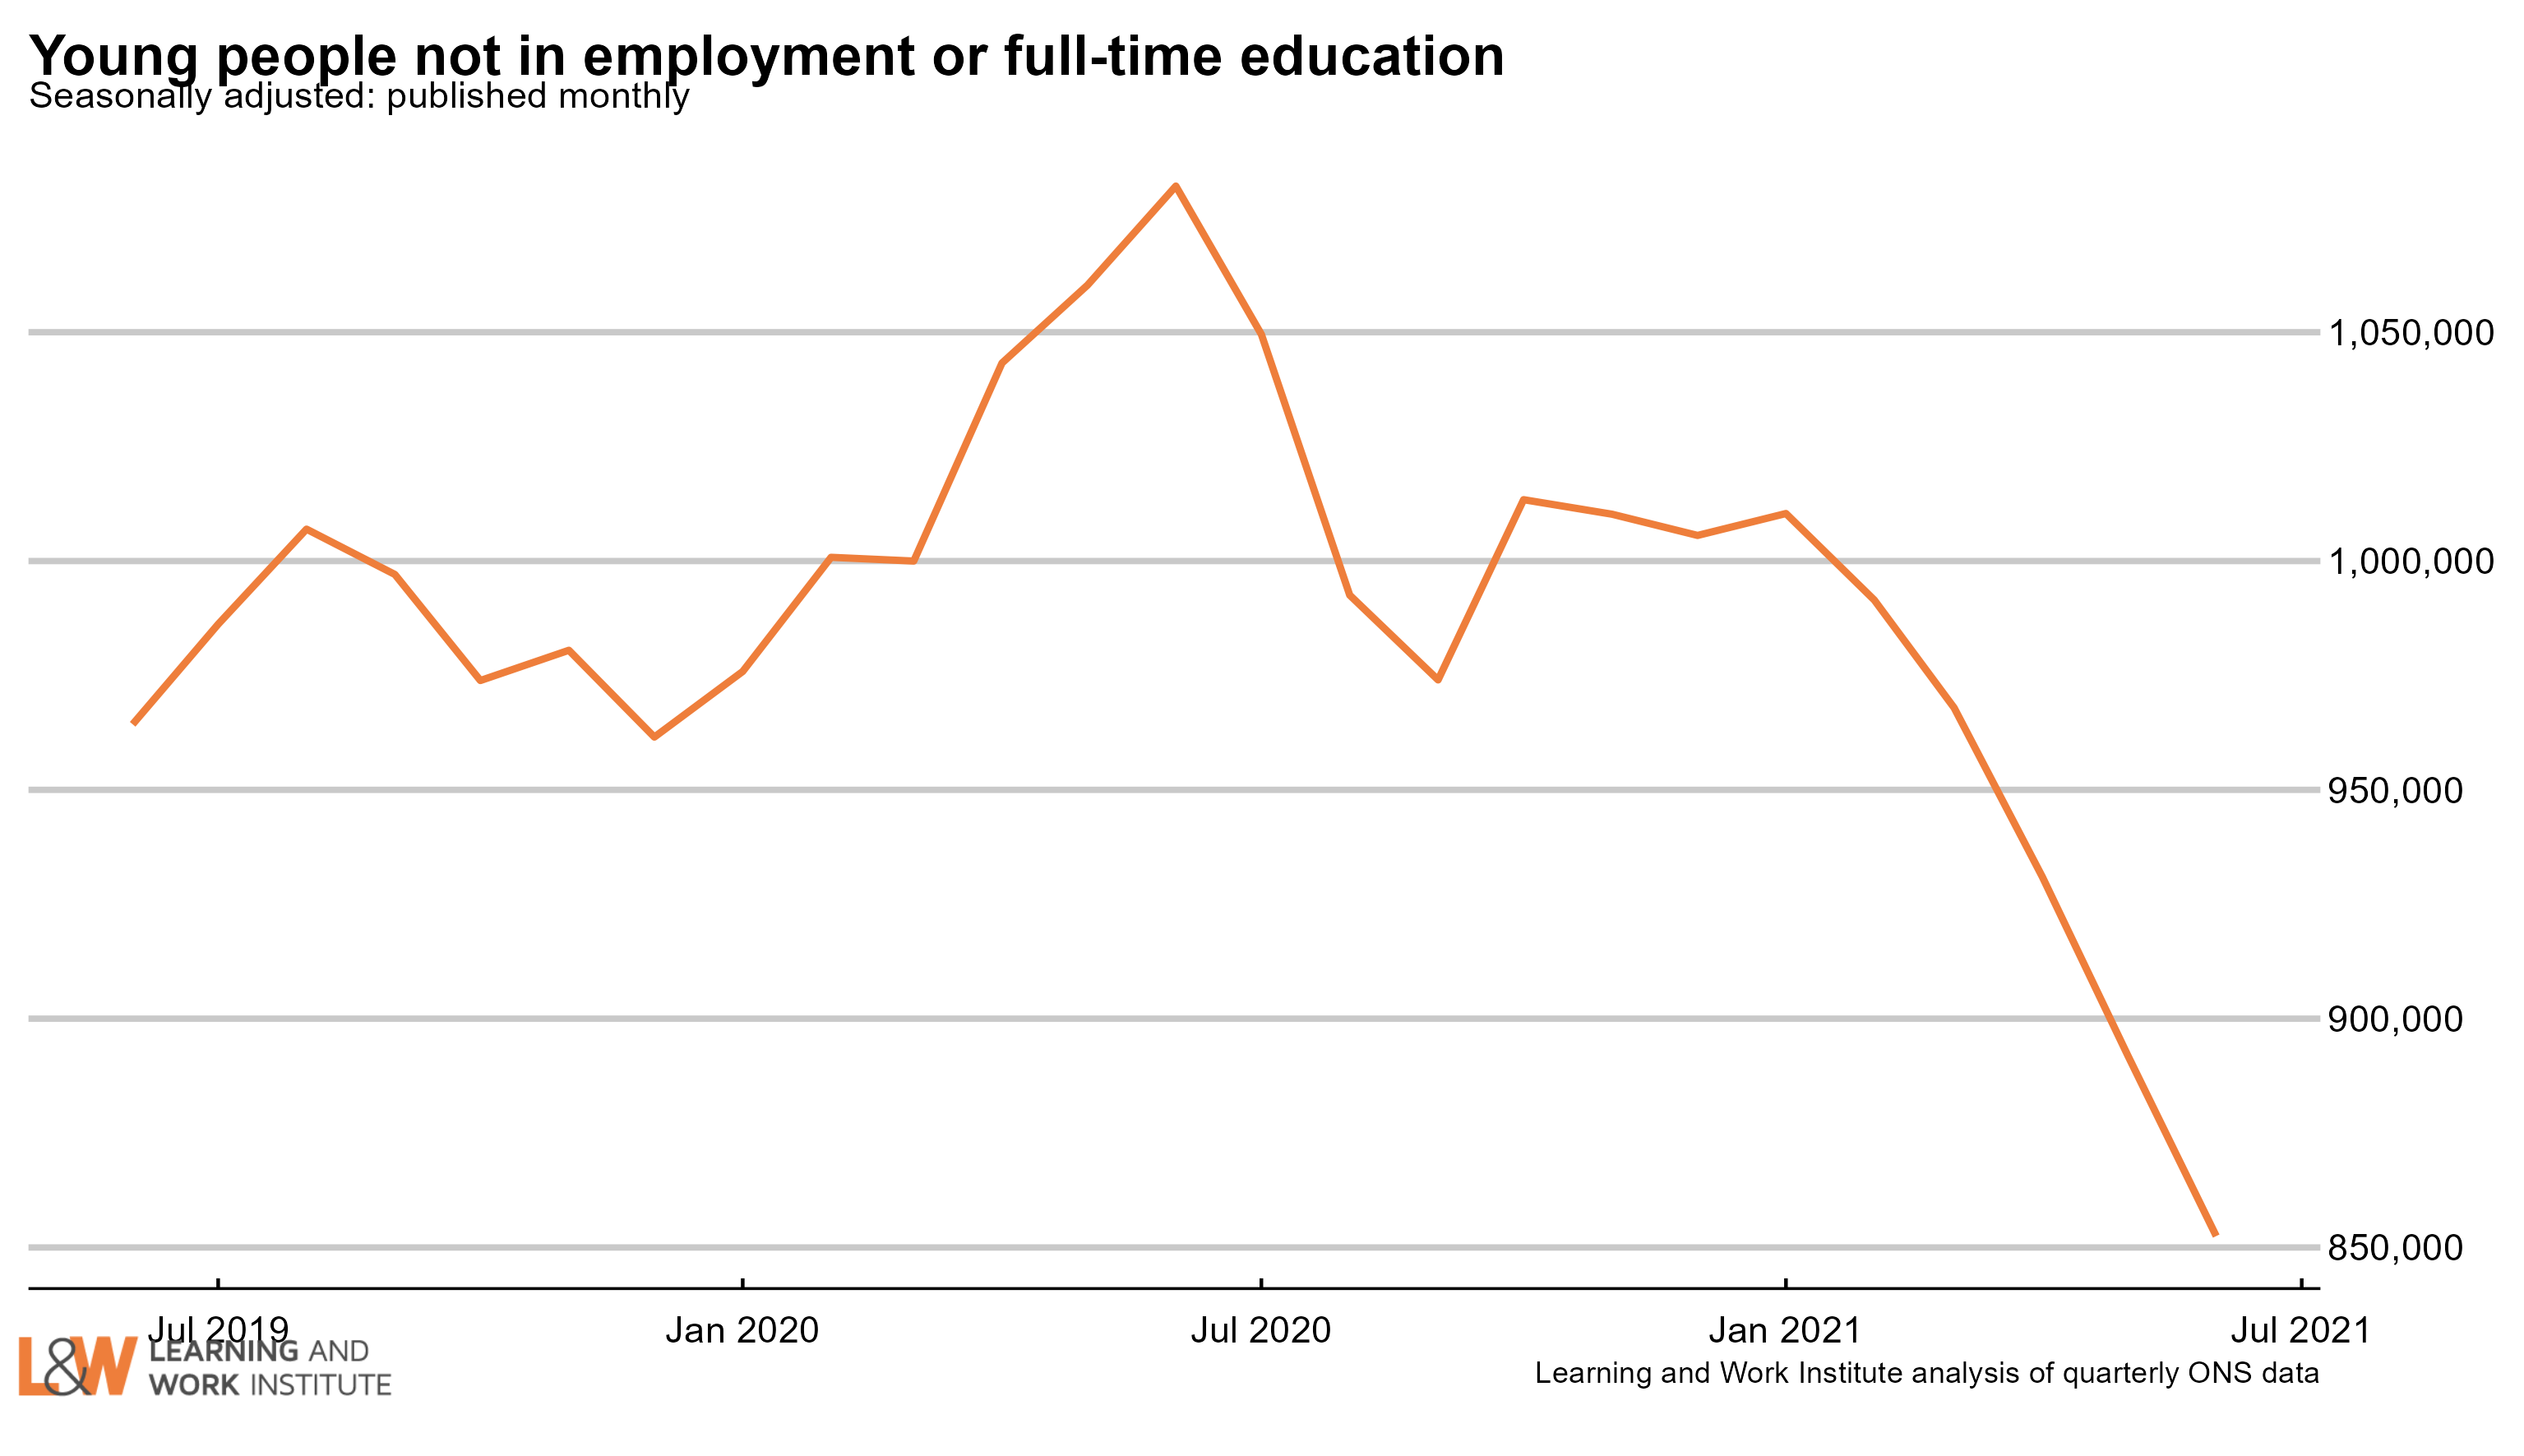
Chart 4: Young people not in employment, full-time education or training
The number of out of work young people who are not in full-time education (852,000) fell by 115,000 or 11.9% in the last quarter. The fall was equally from the inactive and the unemployed young people not in full-time education or training.
 |
|
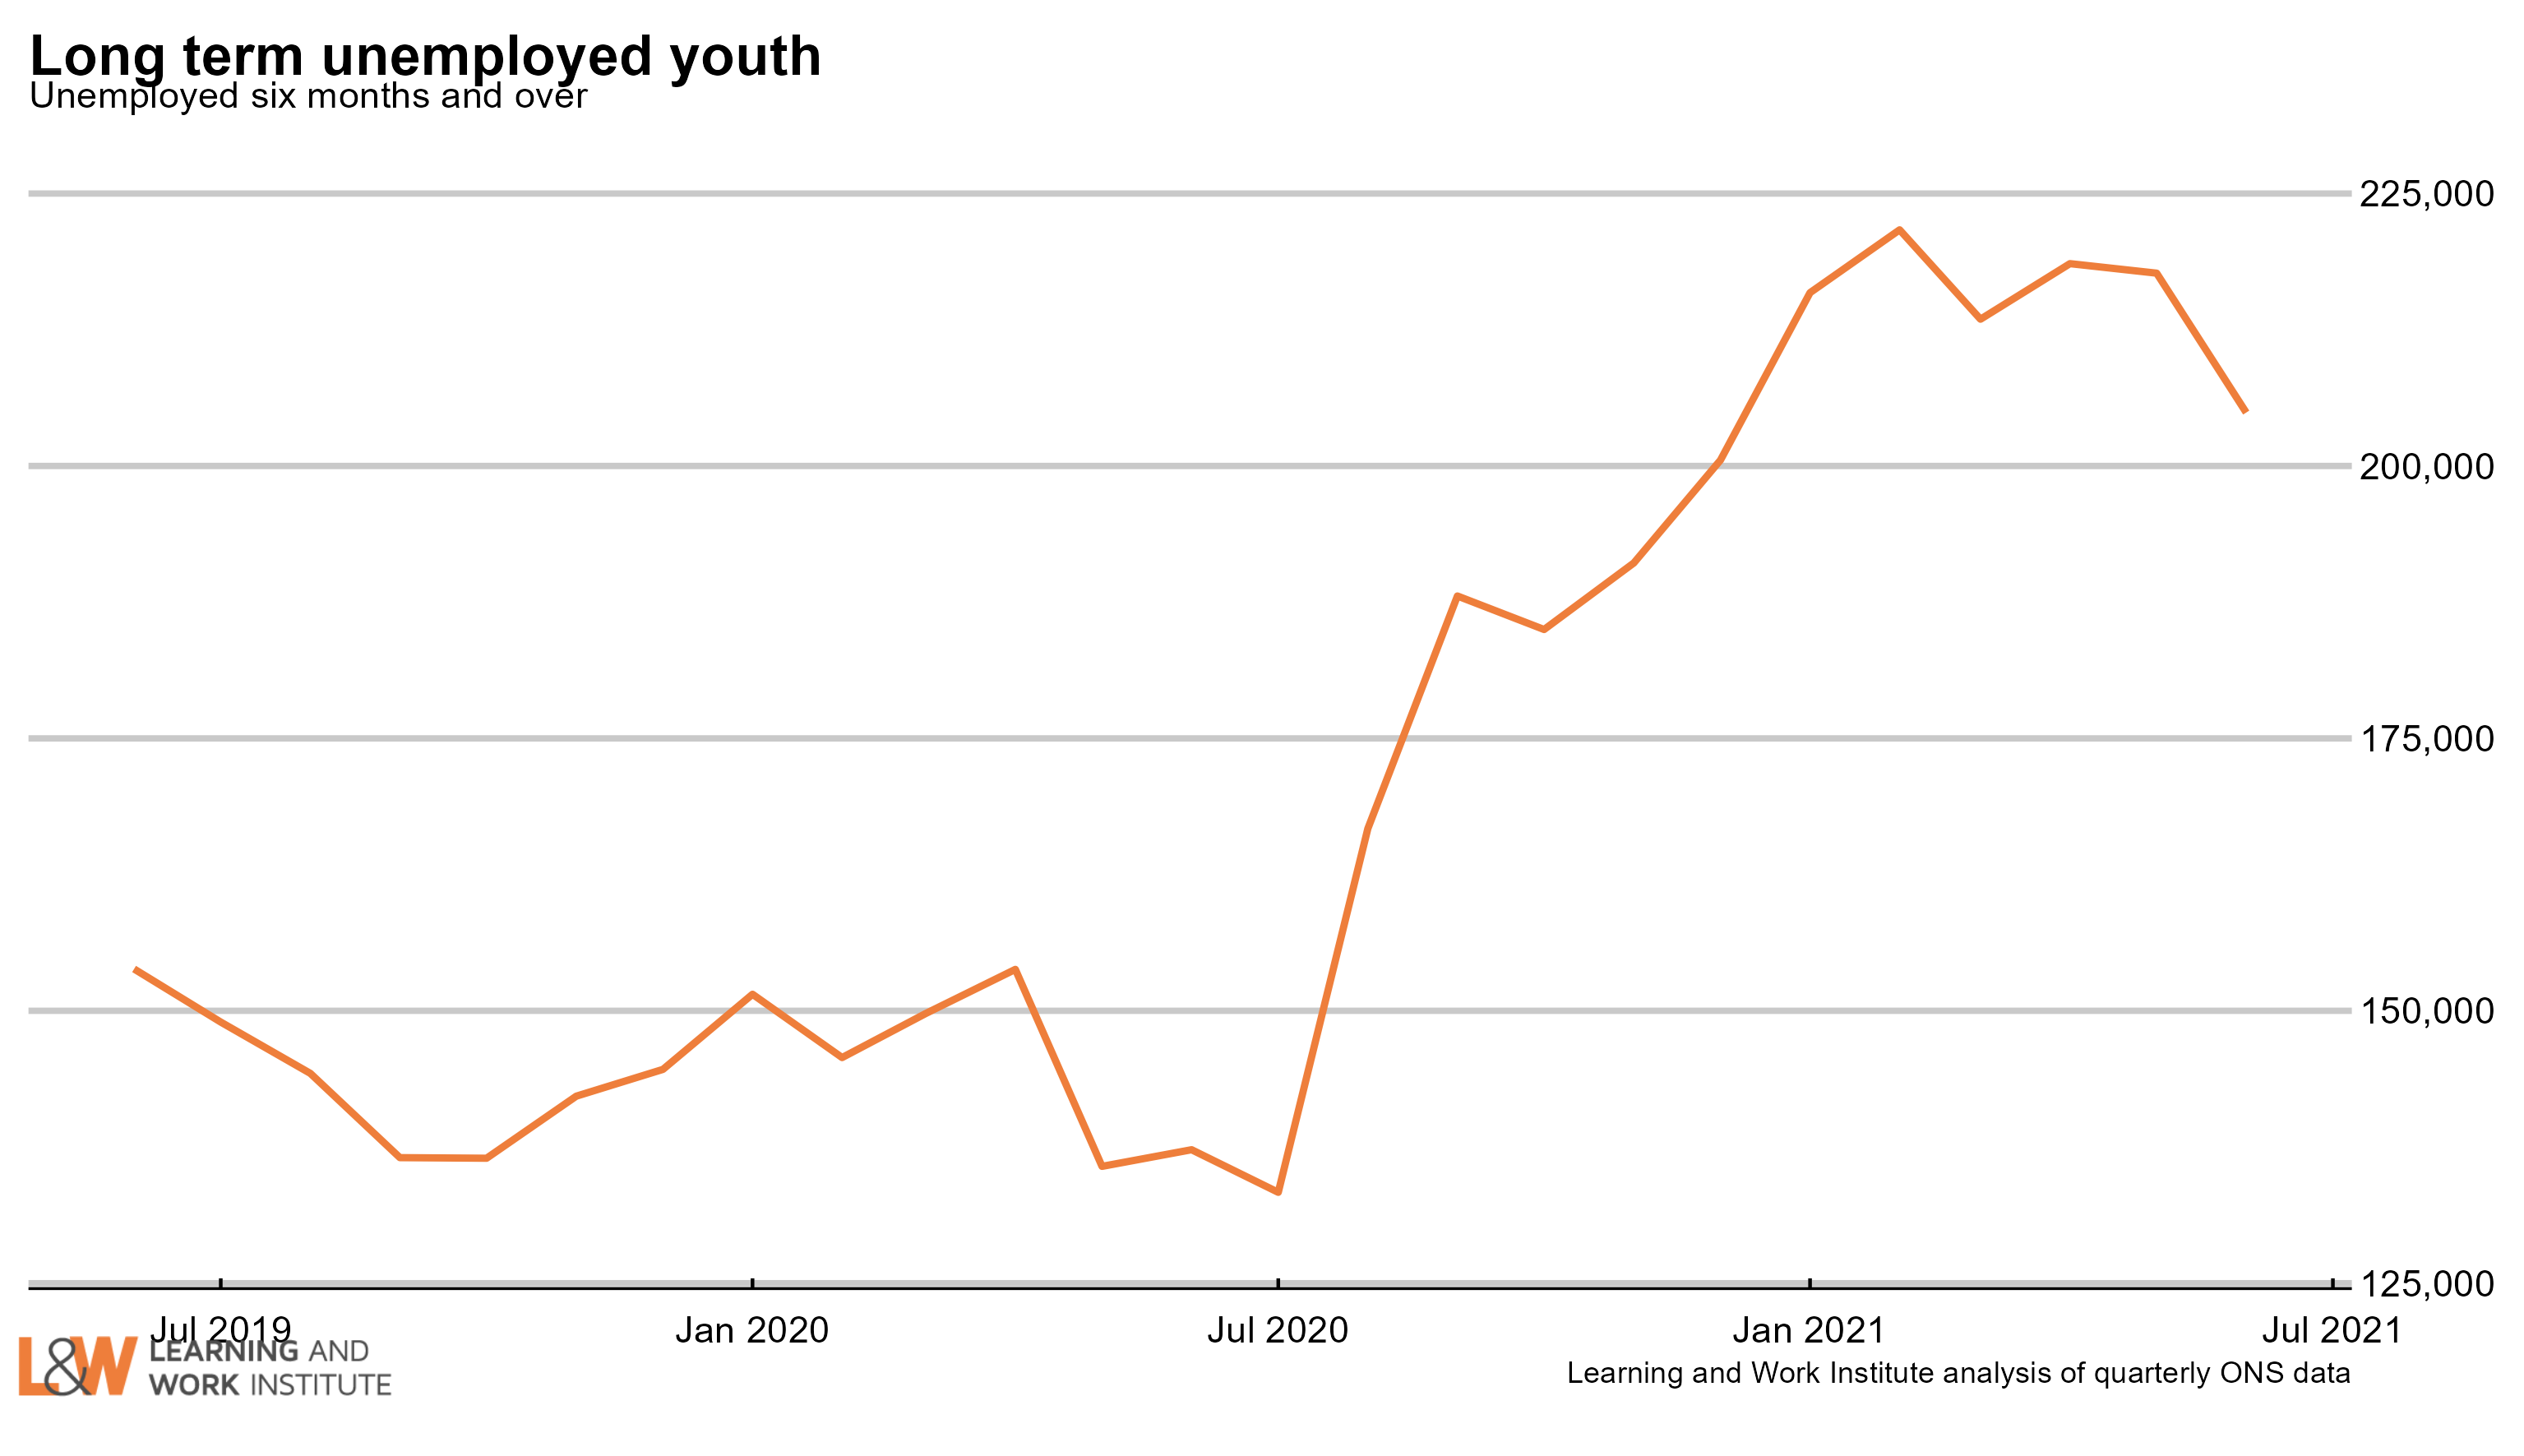
Chart 5: Youth long-term unemployment (six months and over, 18-24)
Youth long-term unemployment (which can include students) has fallen by 9,000 over the last quarter and is now 205,000. This is up 54,000 (44%) since the pandemic started.
 |
|
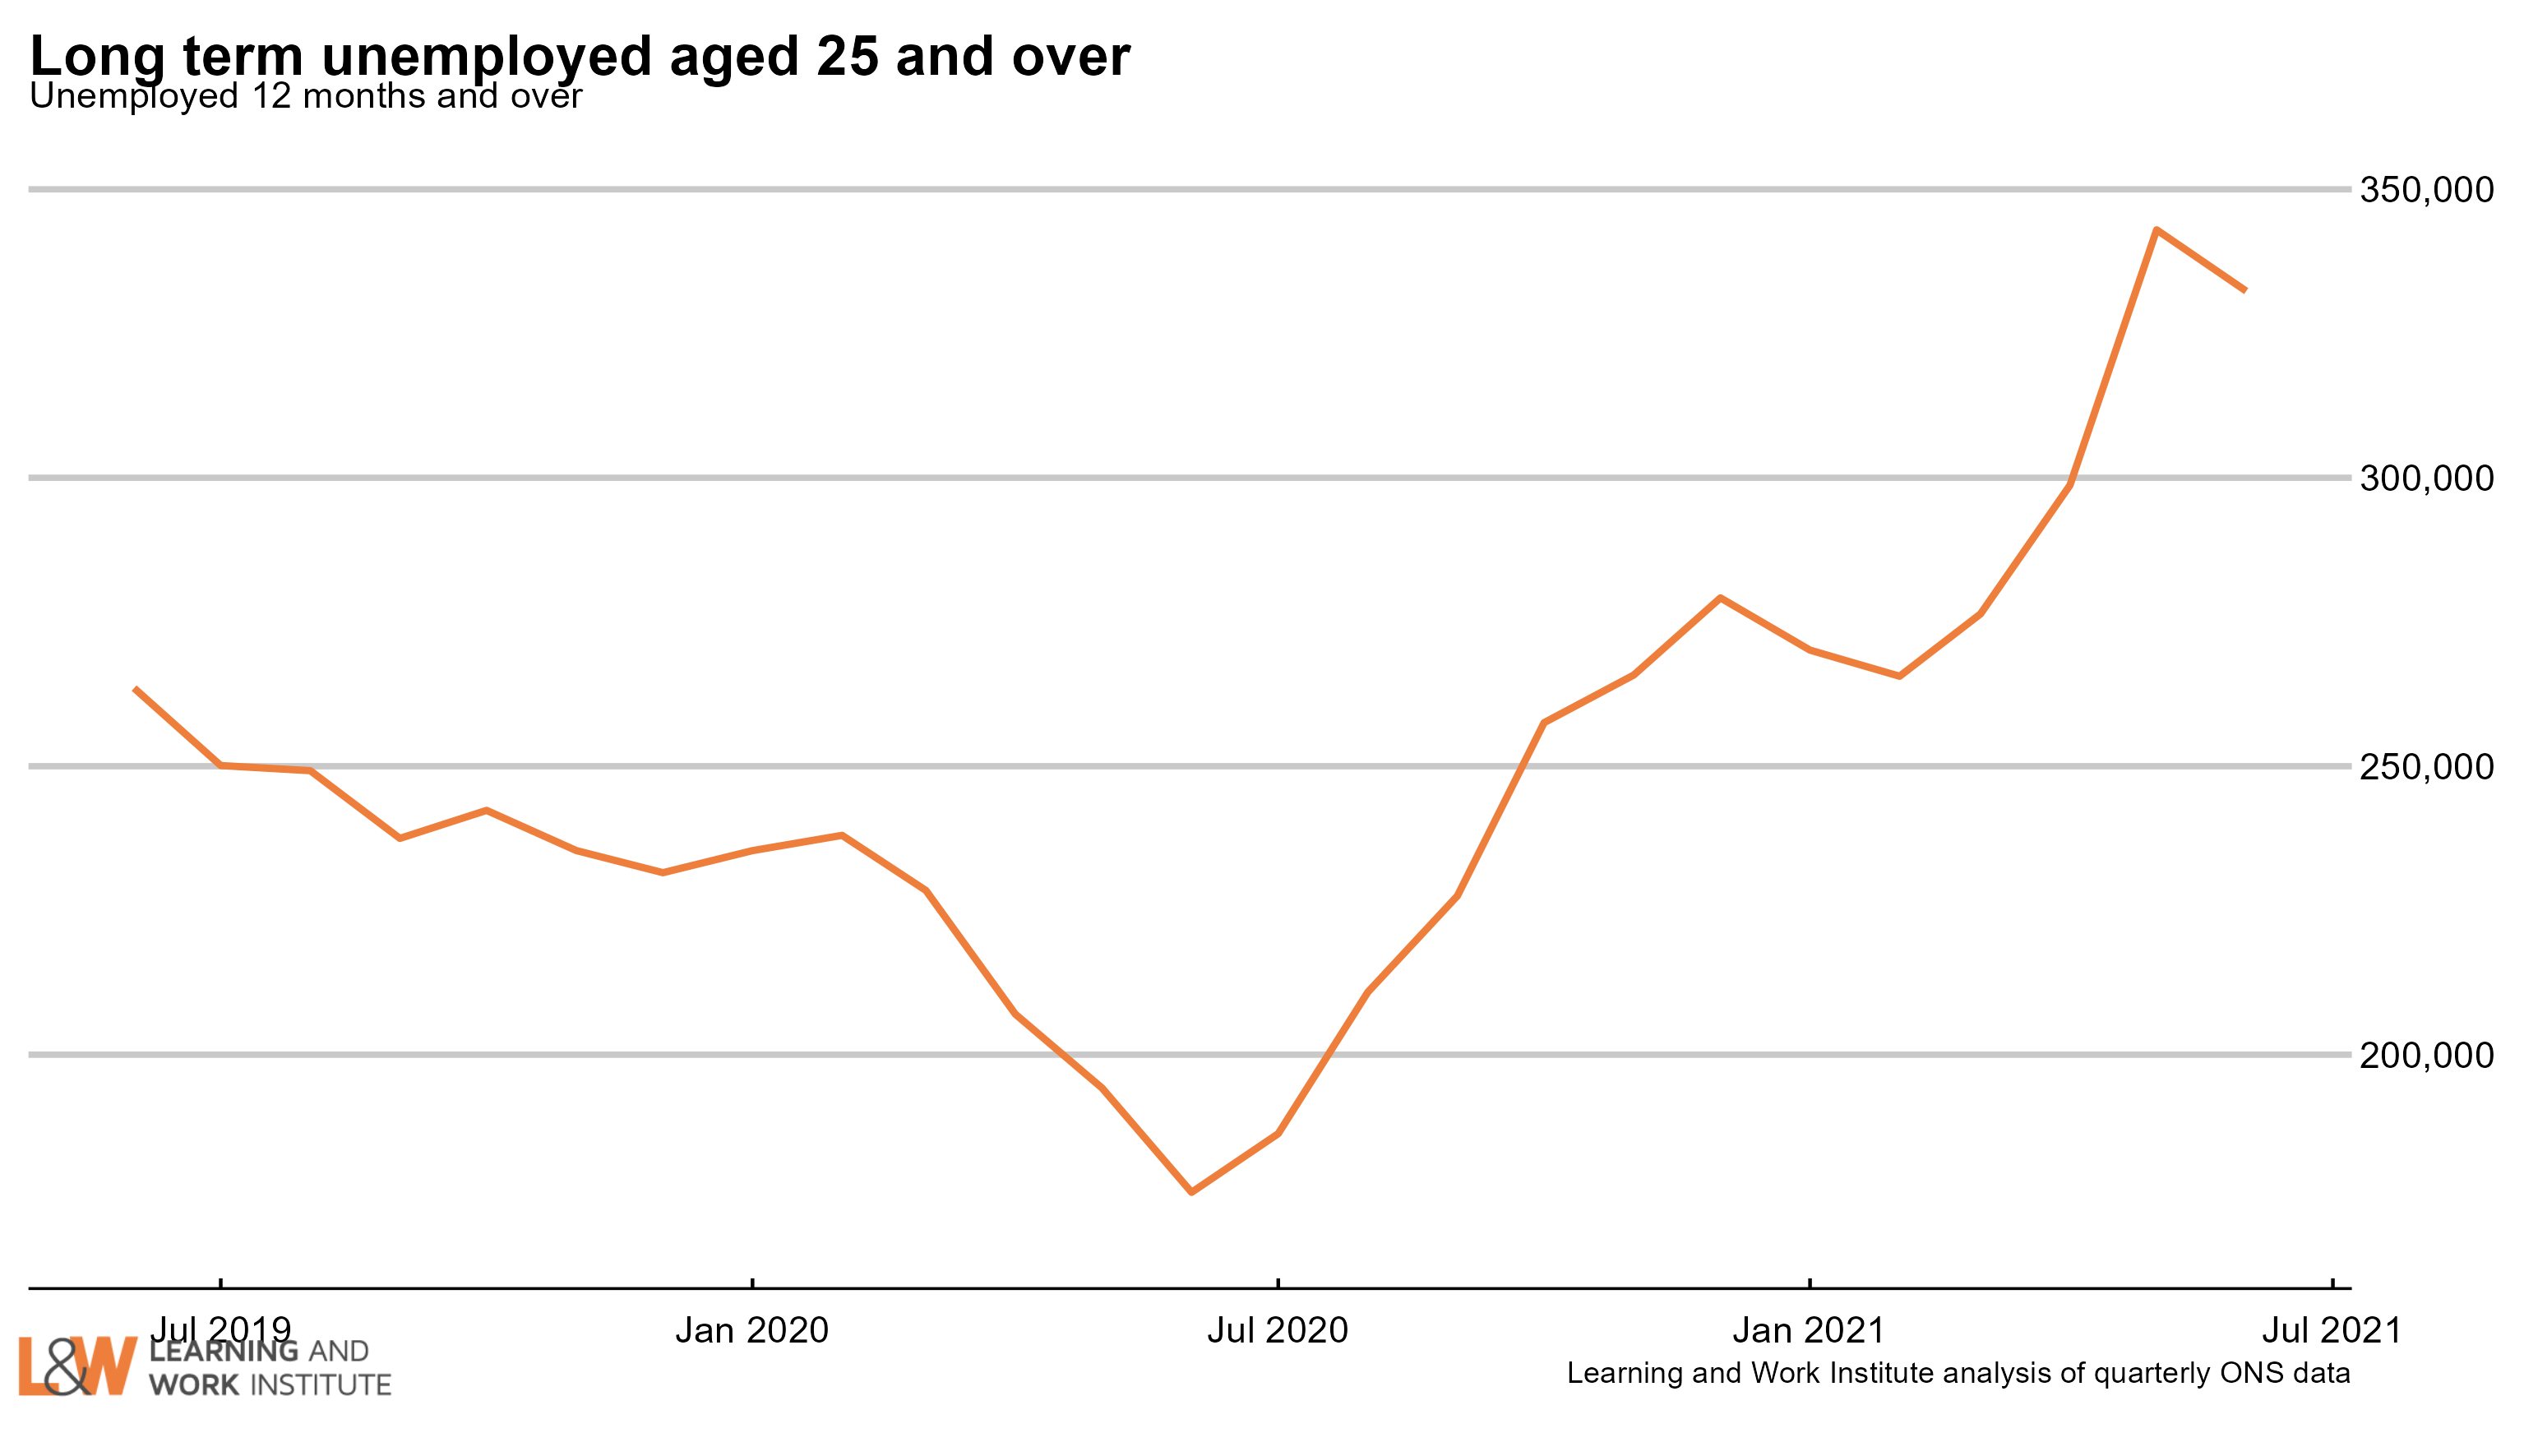
Chart 6: Adult long-term unemployment (12 months and over, 25+)
Adult long-term unemployment on the survey measure is now 332,000 and has risen 94,000 (40%) since the pandemic started (Dec 19-Feb 20).
 |
|
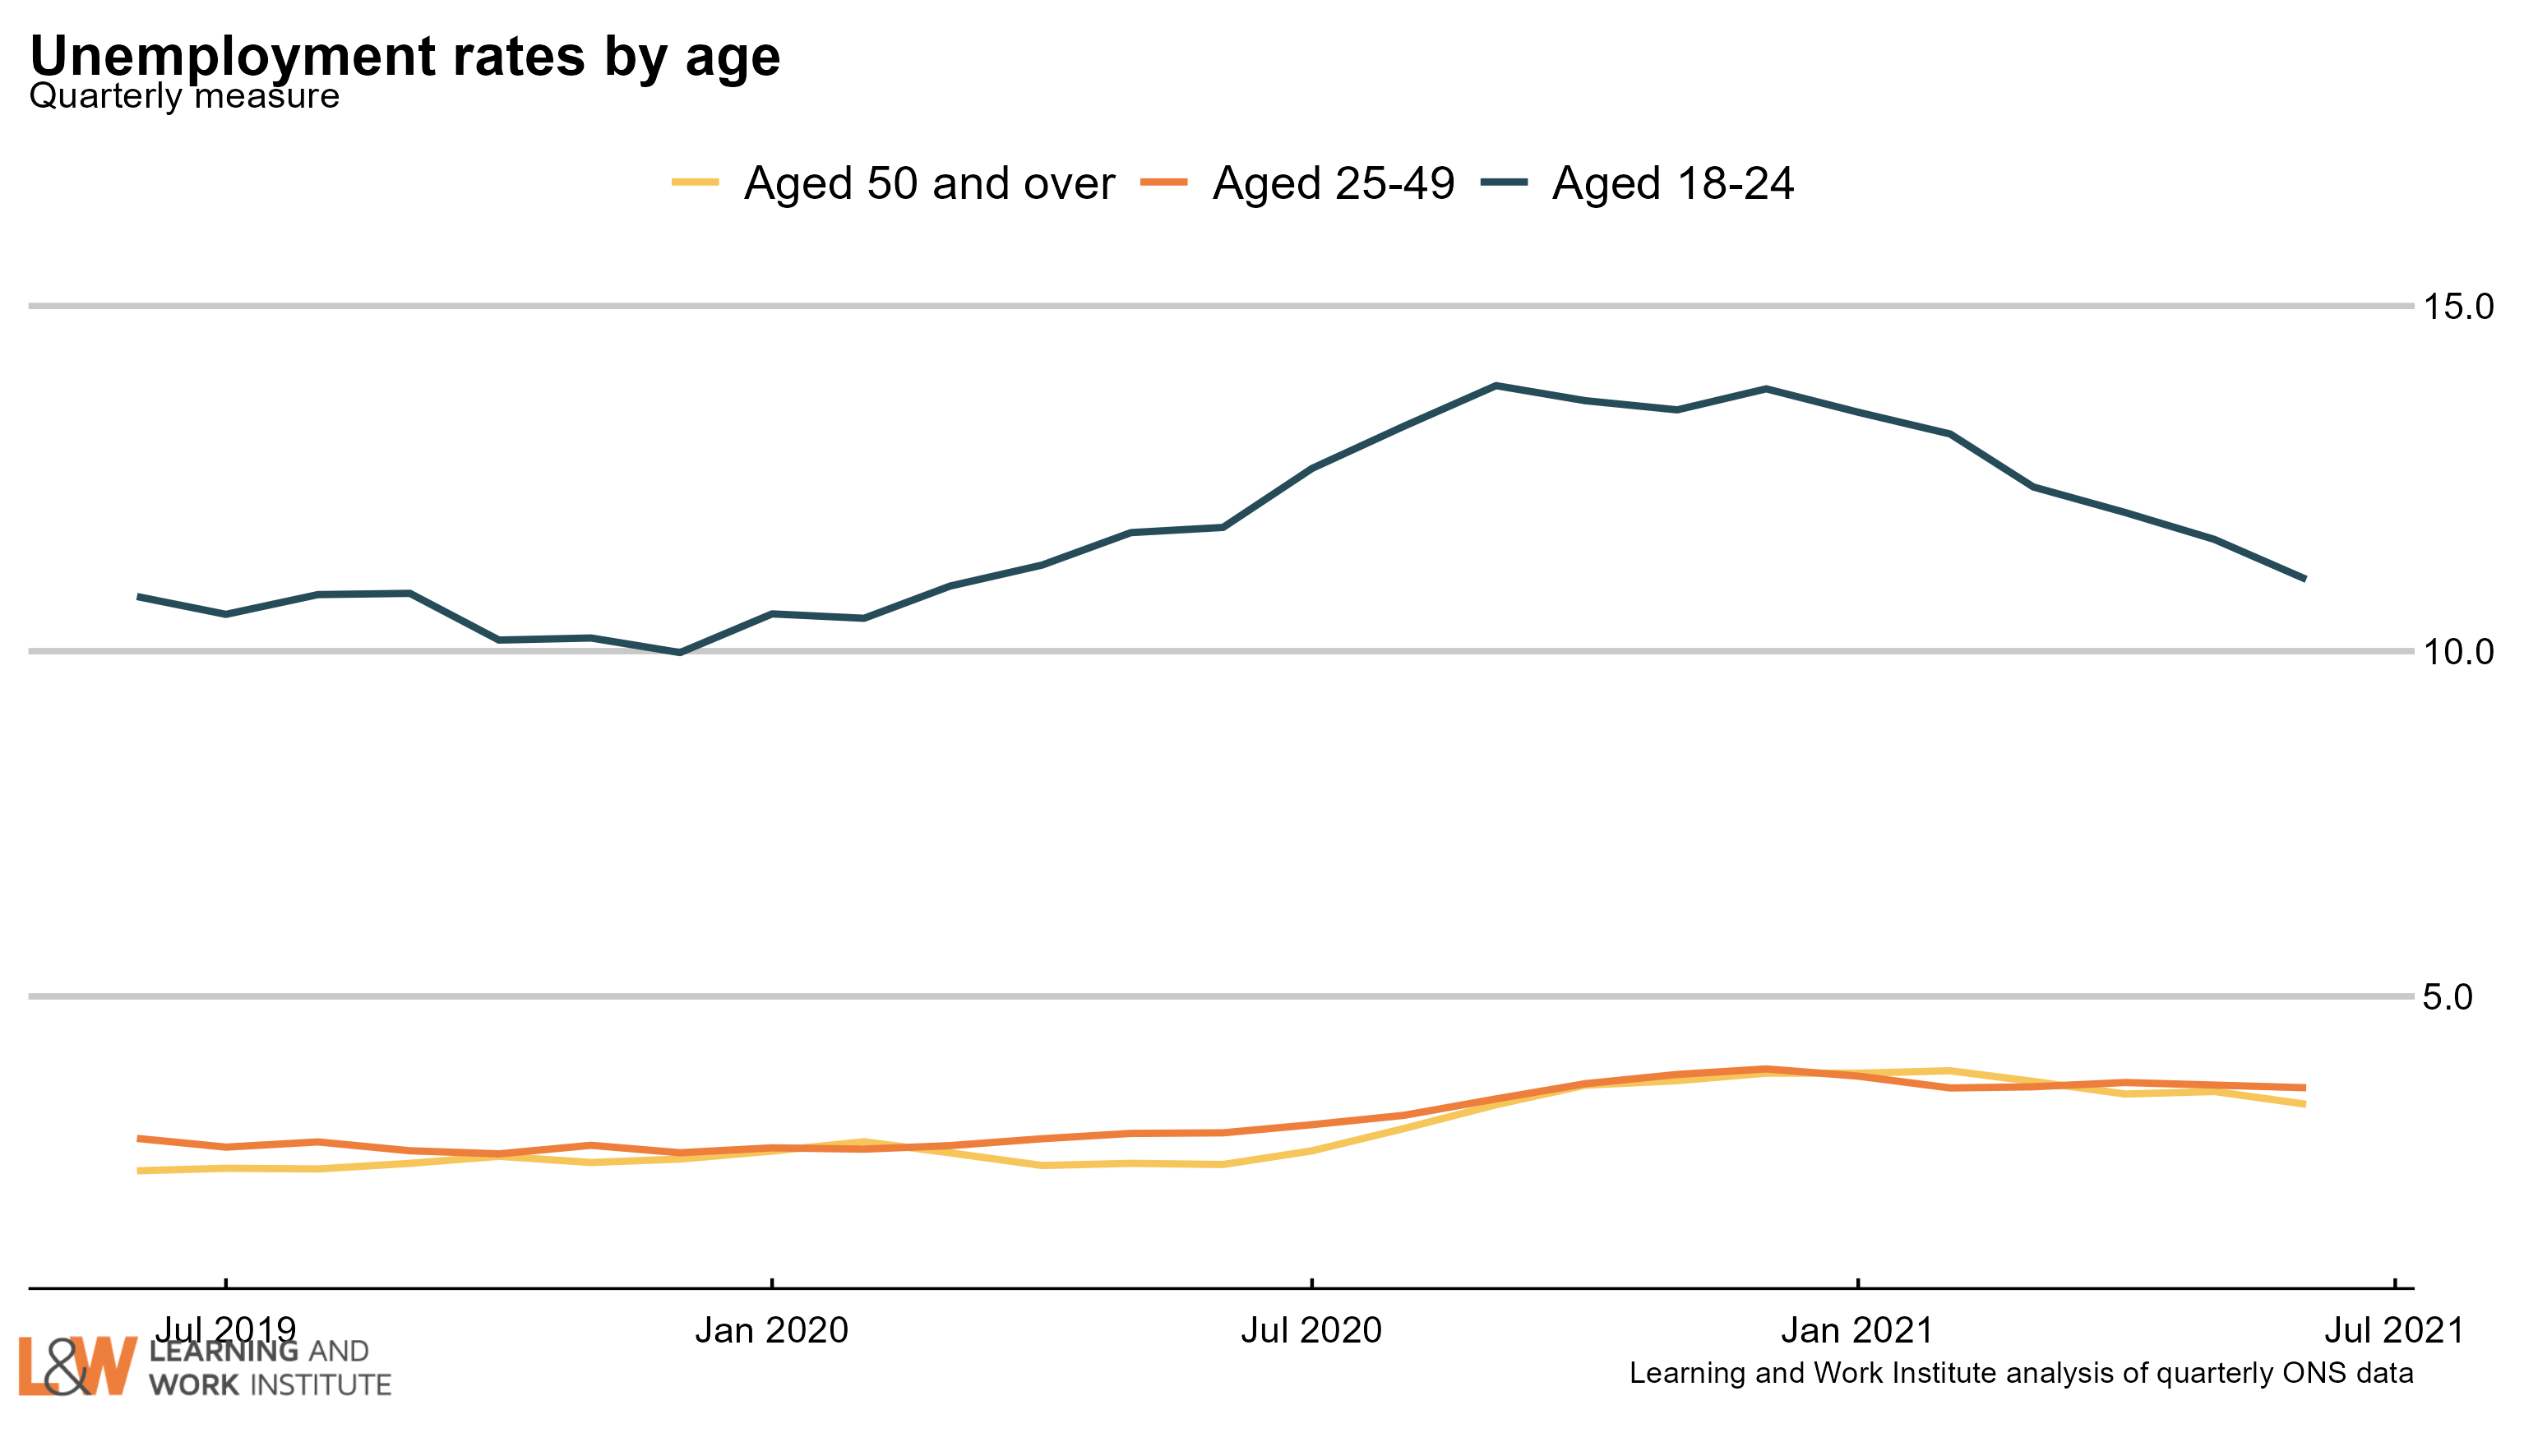
Chart 7: Unemployment rates by age
The 18 to 24 year old unemployment rate (including students) is 11.0% of the economically active – excluding one million economically inactive students from the calculation. The rate for those aged 25 to 49 is 3.7%. For those aged 50 and over it is 3.4%. The quarterly change is down 1.3 percentage points for 18 to 24 year olds, no change for 25 to 49 year olds, and down 0.3 percentage points for the over-50s.
 |
|
Chart 8: Unemployment rate changes by age (counting February 2020 as 100)
The 18 to 24 year old unemployment rate (including students) is 0.6 percentage points higher than in February 2020. The change for those aged 25 to 34 is 0.9. The change for those aged 35 to 49 is 0.9. The change for those aged 50 to 64 is 0.6 The change for those aged over 65 is 0.4.

Chart 9: Vacancies – whole economy survey
Headline vacancies this month increased by 87,000 to 953,000. The ONS' experimental single-month vacancy figures increased by 273,000 In the last quarter to 1.034 million. The headline ONS vacancy figure is both seasonally adjusted and a three-month average. The chart shows both series. 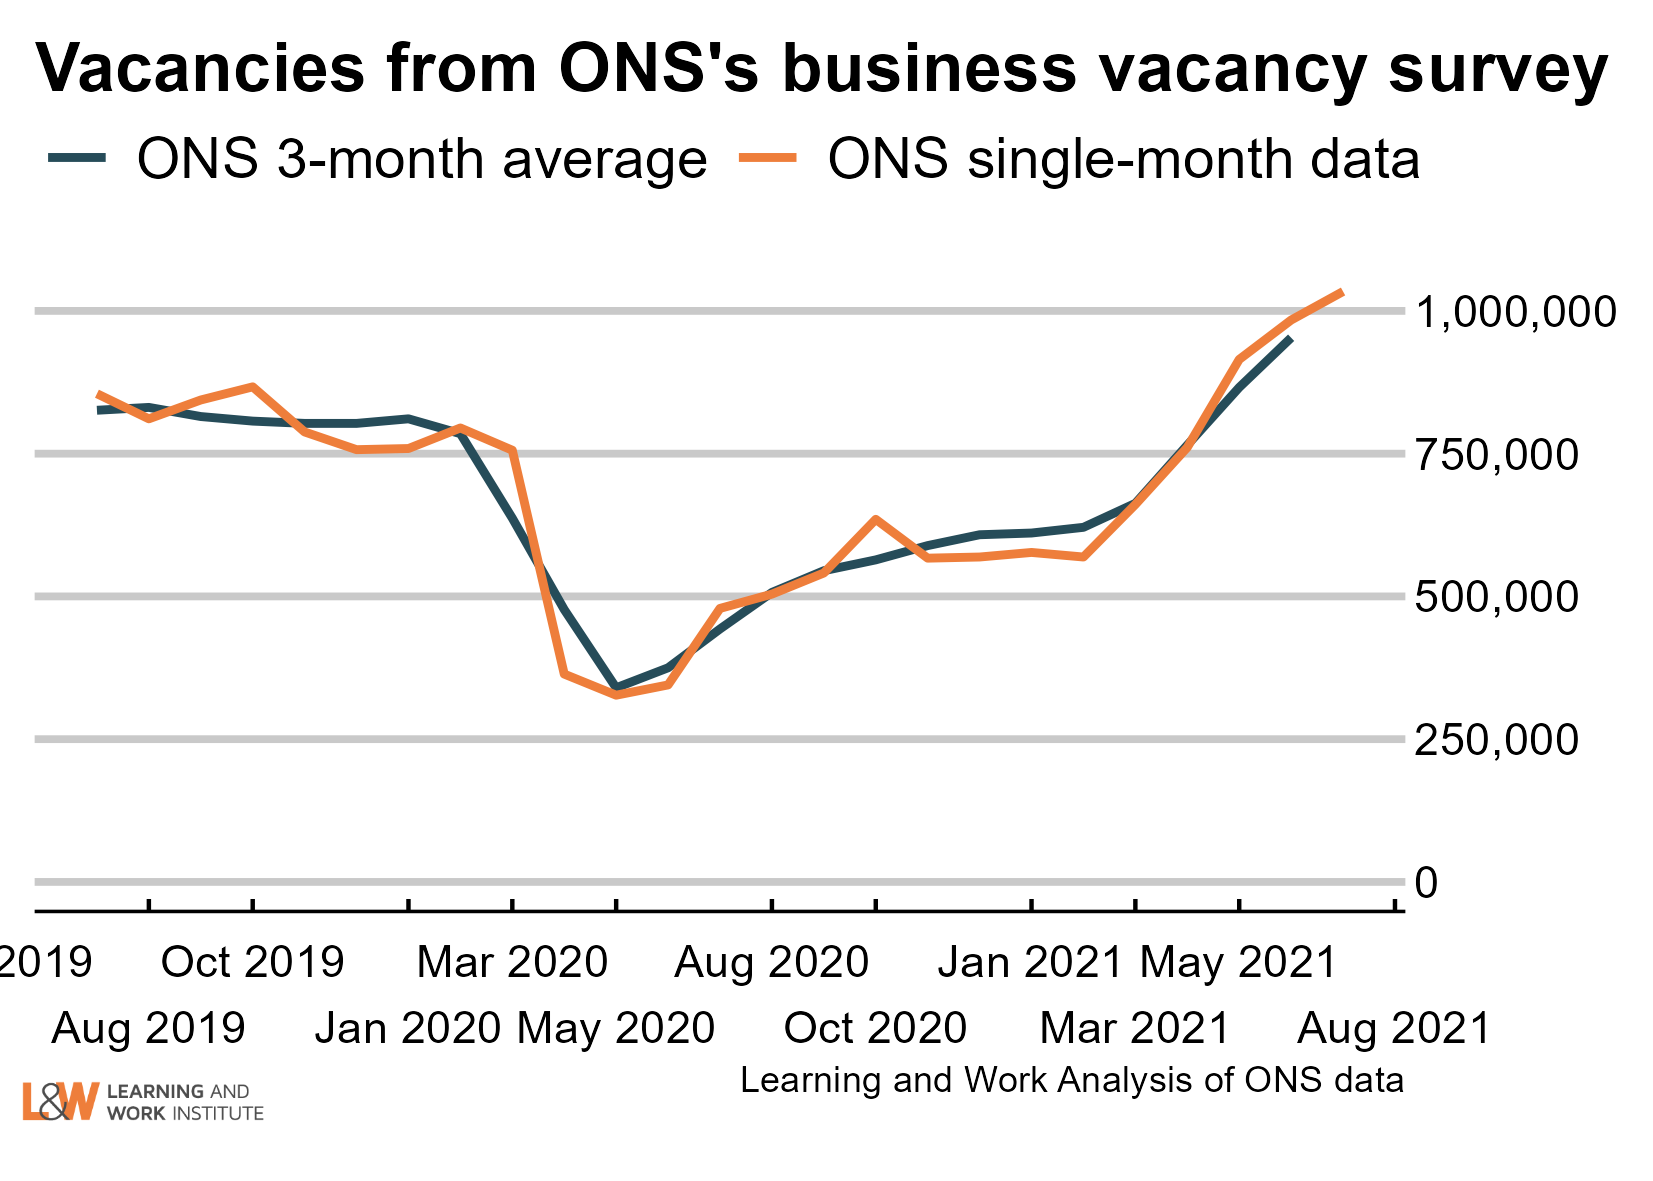 |
|
Chart 10: Experimental single month vacancies – whole economy survey - change since 2019
The Office for National Statistics' experimental single month vacancy estimates include sectoral information. Here, we show the changes on the same month two years ago, before the pandemic. The data is not seasonally adjusted, so comparisons with the same month each year are better. The numbers are thousands of vacancies, under each number, and on the right, the change in thousands of vacancies. 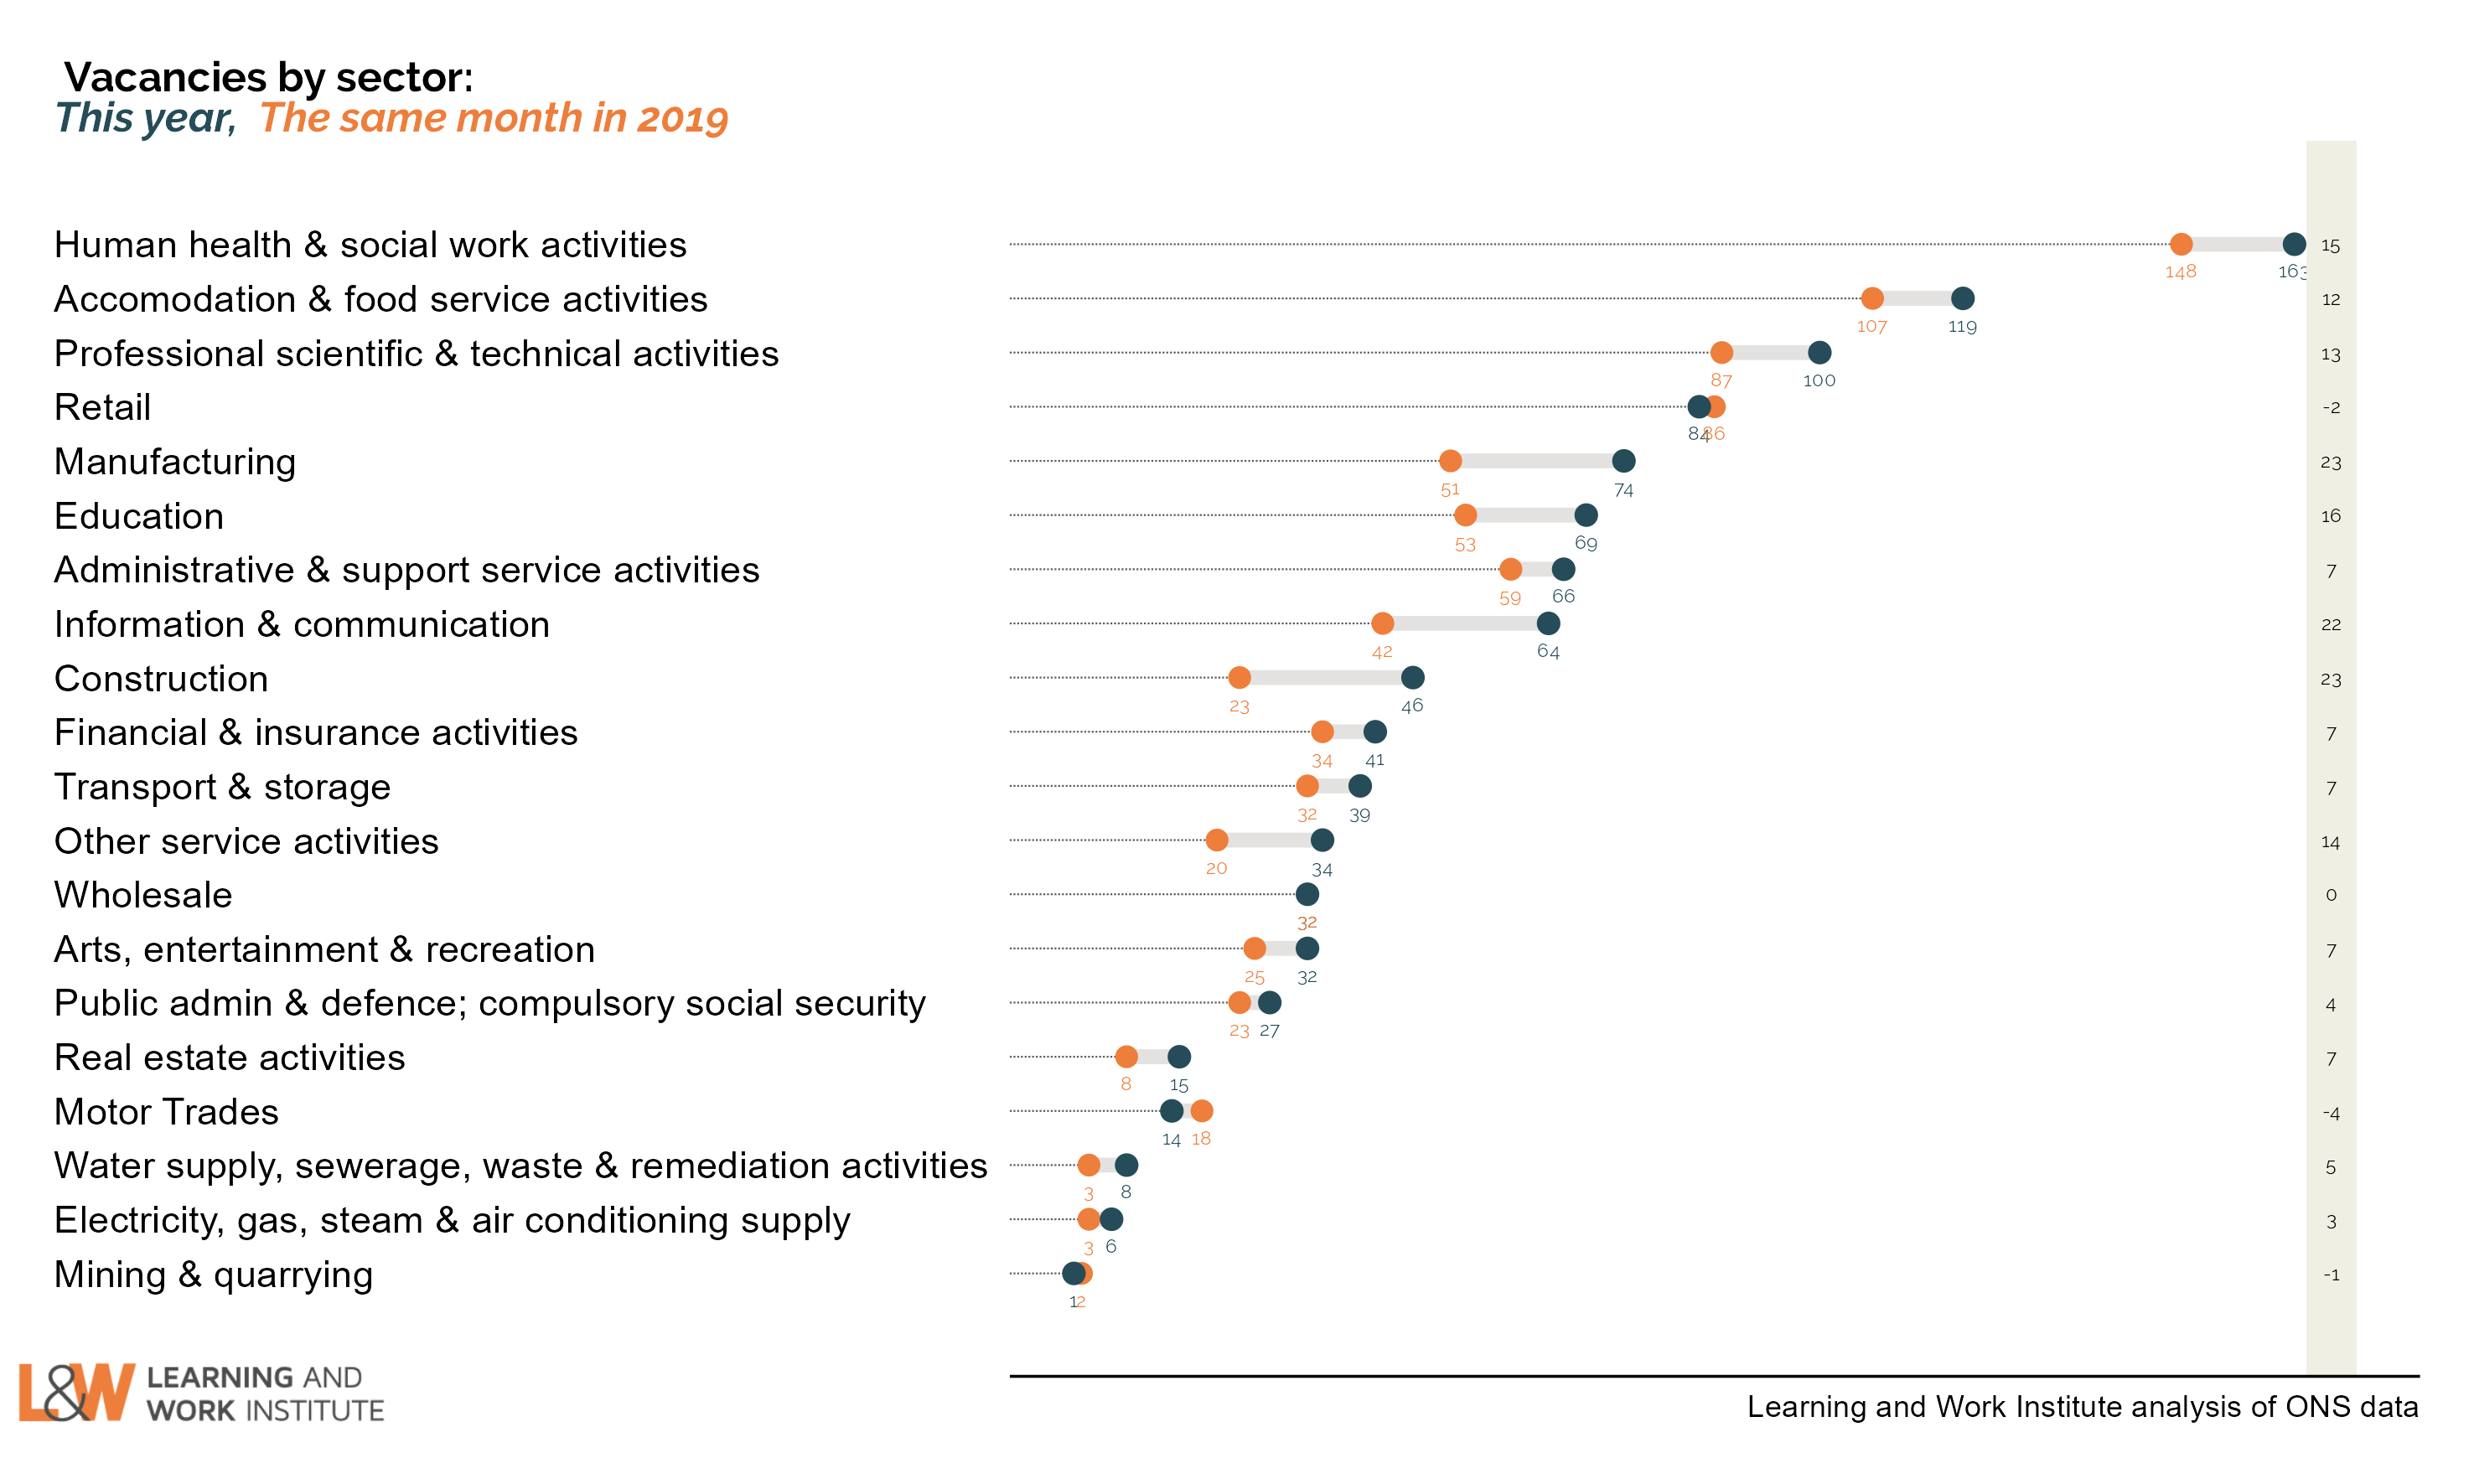 |
|
Chart 11: Unemployed people per vacancy
There are 1.8 unemployed people per vacancy. This has fallen back as the number of vacancies has risen, despite the high numbers of unemployed. 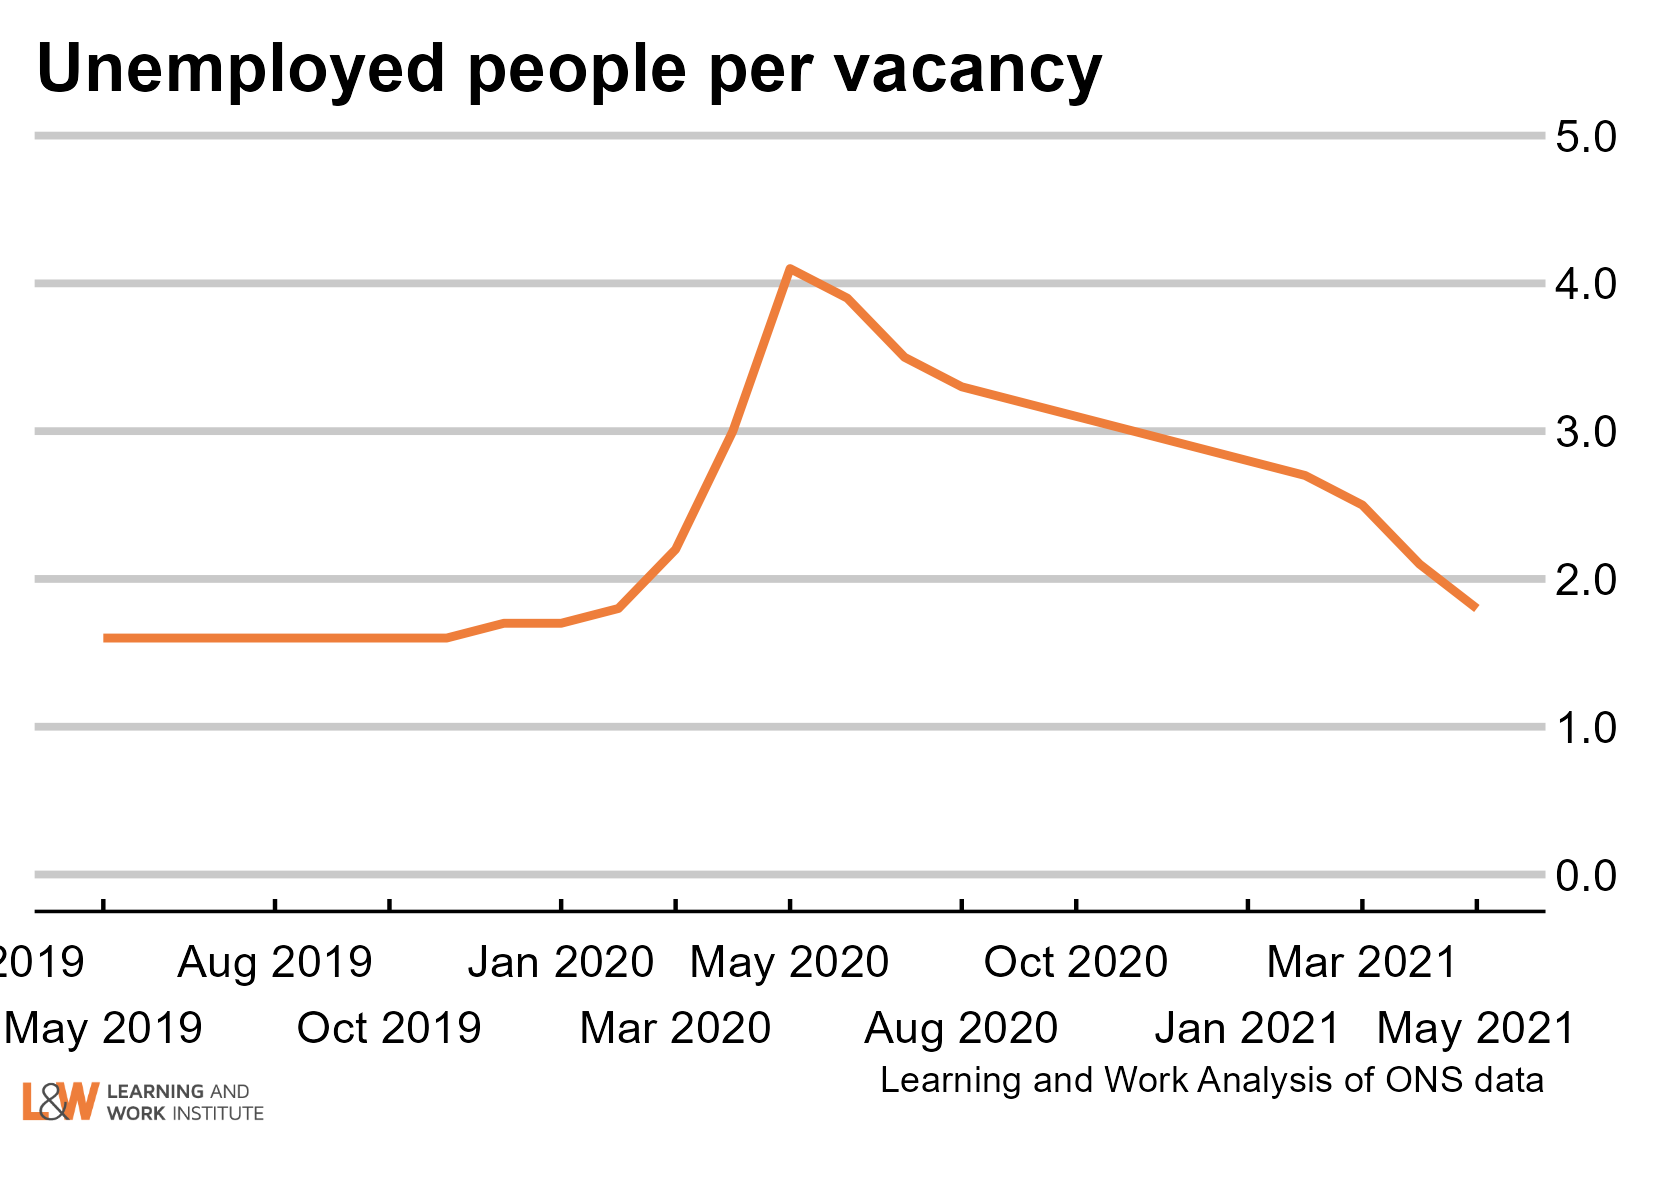 |
|
Chart 12: Online vacancies to early August from Adzuna
Job vacancies dropped to below half of February 2020 level following lockdown. There had been a substantial increase as the lockdown had eased, with the number of vacancies now being 129% of the February 2020 level. The figures are to the 6th August, and show a small fall on last week's levels and have increased modestly over the last month. 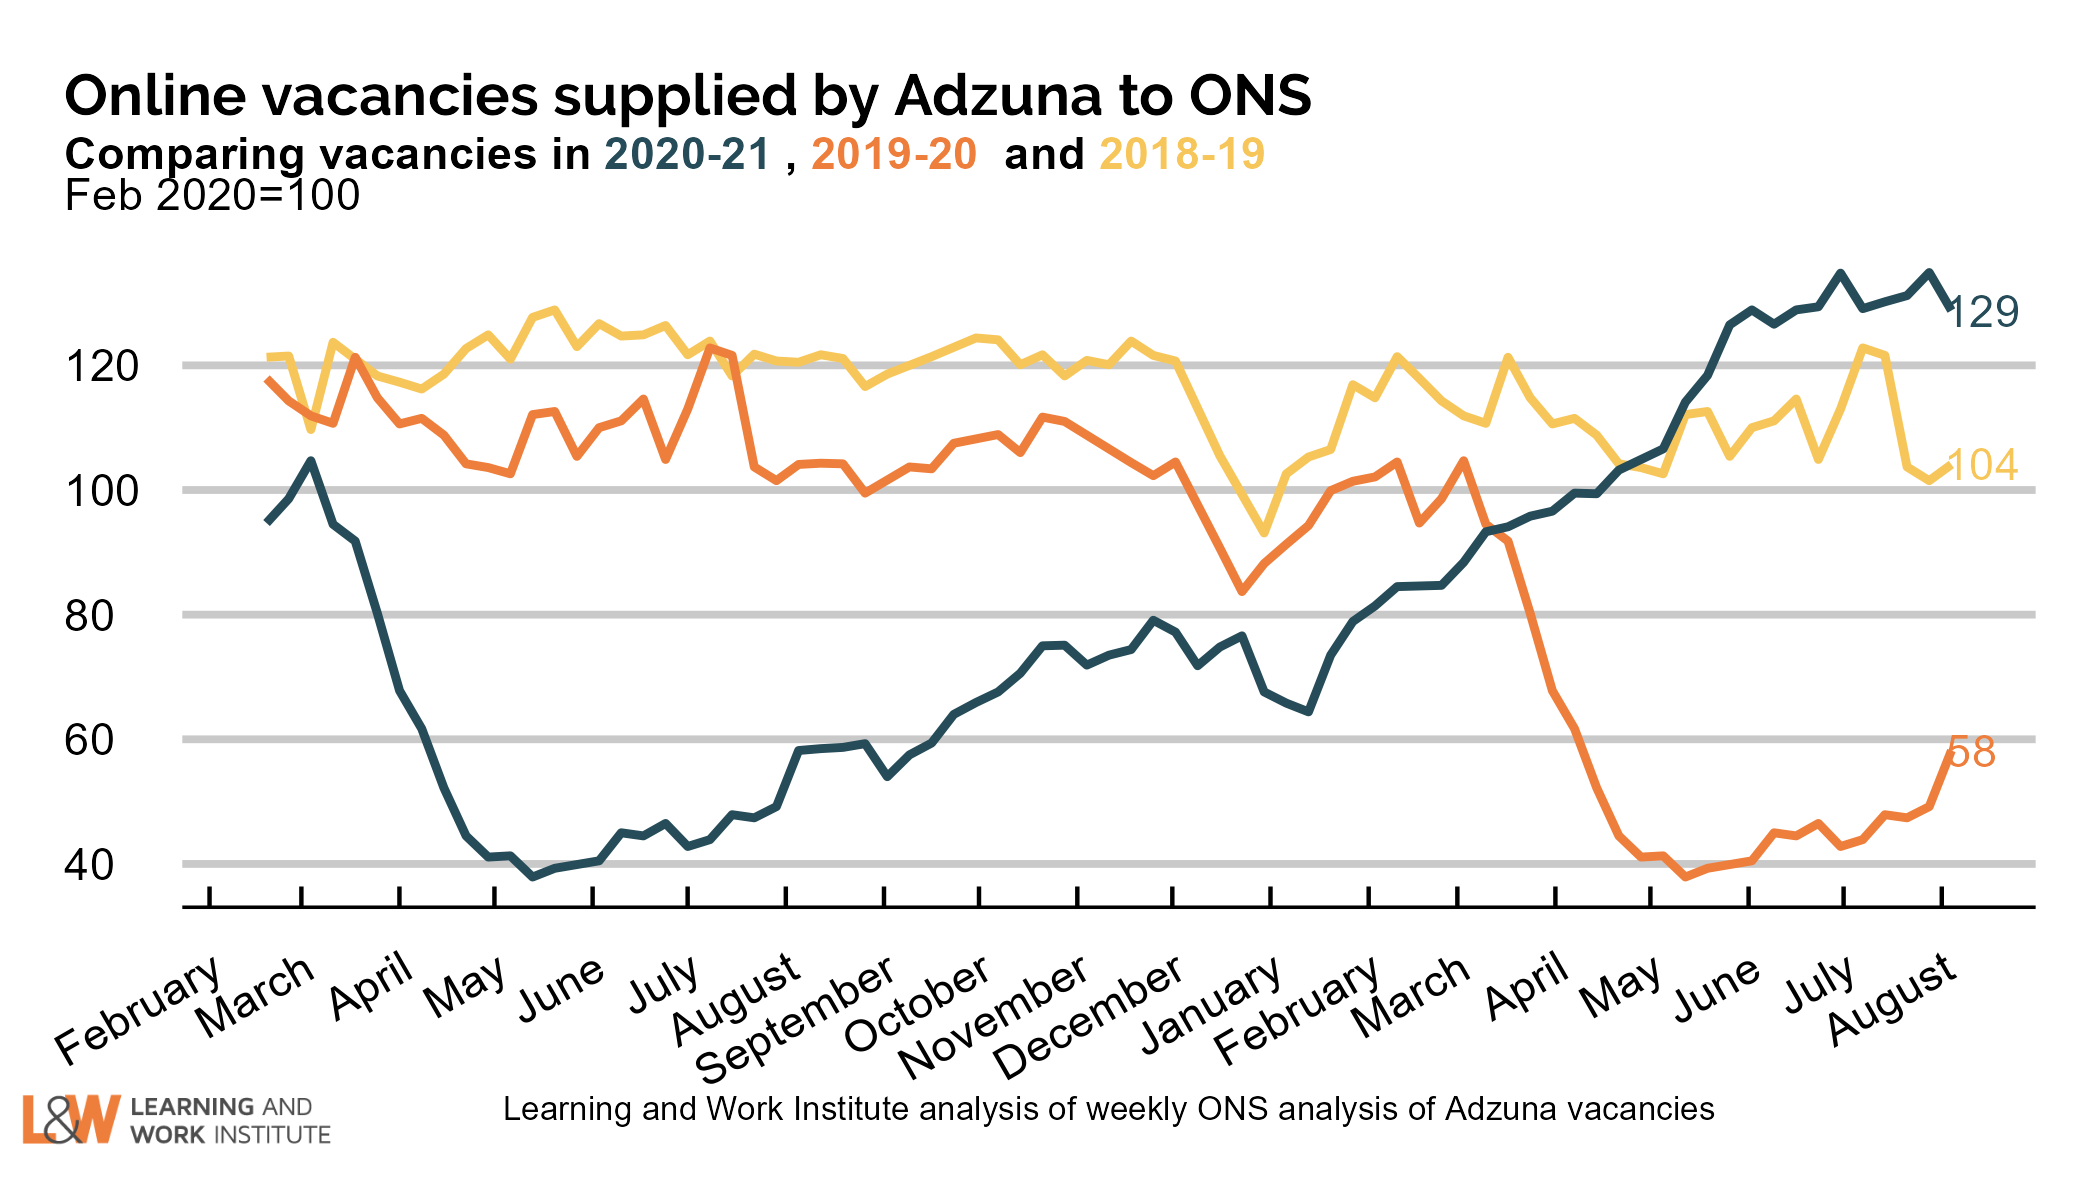 |
|
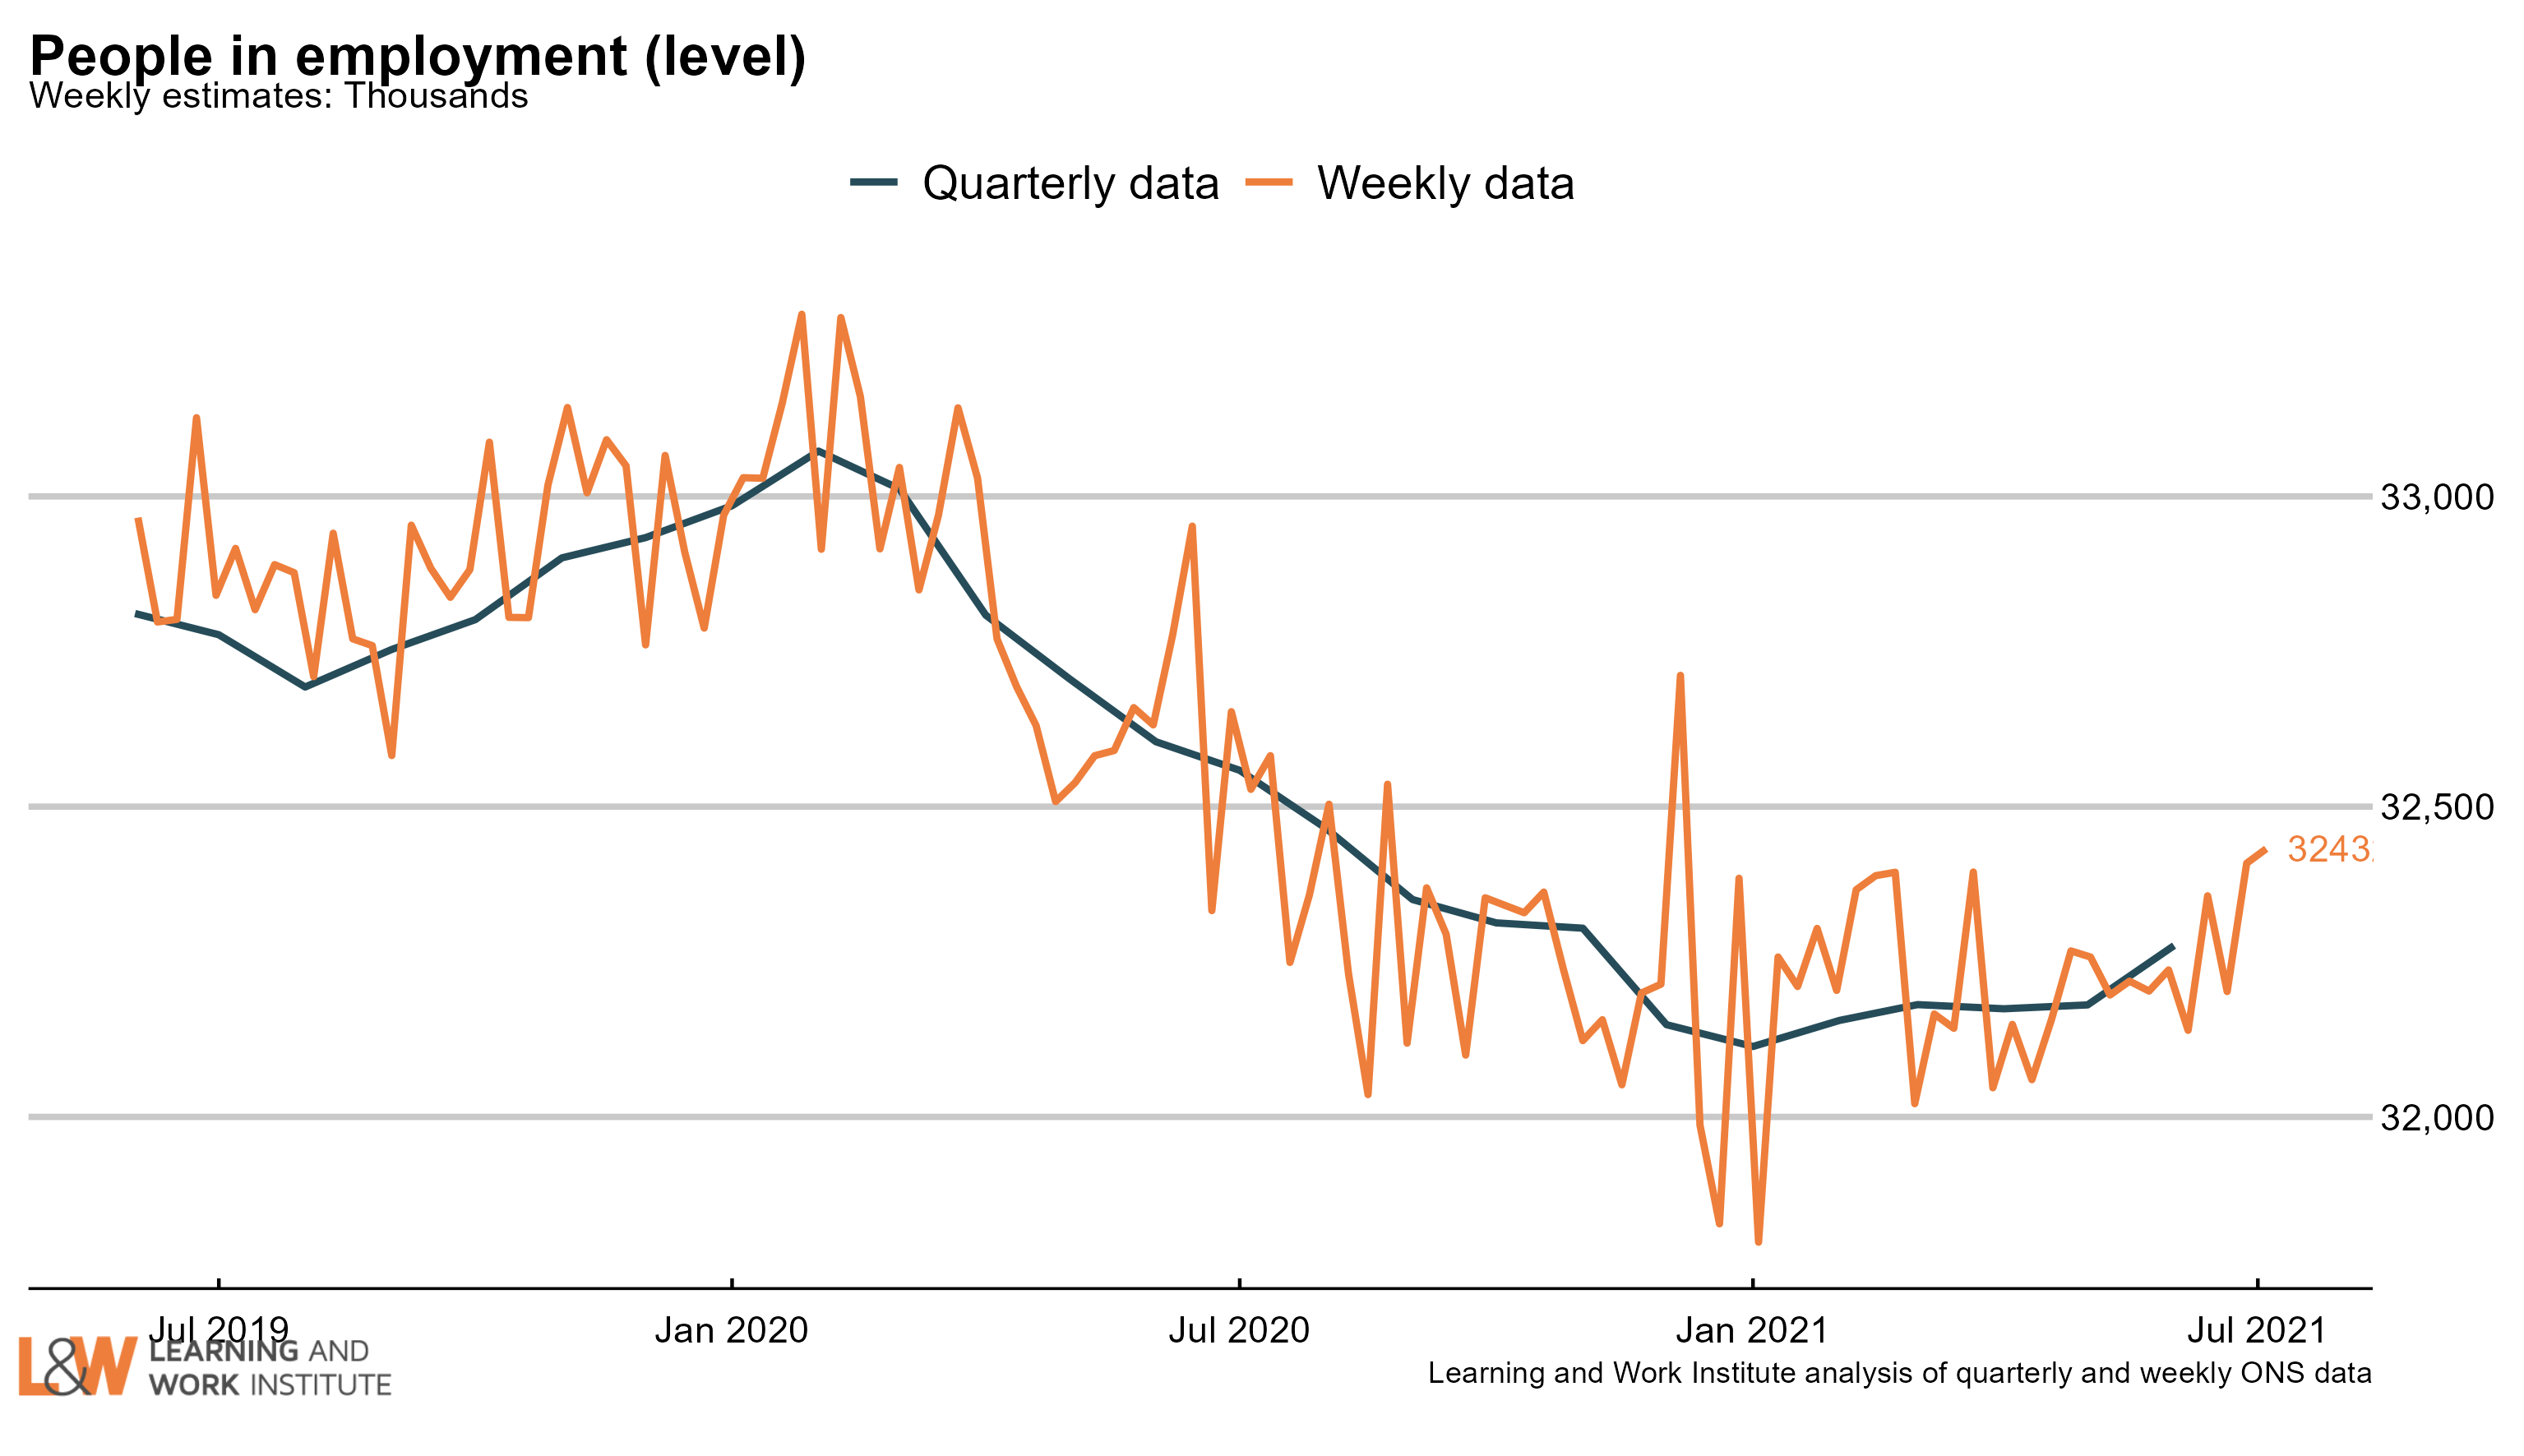
Chart 13: UK employment
Employment has risen by 96,000 on the figure published last month, to 32,276,000. The chart shows both the official figures and the experimental weekly figures. The trend is likely to be upwards, as is shown in the experimental weekly figures.
 |
|
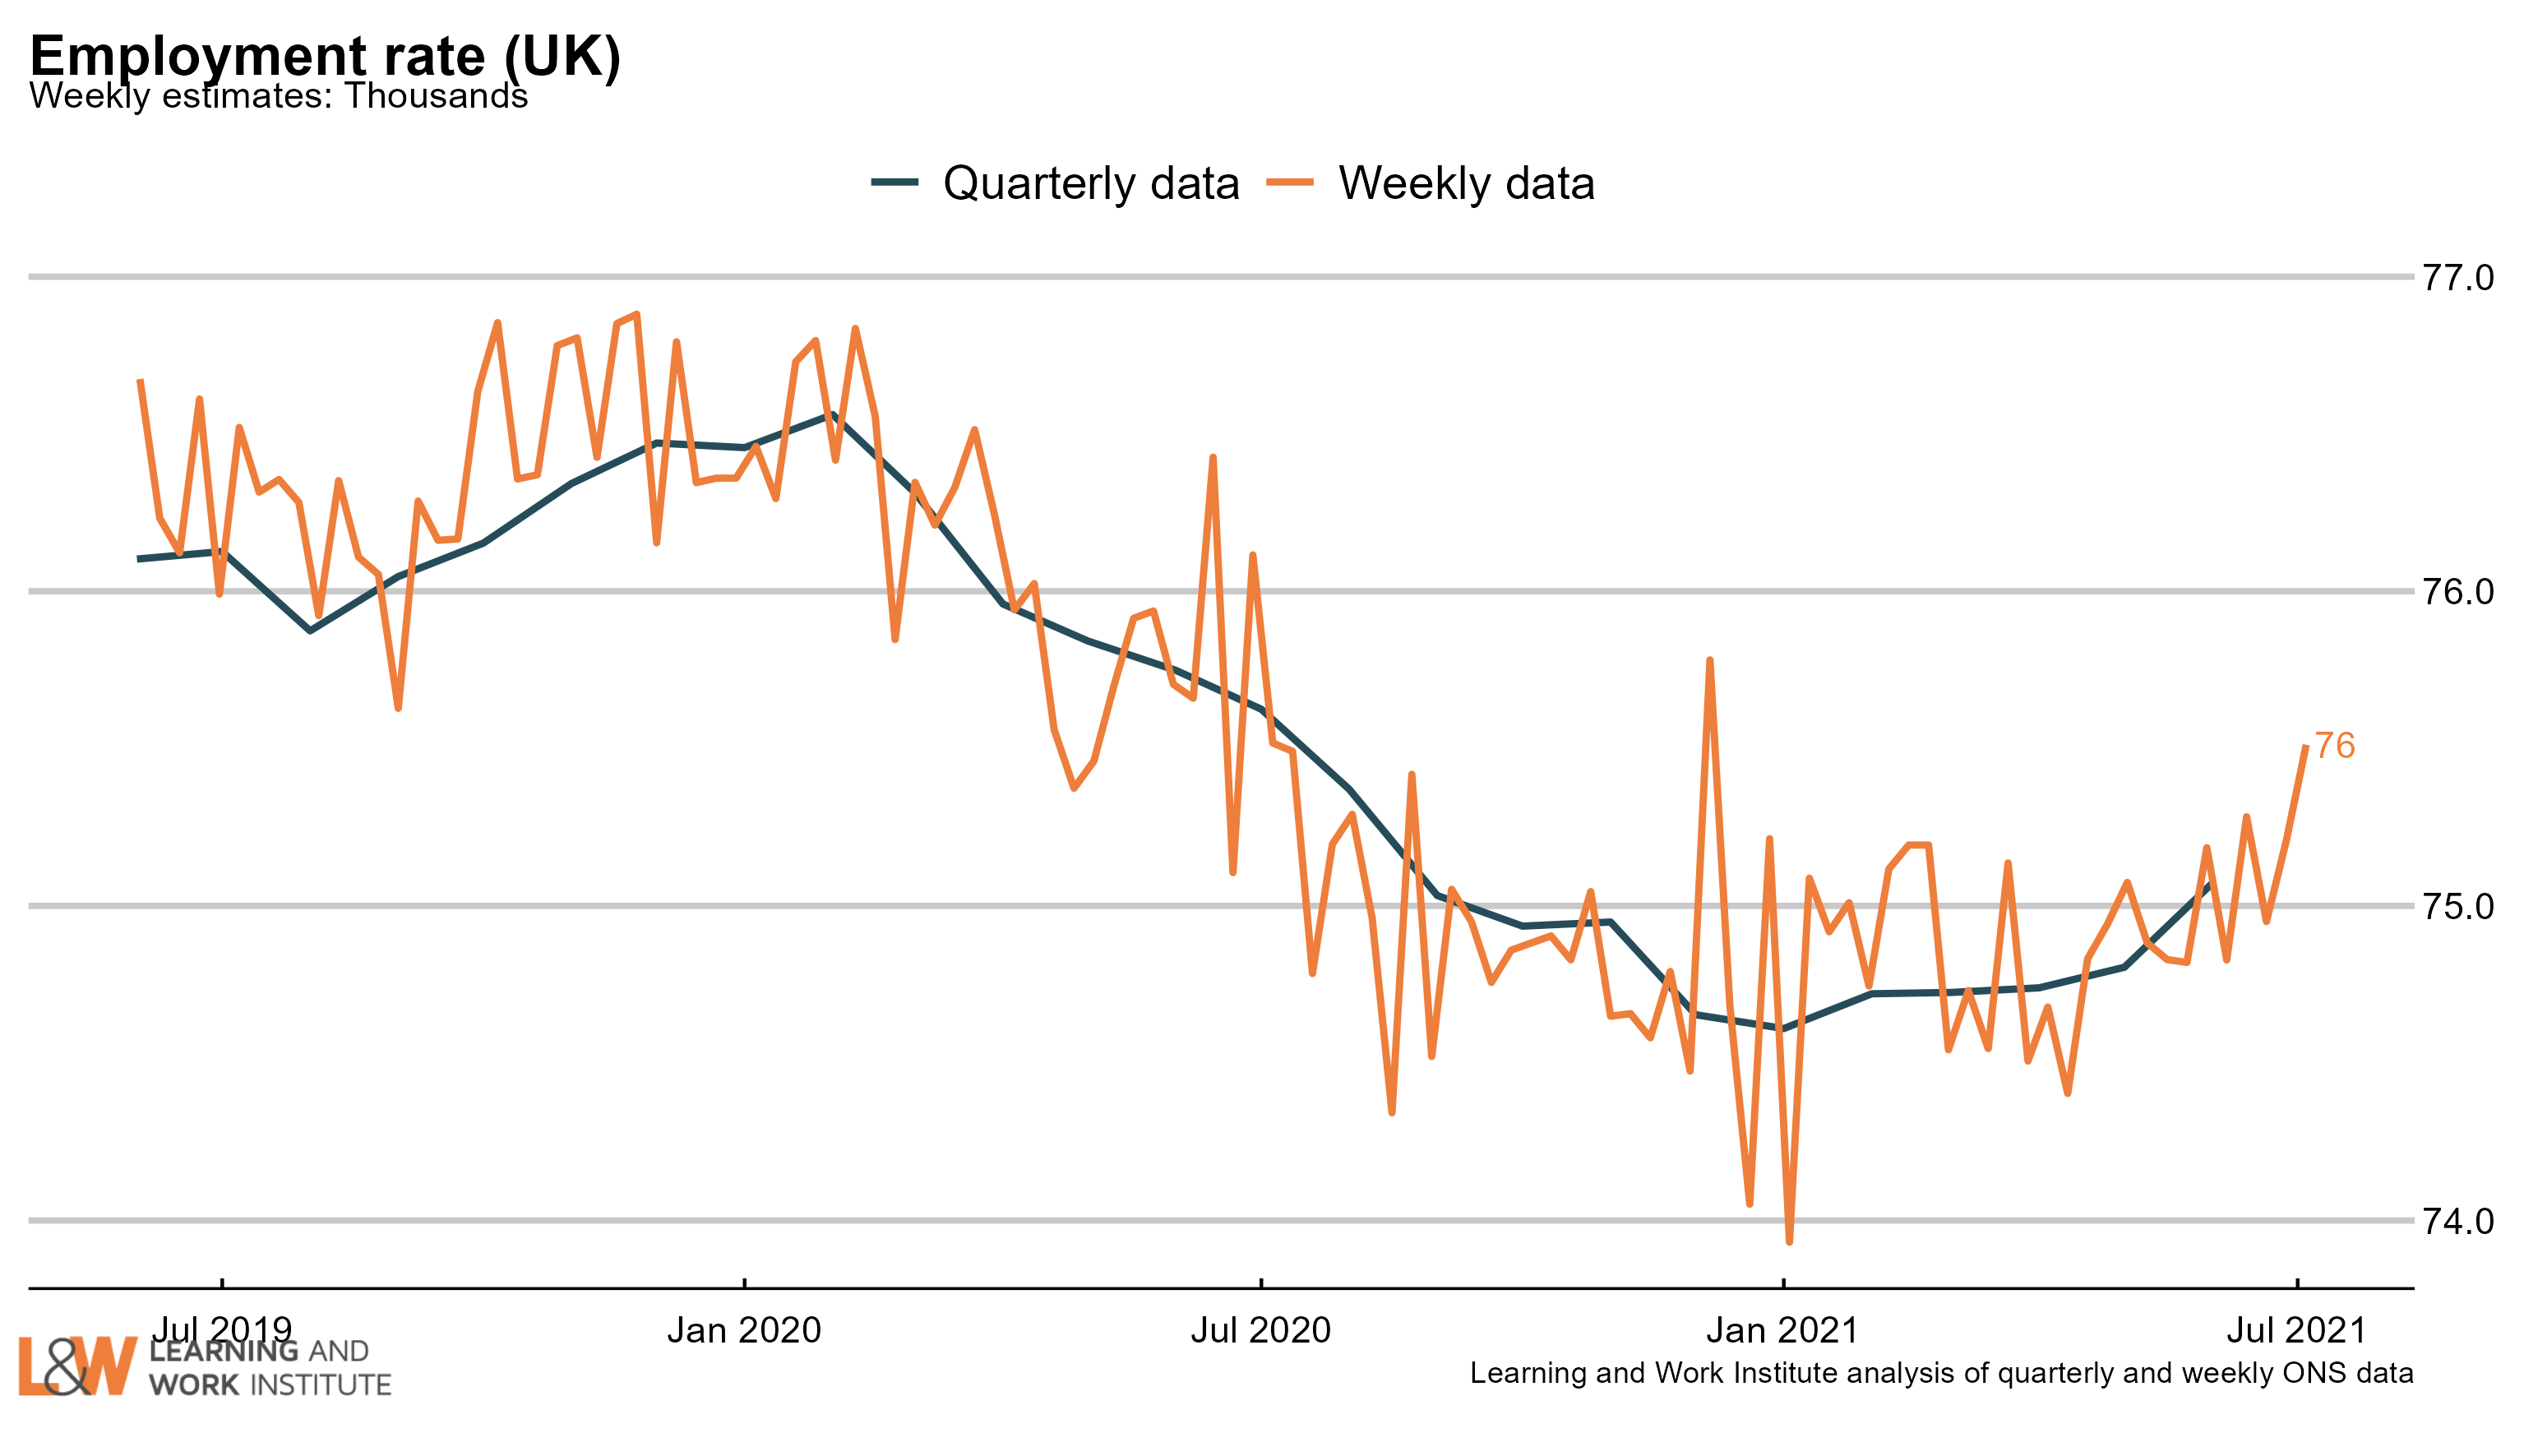
Chart 14: Employment rate in the UK
The employment rate has risen by 0.3 percentage points over the quarter, to 75.1%. The chart shows both the official figures and the experimental weekly figures. The trend is likely to be upwards, as is shown in the experimental weekly figures.
 |
|
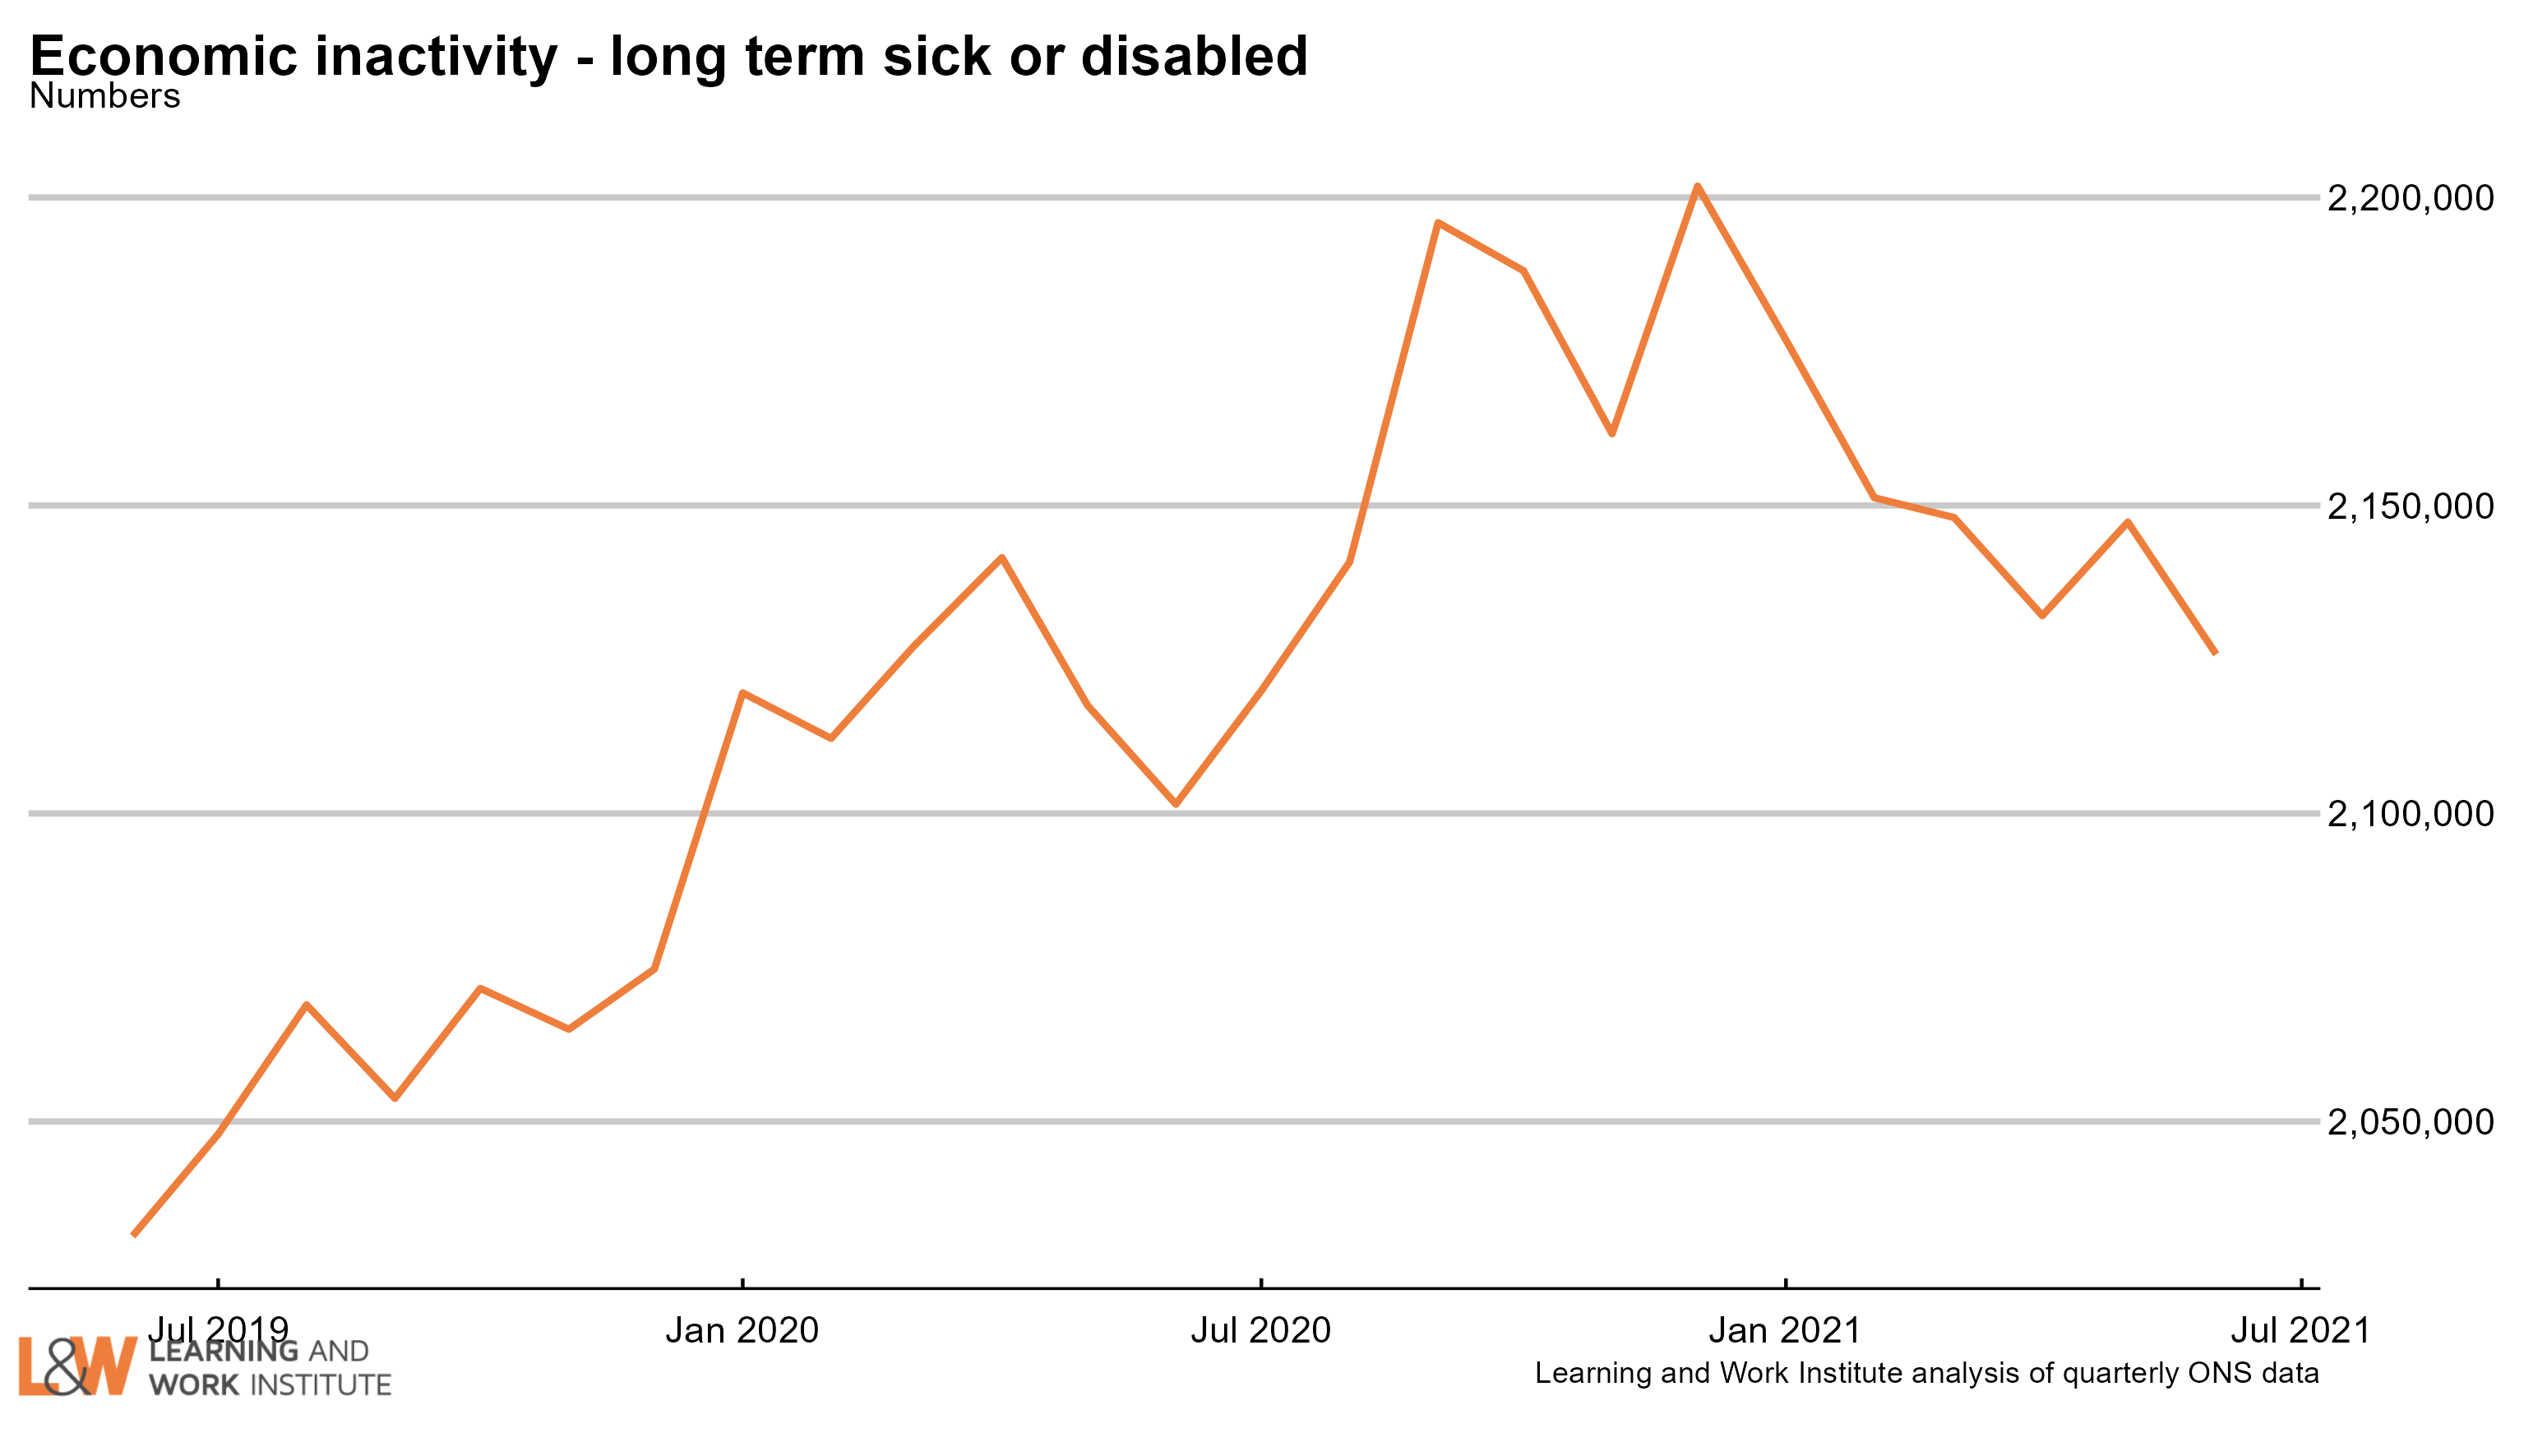
Chart 15: Economic inactivity – the long-term sick or disabled
The numbers of people who are economically inactive, - not working and not currently looking for work - who are long-term sick or disabled has now been trending downwards. This month, we are showing the numbers of people in this group.
 |
|
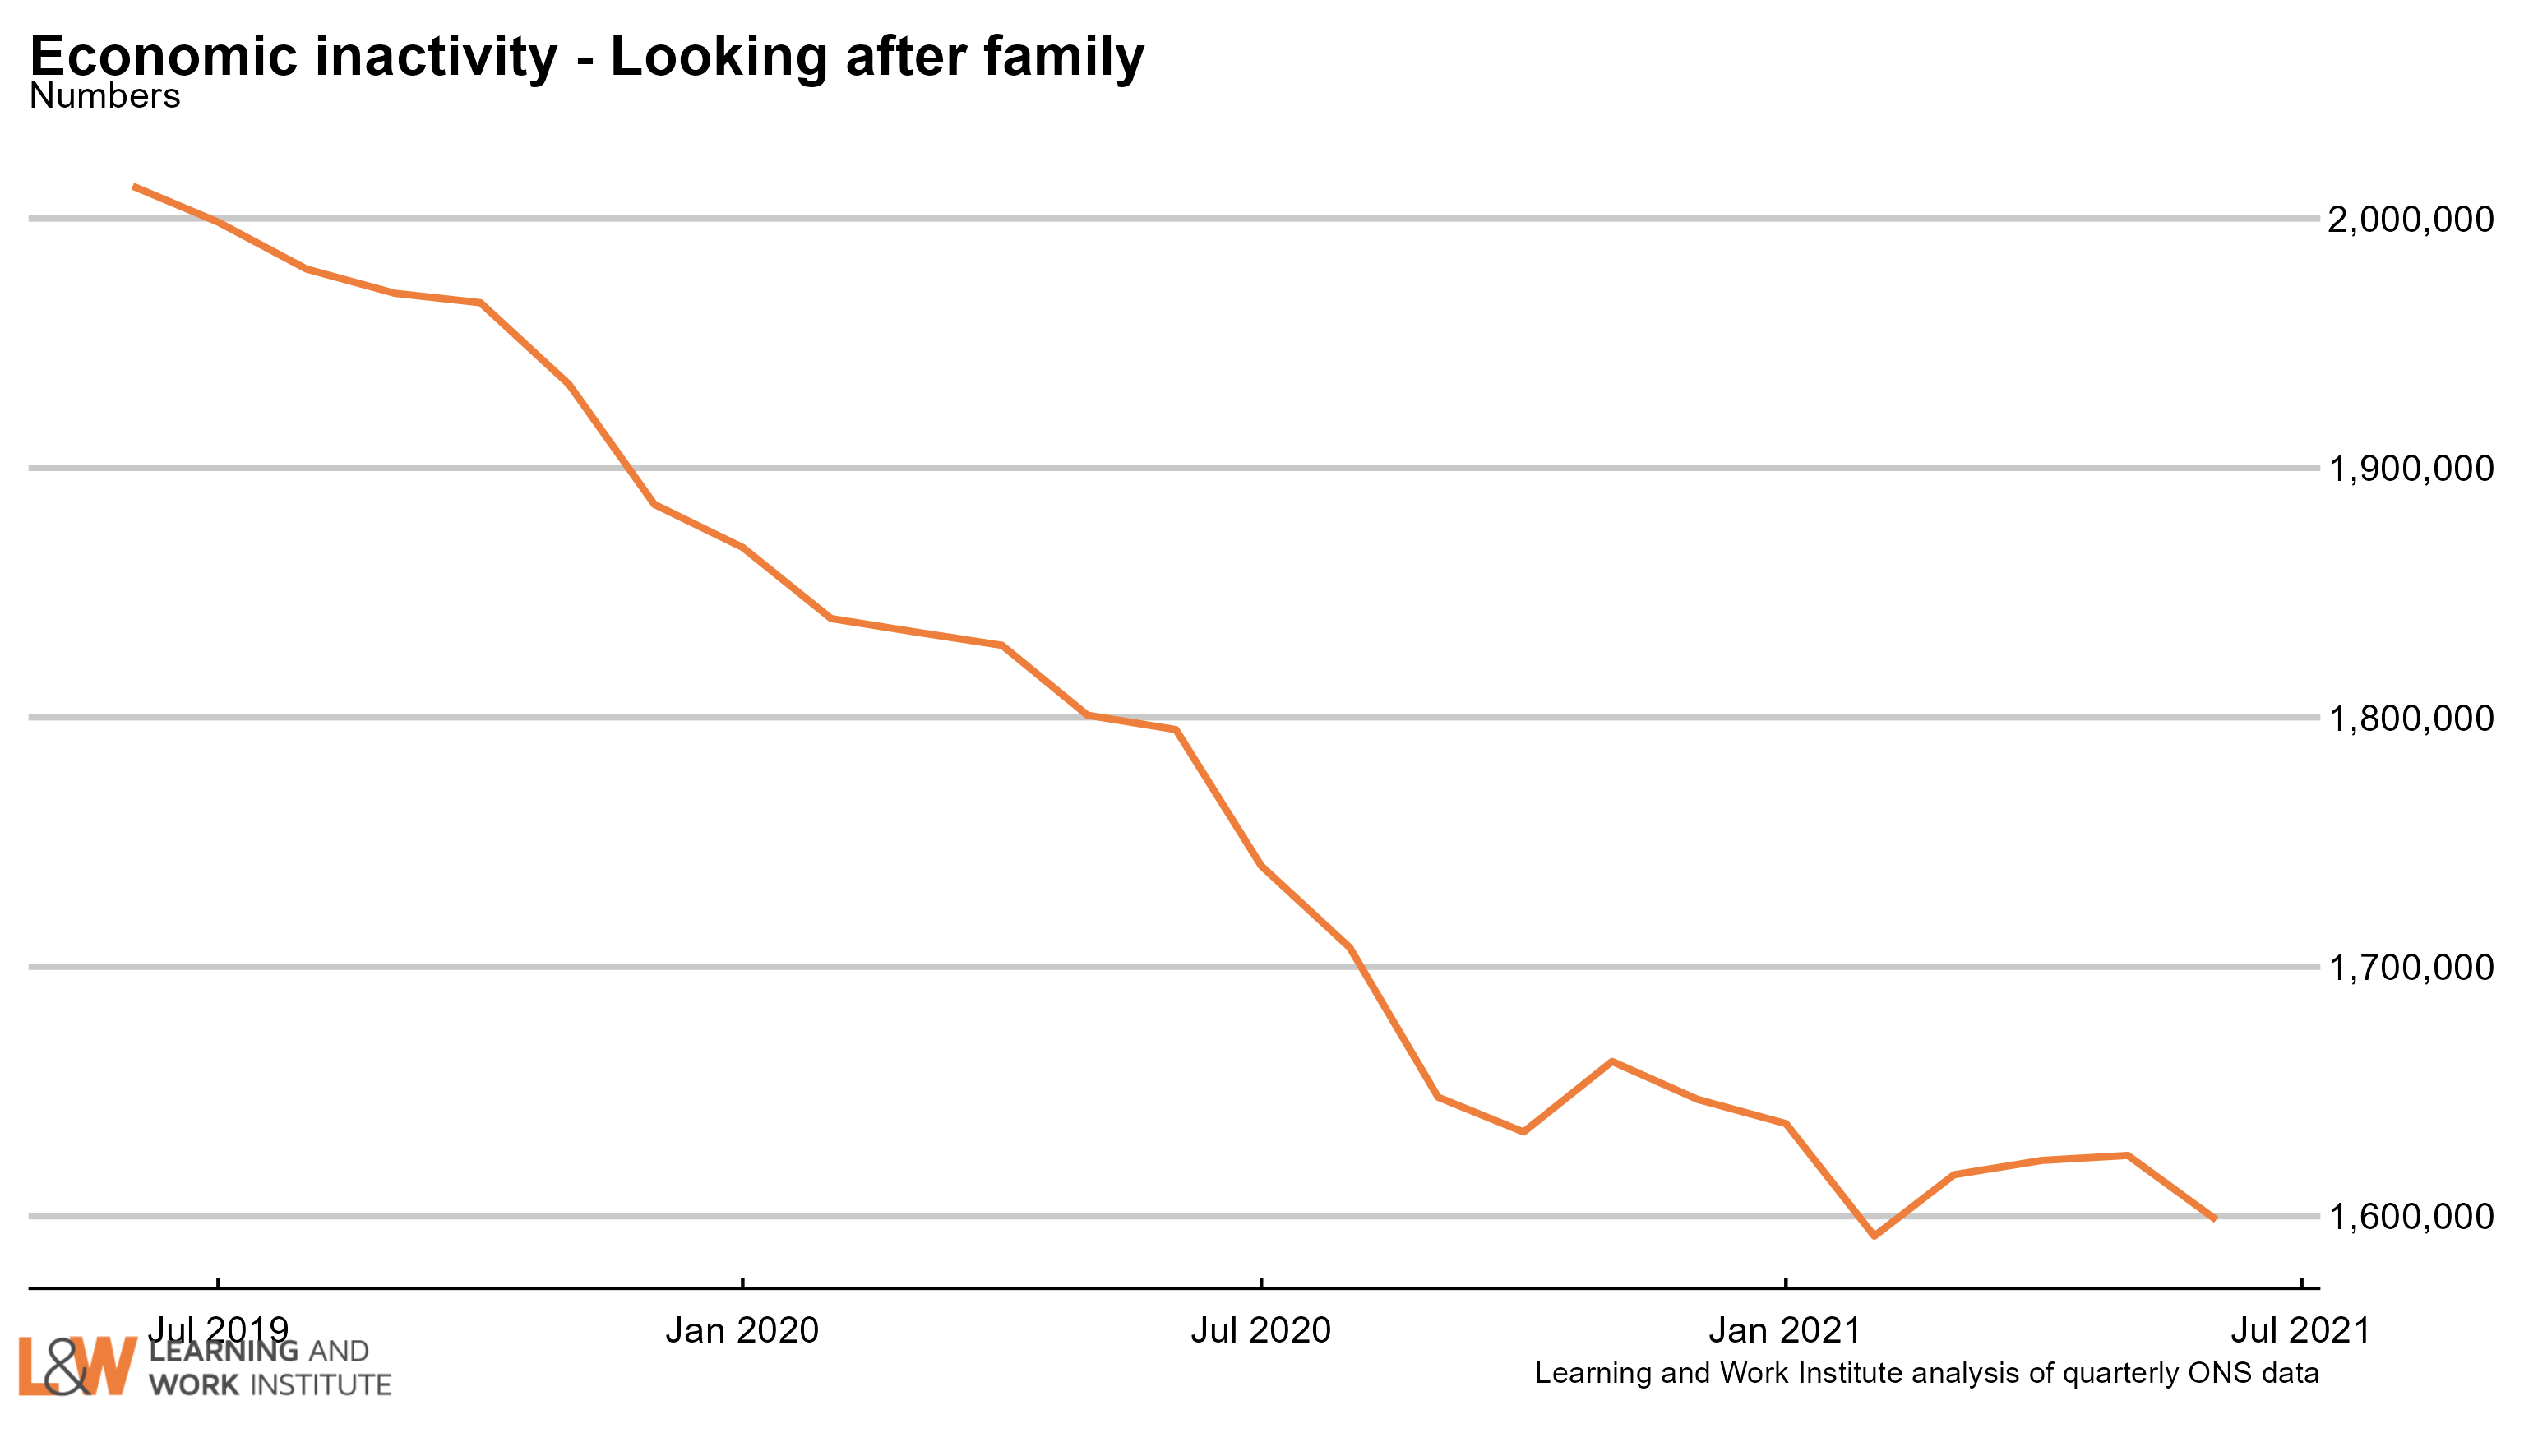
Chart 16: Economic inactivity – people looking after family
The survey figures (showing those looking after family and not doing paid work or looking for paid work) have been trending downwards, but has been flatter in recent months.
 |
|
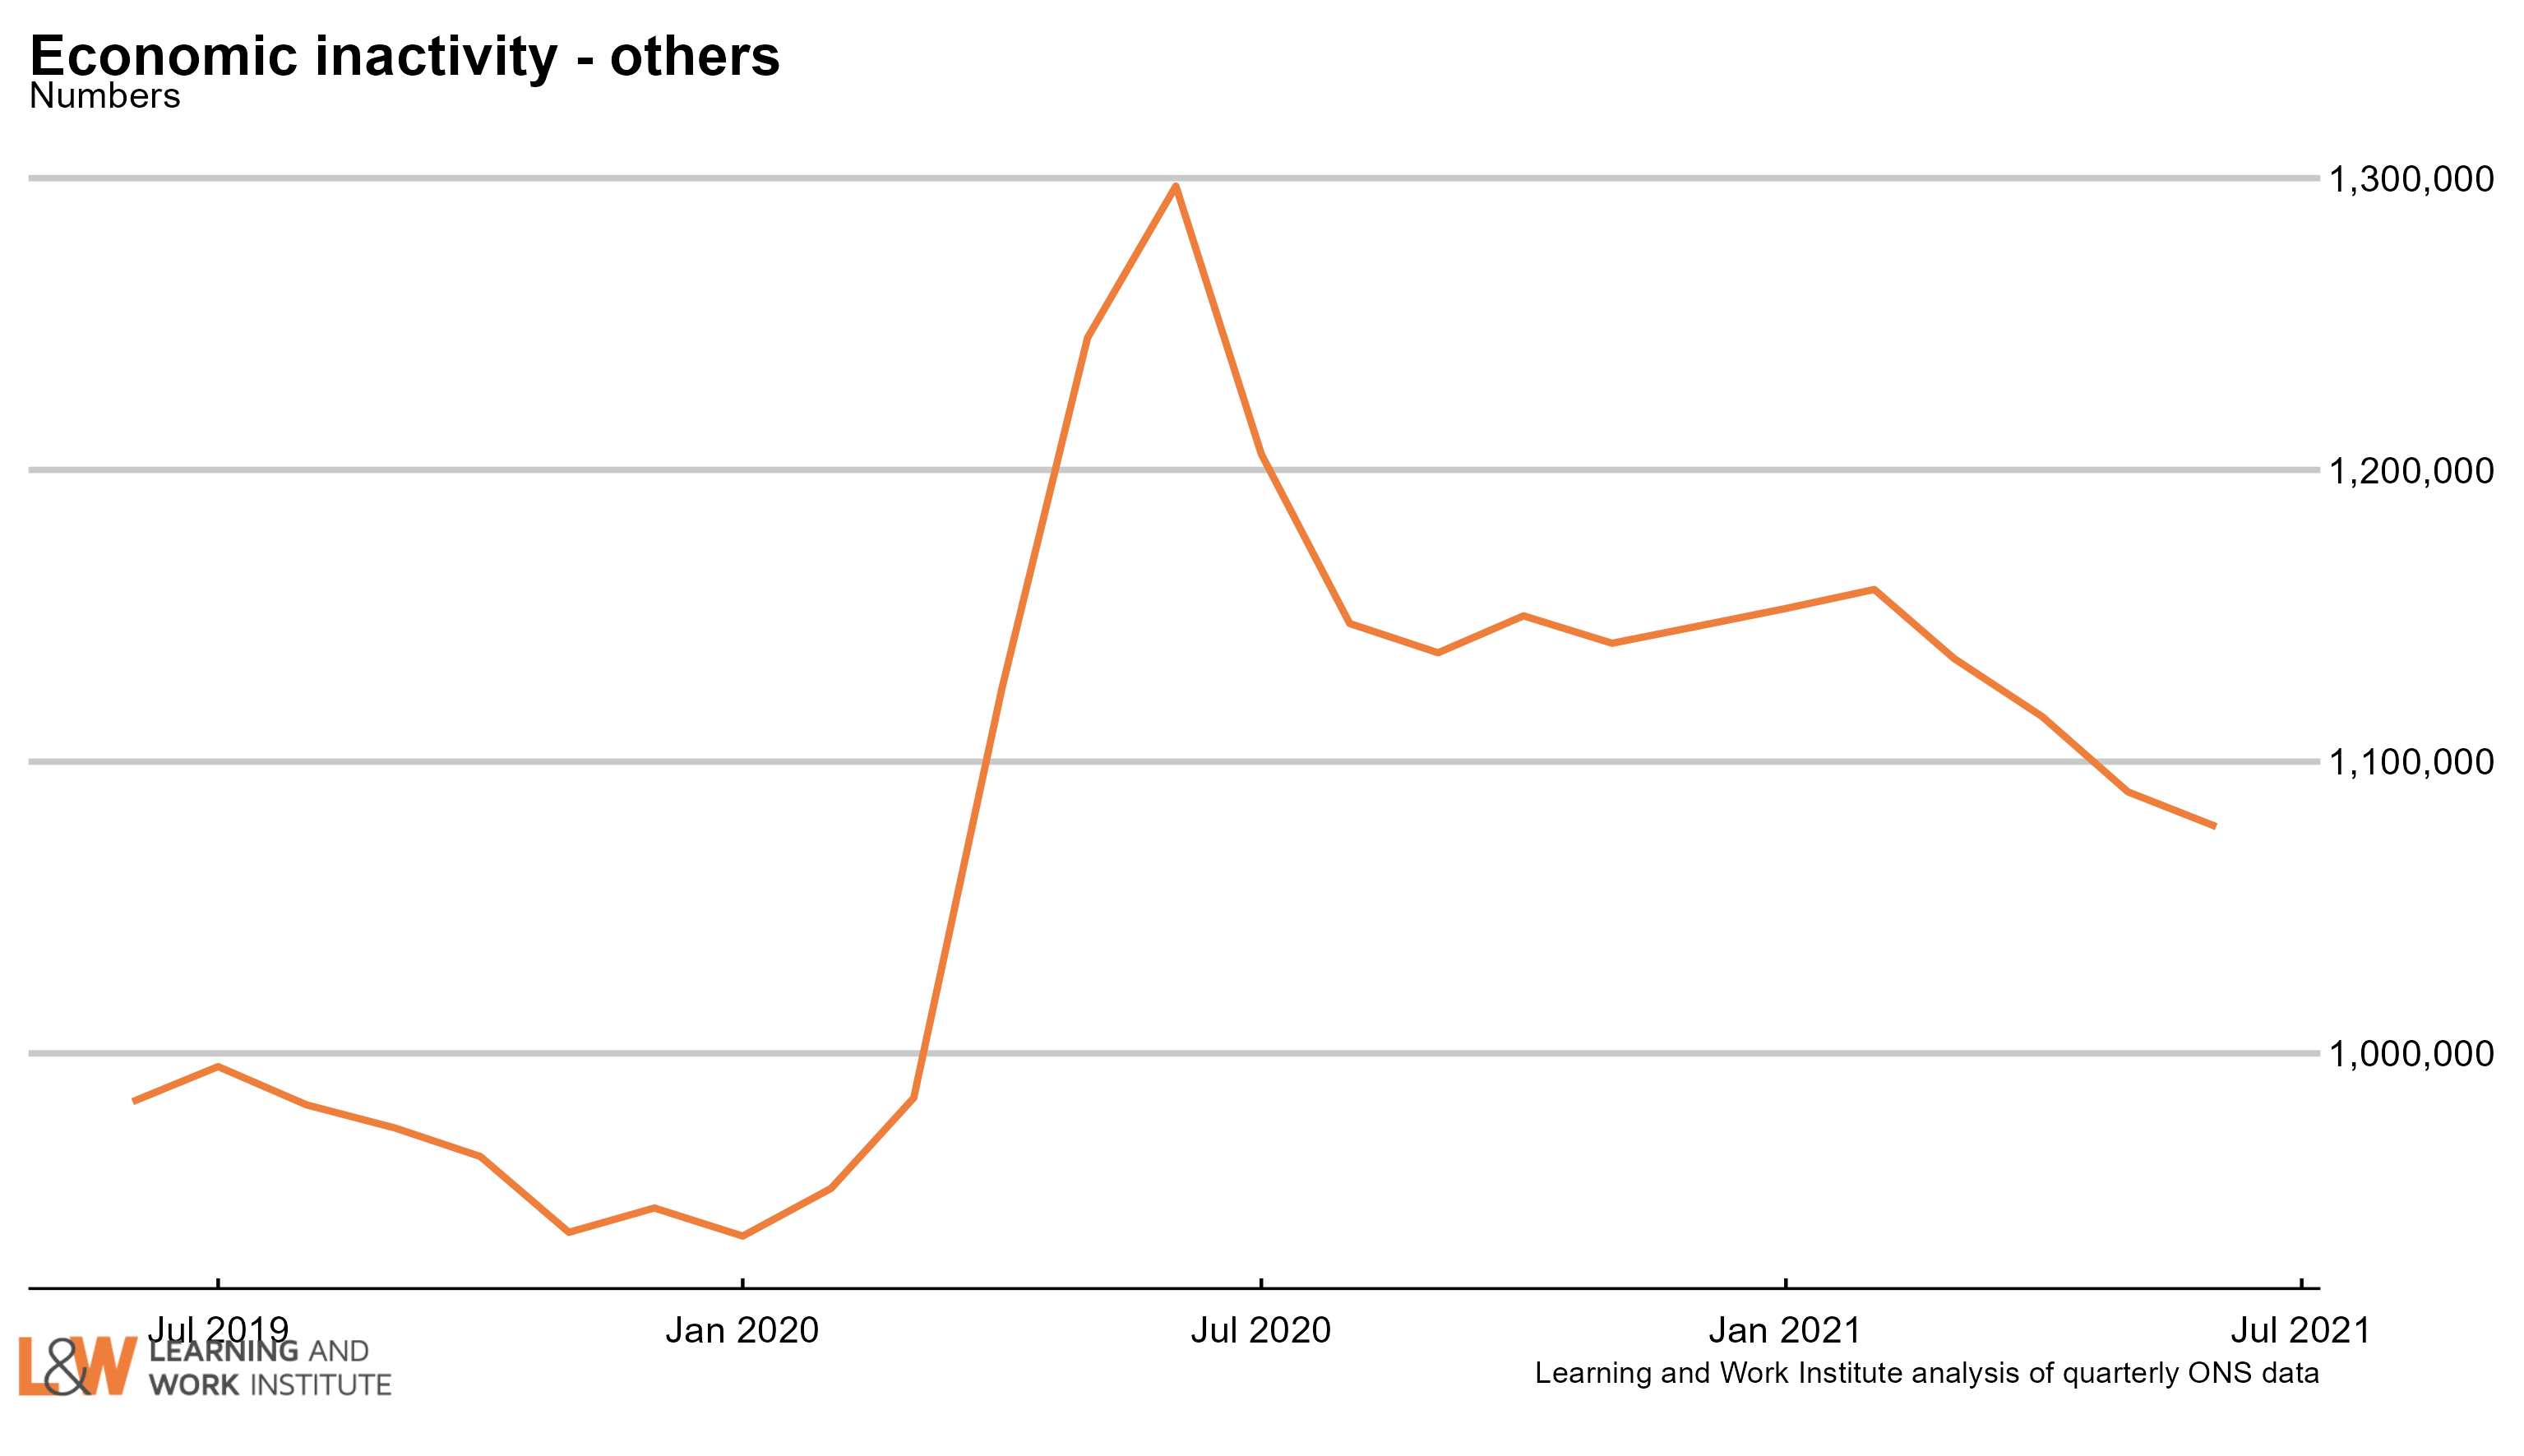
Chart 17: Economic inactivity – other inactive
In the Coronavirus period, people who were not working or looking for work due to Covid were included in this group. The number in this category increased sharply at the time, and has continued at a high level. A very high proportion of this group want to work, and this increased over the period of the pandemic.The increase over the pre-pandemic level is 124,000.
 |
|
Chart 18: Employment rate two-year change in regions – April to June 2021
Compared with 2019, two regions showed a rise in the employment rate, the North East and the West Midlands. The employment rate fell in 10 regions, led by the South East and the South West. 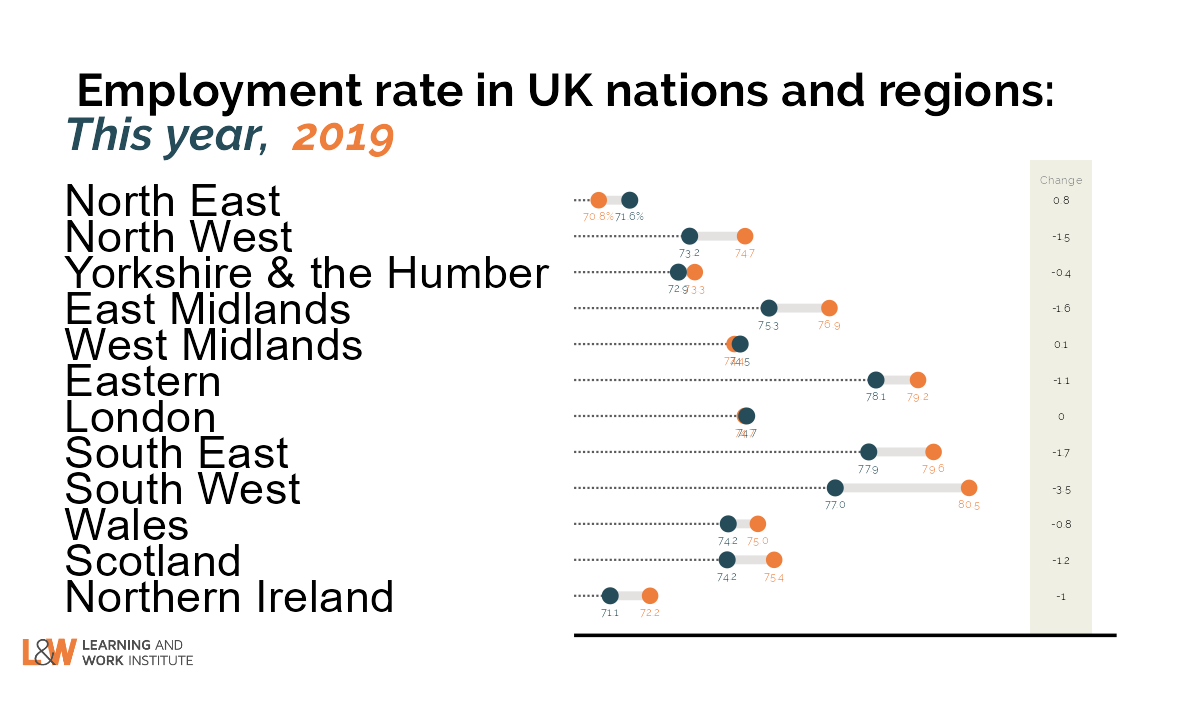 |
|
Chart 19: Unemployment rate two-year change in regions – April to June 2021
Compared with 2019, 10 regions showed a rise in the unemployment rate, led by London and the South East. The unemployment rate fell in no regions. 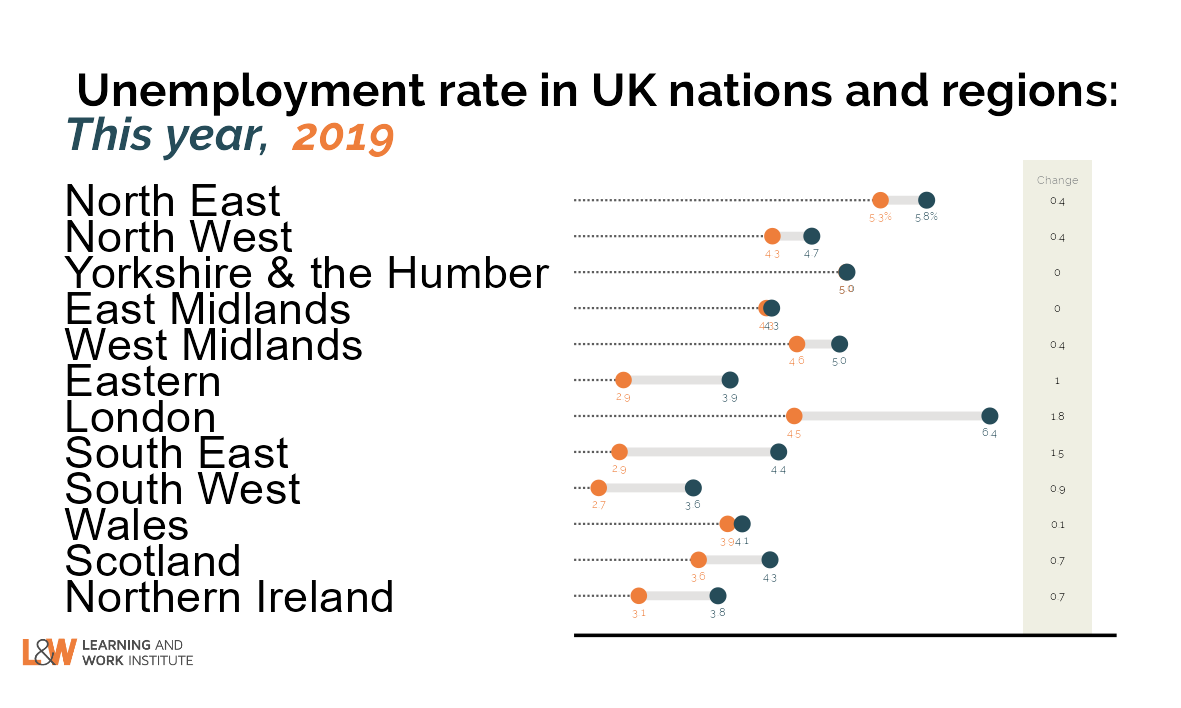 |
|
Chart 20: Inactivity rate two-year change in regions – April to June 2021
Compared with 2019, 9 regions showed a rise in the inactivity rate, led by the South West and the East Midlands. The inactivity rate fell in three regions, led by London and the North East. 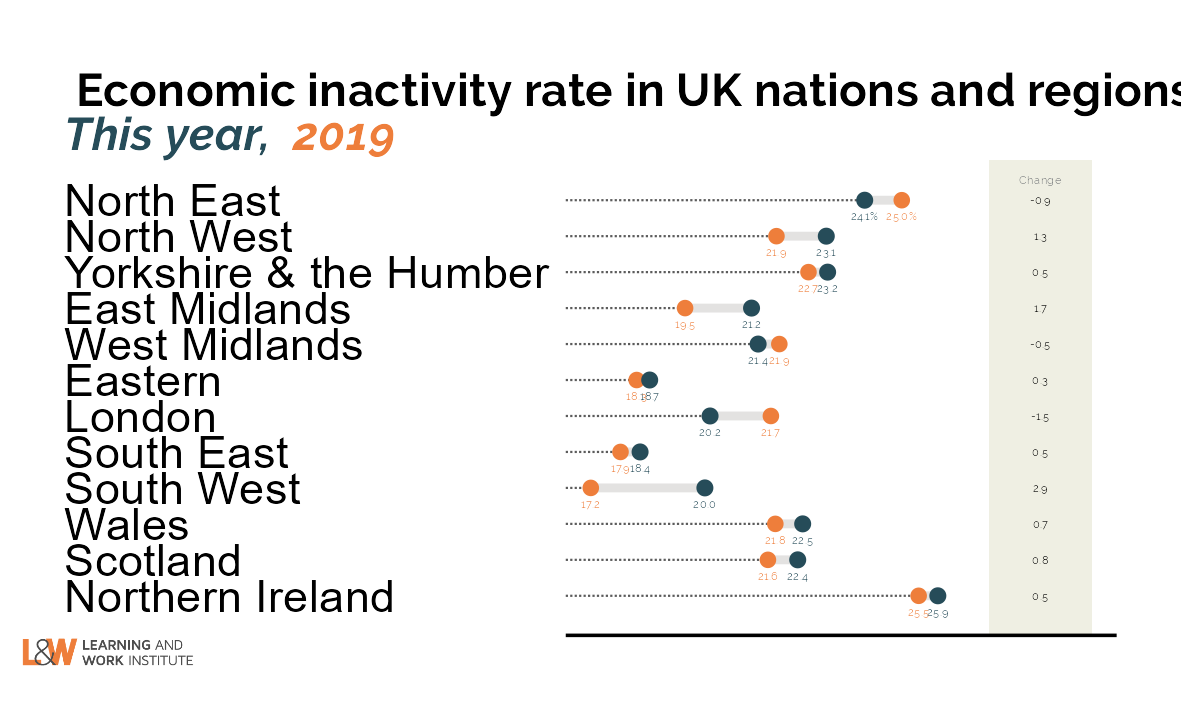 --> --> |
|
This newsletter is produced by Learning and Work Institute and keeps readers up to date on a wide range of learning and work issues.
If you have any questions, contact Paul Bivand
© 2020 Learning and Work Institute. All rights reserved. To subscribe click here
Click here to unsubscribe. To view this email in your browser click here
|
 |