|

|
|
Making learning and work count
Labour market LIVE from Learning and Work Institute
12 September 2023
- Unemployment is 1,464,000, up by 25,000 from last month's published figure (quarterly headline is up by 159,000) and the unemployment rate 4.3%, has risen by 0.1 percentage points on last month and by 0.5 percentage points on last quarter.
- The ONS figure for claimant unemployed is 1,551,100, up by 900 on last month.
- The number of workless young people (not in employment, full-time education or training) is 1,062,000, up by 60,000 on the quarter, representing 15.5% of the youth population.
- Youth unemployment (including students) is 526,000, up by 62,000 on the quarter.
- Vacancies in the ONS official series decreased for the 15th consecutive month to 989,000 in Jun-Aug 2023, down from a high point of 1,302,000 in Mar-May 2022.
- There are now 1.5 unemployed people per vacancy.
- The employment rate is 75.5% (down by 0.2 percentage points on last month's published figure and down by 0.5 percentage points in the preferred quarterly measure).
Stephen Evans, Chief Executive at the Learning and Work Institute, said:
"The labour market continues to soften with significant falls in the employment rate and rises in unemployment, plus vacancies below one million for the first time since pandemic restrictions eased. The UK is the only G7 country to have lower employment than pre-pandemic; and the number of people out of work due to long-term sickness is at record highs. We need to widen employment support and invest in social infrastructure like childcare, skills and health.
"Earnings grew faster than inflation for the second month in a row, though they remain £11,000 lower in real terms than if pre-financial crisis trends had continued. The cost of living crisis is far from over."
Labour Market Briefing
Employment, for all aged over 16, fell by 207,000 between February 2023 to April 2023 and May 2023 to July 2023. In the last 12 months employment is up by 135,000.
Unemployment increased by 159,000 between February 2023 to April 2023 and May 2023 to July 2023. Over this period, the unemployment rate rose by 0.5 percentage points to 4.3% in the most recent quarter.
Economic inactivity has increased by 63,000 between February
2023 to April 2023 and May 2023 to July 2023. The inactivity rate reduced by 0.1 percentage points to 21.1% in the quarter.
The national claimant count increased slightly to 1,551,100.
Youth unemployment rose by 62,000 over the quarter. There are 526,000 unemployed young people, and 370,000 (5.4% of the youth population) who are unemployed and not in full-time education.
Self-employment is down by 46,000 this year. The number of employees has risen by 184,000 over the year. Involuntary part-time employment remained the same compared to the previous quarter at 0.8 million, 9.5% of all part-time workers.
|
|

|
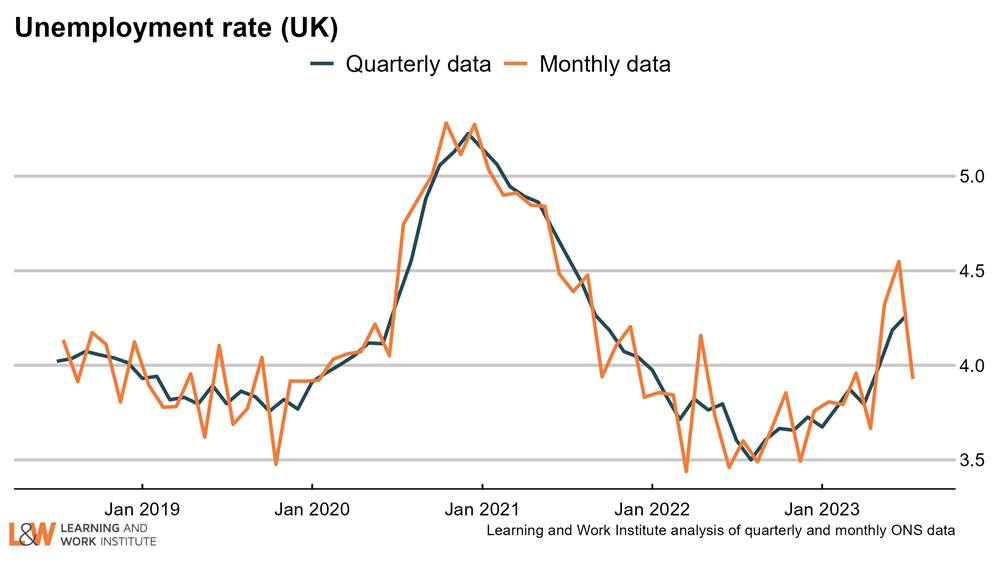
Chart 1: UK unemployment (ILO)
The latest unemployment rate increased by 0.5 percentage points to 4.3%.
|
|
|
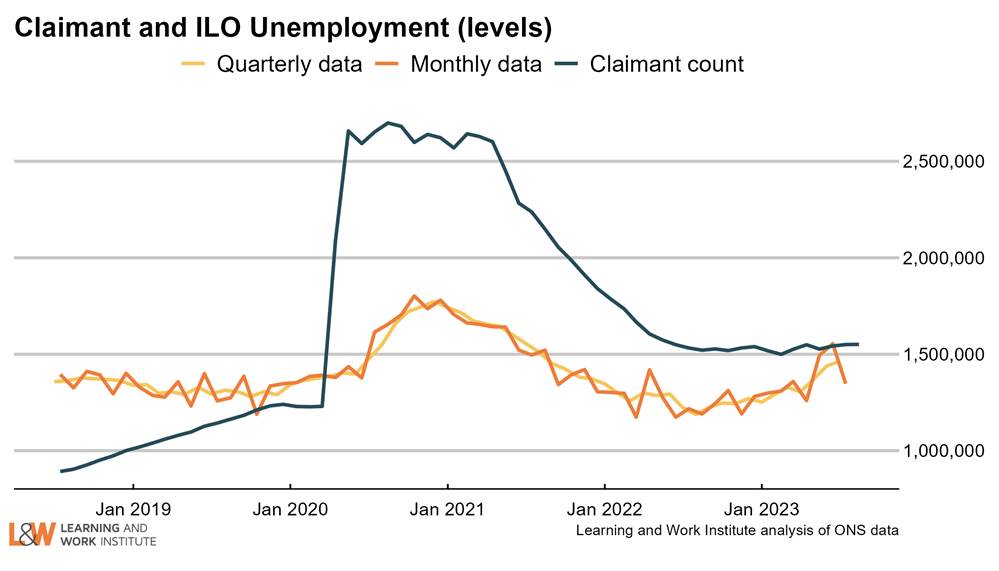
Chart 2: The claimant count and UK unemployment compared
The number of unemployed people who are claiming unemployment-related benefits is now 87,000 higher than the number of unemployed in the official measure.
|
|
|
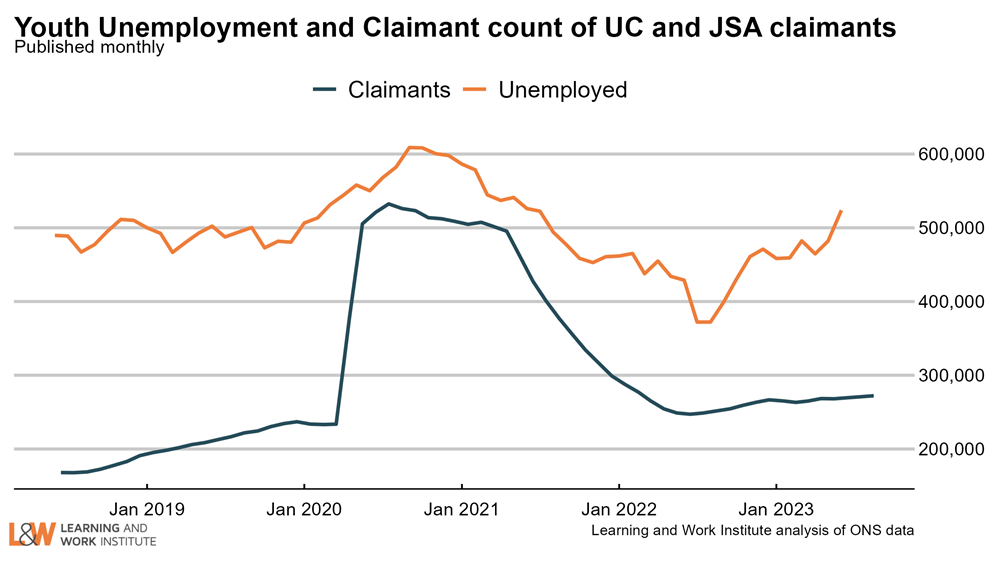
Chart 3: Youth unemployment
The number of unemployed young people (aged 16-24) rose by 2,000 since last month's figures, to 526,000.
Meanwhile, the number of young Universal Credit or Jobseeker's Allowance claimants (aged 18-24) last month increased by 1,400, to 272,000.
|
|
|
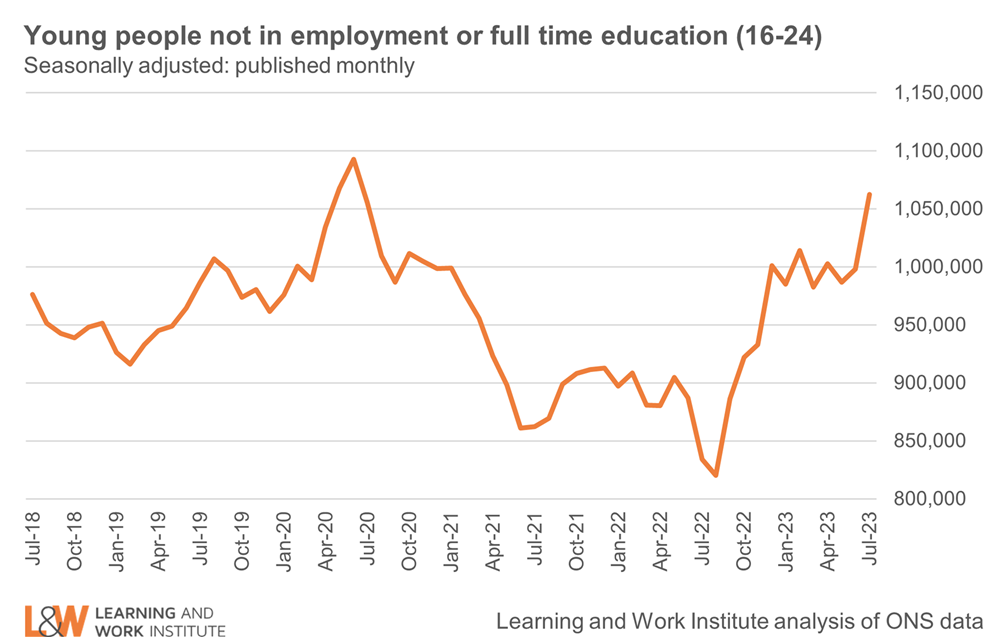
Chart 4: Young people not in employment, full-time education or training
The number of young people not in employment, full-time education or training (1,062,000) increased by 60,000 in the last quarter, an increase of 6.0%. 65% of young people not in full-time education or employment are economically inactive, rather than unemployed. To be counted as unemployed, people need to be both actively seeking work and available to start. People out of work who do not meet these criteria are counted as economically inactive.
|
|
|
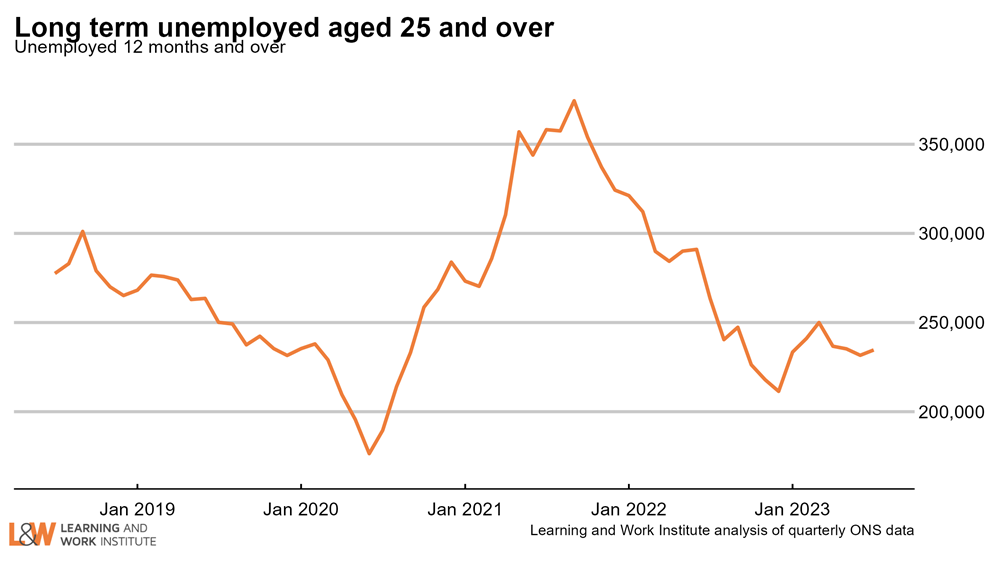
Chart 5: Adult long-term unemployment (12 months and over, 25+)
Adult long-term unemployment on the survey measure is now 235,000. The number of people aged 25 and over out of work for 12 months or more is down by 3,400 compared to before the pandemic (Dec 19 - Feb 20).
|
|
|
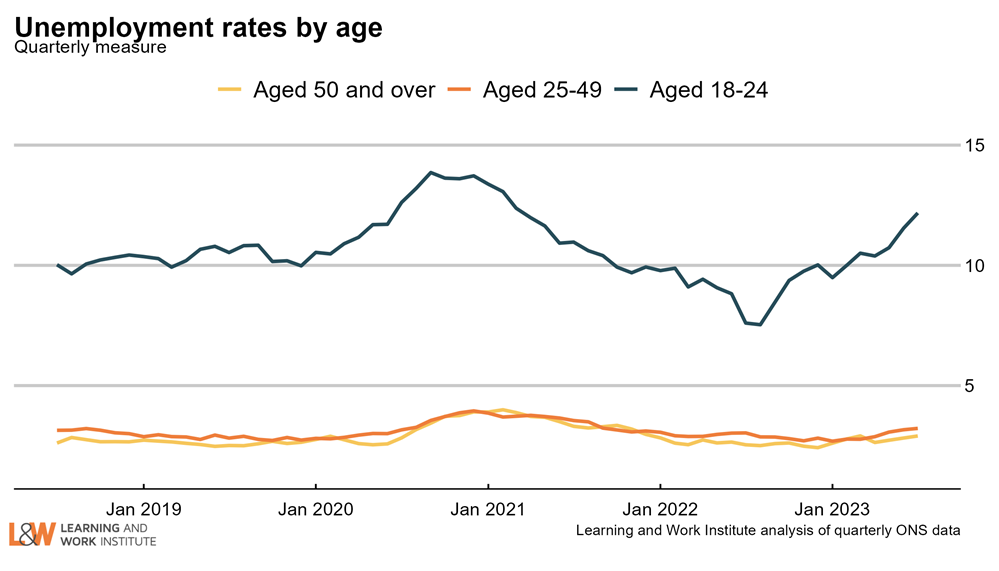
Chart 6: Unemployment rates by age
The 18 to 24 year old unemployment rate (including students) is 12.2% of the economically active - excluding one million economically inactive students from the calculation. The rate for those aged 25 to 49 is 3.2%. For those aged 50 and over it is 2.9%. The quarterly change is 1.8 percentage points for 18 to 24 year olds, 0.3 percentage points for 25 to 49 year olds, and 0.3 percentage points for the over-50s.
|
|
|
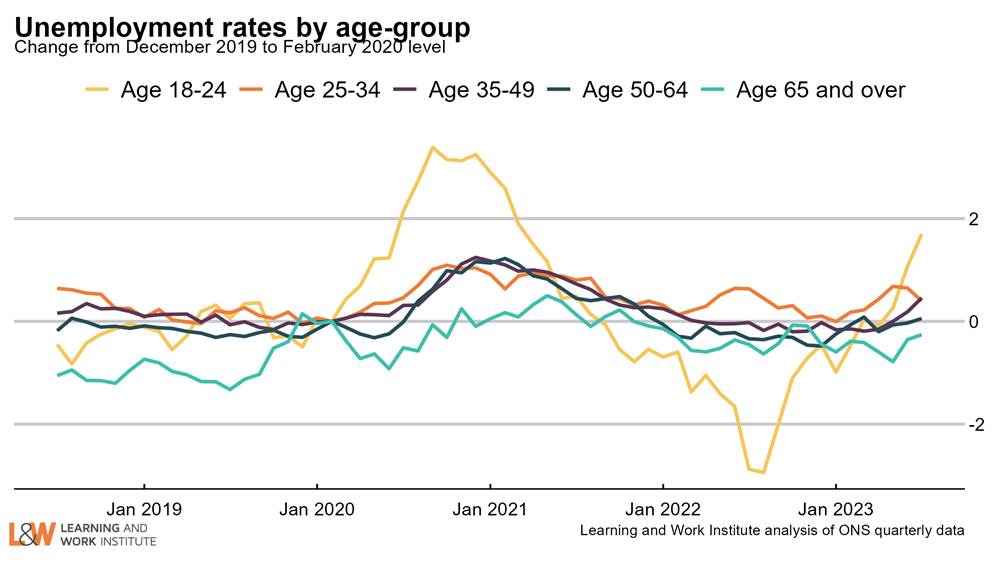
Chart 7: Unemployment rate changes by age (counting February 2020 as 100)
The 18 to 24 year old unemployment rate (including students) is 1.7 percentage points higher than in February 2020. The unemployment rate for those aged 25 to 34 increased by 0.4 percentage points and was 0.5 percentage points higher for those aged 35 to 49. For those aged 50 to 64, the unemployment rate increased by 0.1 percentage points and for those aged over 65 it decreased by 0.3 percentage points.
|
|
|
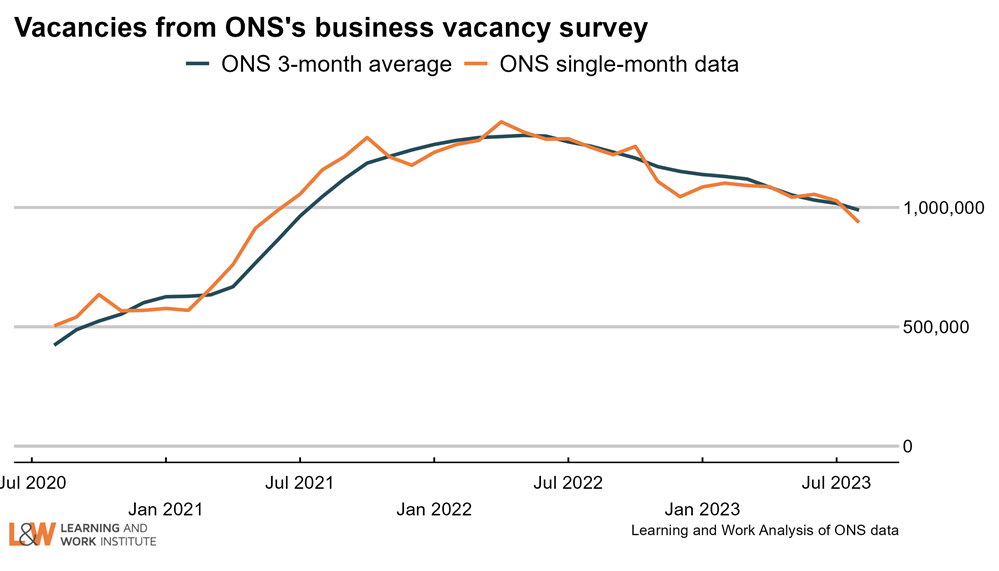
Chart 8: Vacancies – whole economy survey
Headline vacancies this month are down by 28,000 to 989,000. The ONS' experimental single-month vacancy figures is down by 106,000 in the last quarter. The headline ONS vacancy figure is both seasonally adjusted and a three-month average. The chart shows both series.
|
|
|
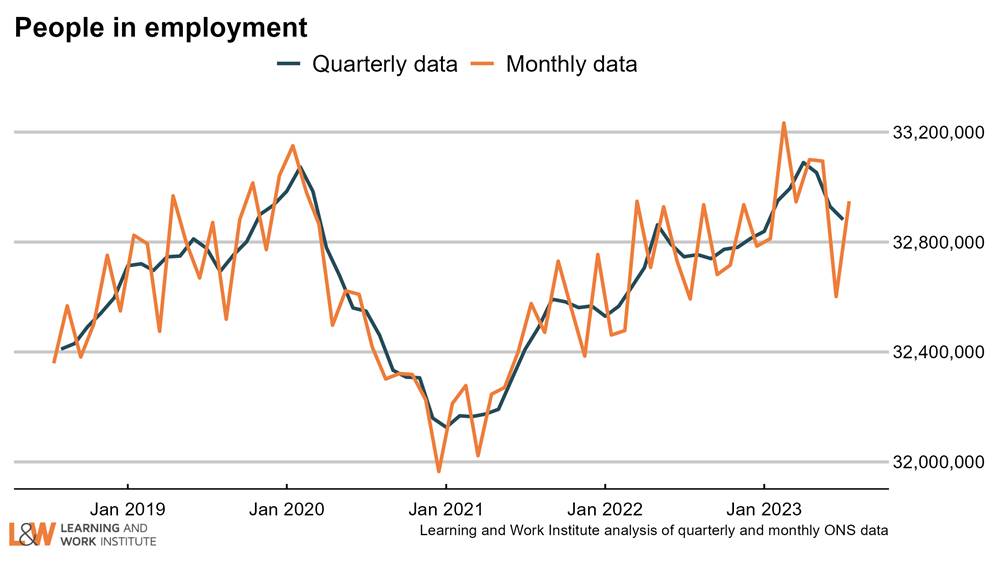
Chart 9: UK employment
Employment is down by 48,000 on the figure published last month, to 32,882,000. The chart shows both the official figures and the experimental monthly figures.
|
|
|
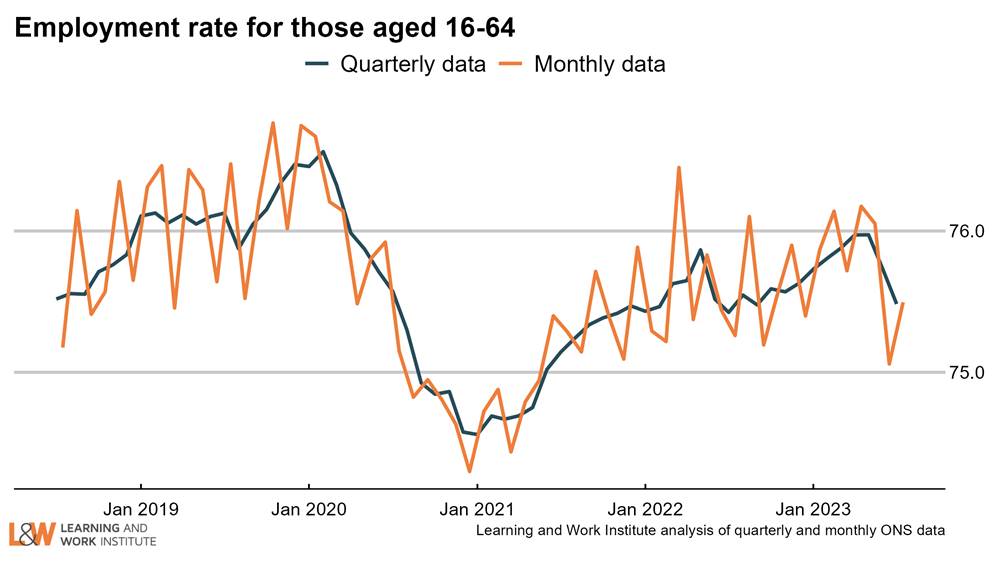
Chart 10: Employment rate in the UK
The employment rate fell by 0.5 percentage points over the quarter, to 75.5%. The chart shows both the official figures and the experimental monthly figures.
|
|
|
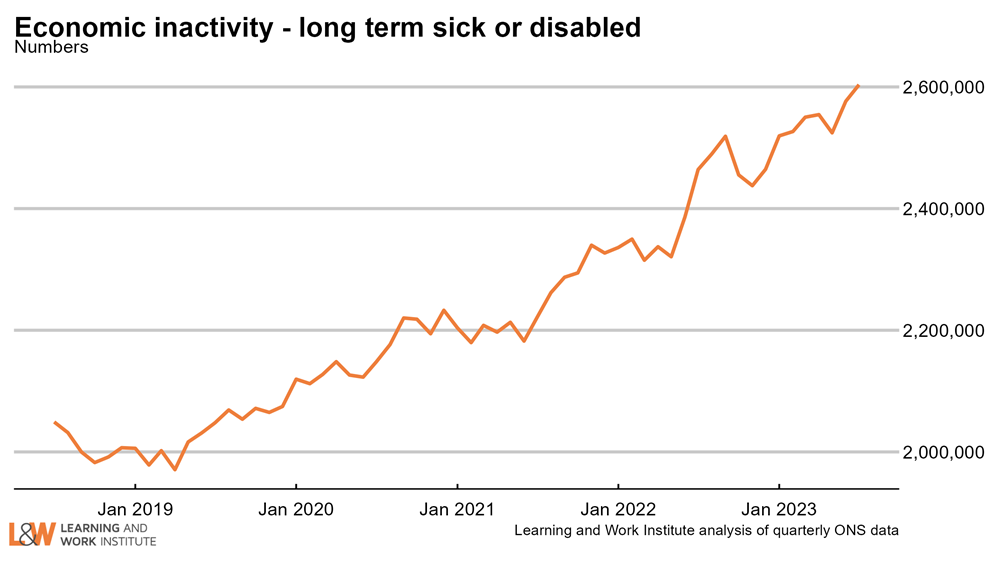
Chart 11: Economic inactivity – the long-term sick or disabled
The number of people who are economically inactive (that is, not working and not currently looking for work) who are long-term sick or disabled has risen by 3.2% in the last 6 months to 2,604,000 working age people.
|
|
|
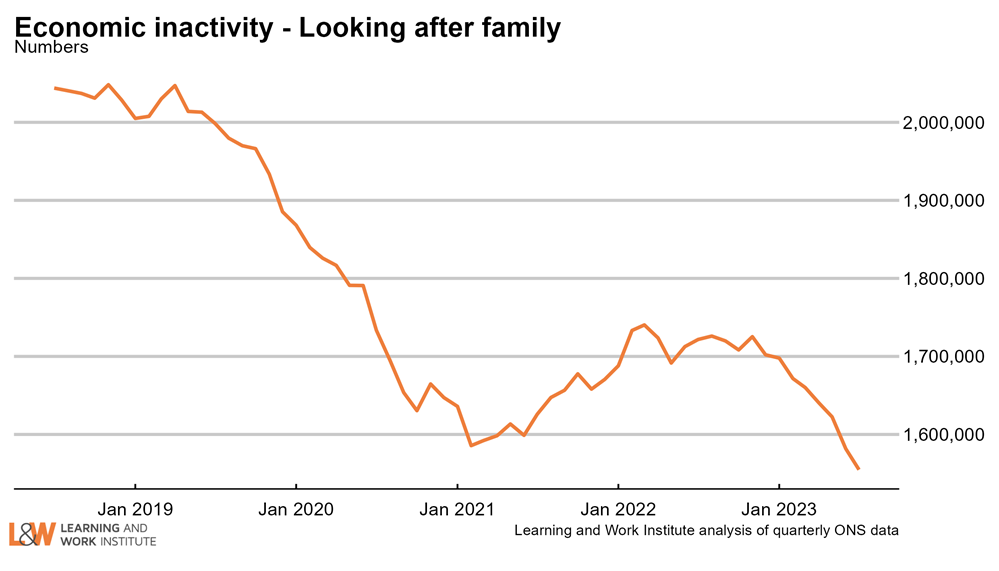
Chart 12: Economic inactivity – people looking after family
The survey figures show the number of people looking after family and not doing paid work or looking for paid work have been trending downwards in recent months after rising steadily between early 2021 and early 2022. There are now 1,554,000 people looking after family and not working, the lowest it has ever been.
|
|
|
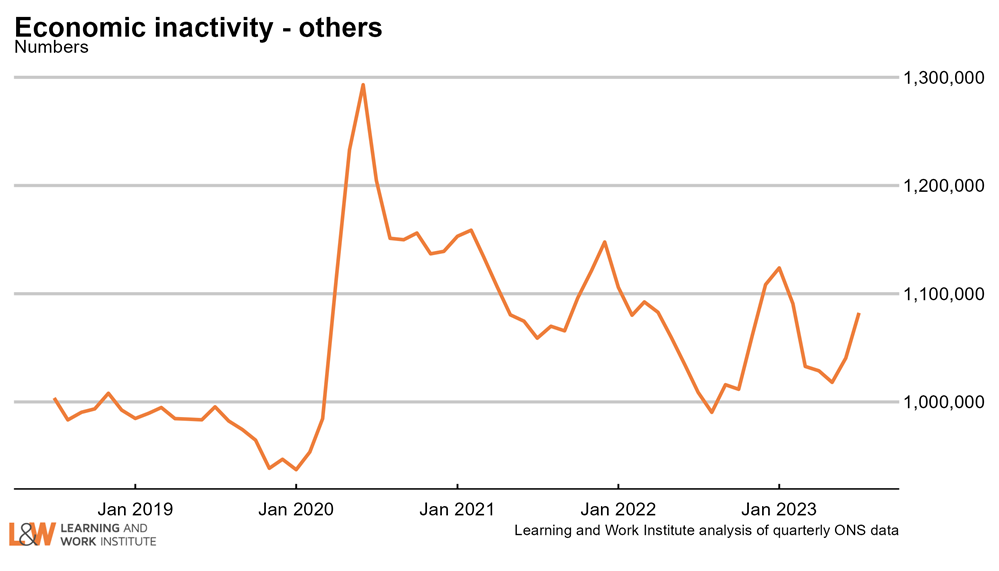
Chart 13: Economic inactivity – other inactive
In the Coronavirus period, people who were not working or looking for work due to Covid were included in this group. The number in this category increased sharply at the time, but has since declined. A relatively high proportion of this group want to work. There are now 1,082,000 people who are classified as economically inactive - other, 27% of whom want to work. This is compared to a high point of 1,293,000.
|
|
|
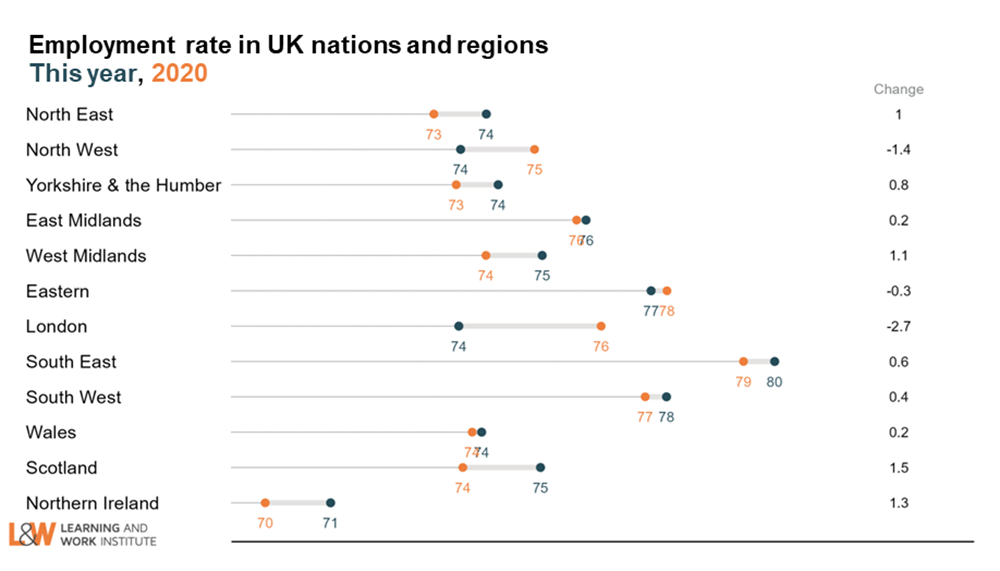
Chart 14: Employment rate three-year change in regions – May to July 2023
Employment rates this quarter are higher than the equivalent quarter in 2020 in the North East, Yorkshire and the Humber, East and West Midlands, South East, South West, Wales, Scotland, and Northern Ireland, and lower in the North West, Eastern and London regions. The largest increase was seen in Scotland while the largest decrease was seen in London.
|
|
|
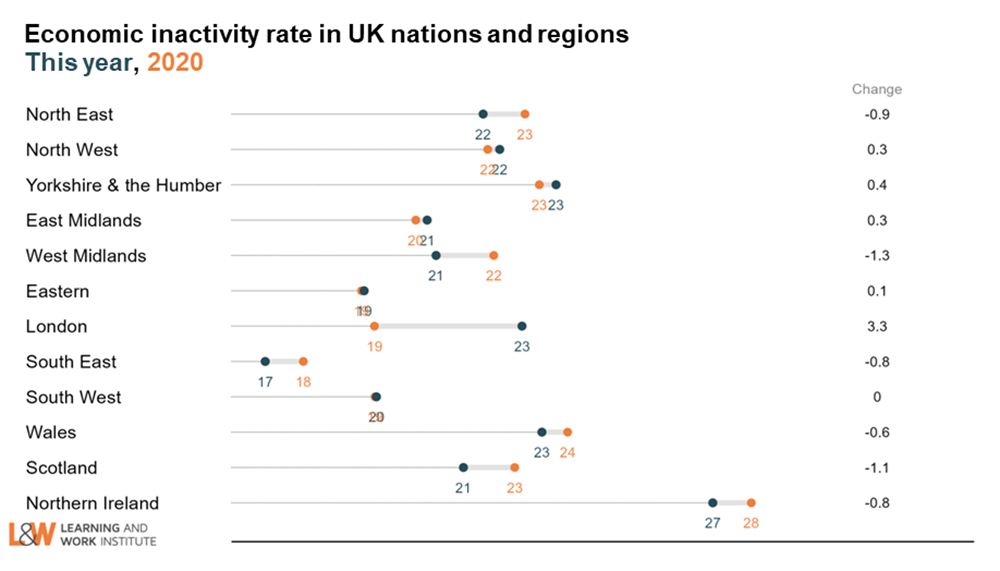
Chart 15: Inactivity rate three-year change in regions – May to July 2023
Economic inactivity this quarter is higher than the equivalent pre-pandemic quarter everywhere except the North East, the West Midlands, the South East, Wales, Scotland and Northern Ireland. The West Midlands saw the largest decline in economic inactivity, while the largest increase was seen in London. This varying picture, which is even greater at sub-regional level, shows the importance of tackling inequalities so everyone has a fair chance in life wherever they live.
|
|
This newsletter is produced by Learning and Work Institute and keeps readers up to date on a wide range of learning and work issues. View this email in your browser. Click here to unsubscribe.
If you have any questions, contact Helen
© 2023 Learning and Work Institute. All rights reserved. To subscribe click here
|