 |
|
Making learning and work count
Labour market LIVE from Learning and Work Institute
19 May 2020
- The ONS figure for claimant unemployed is 2,096,600 in April, sharply up by 856,500 or 69.1% on last month, and the claimant rate is 5.8%.
- The ONS figure for 18-24 claimant unemployed is 378,100 in April, up by 143,100 or 60.9% on last month.
- Vacancies fell 157,000 in the three months to April.
- Single month vacancies fell 399,000 or 53.2% in April from March.
- Unemployment was 1,348,000, in January to March 2020 and decreased by 17,000 from last month’s published figure (quarterly headline rose by 58,000) and the unemployment rate 3.9%, is down by 0.1 percentage points on last month and has risen by 0.1 percentage points on last quarter.
- The number of workless young people (not in employment, full-time education or training) was 983,000 in January to March 2020, and rose by 21,000 on the quarter, representing 14.3% of the youth population (is up by 0.3 percentage points).
- Youth unemployment (including students) was 516,000 in January to March 2020 and is up by 35,000 on the quarter.
- The employment rate was 76.6% in January to March 2020 and was up by 0.1 percentage points on last month’s published figure and increased by 0.2 percentage points in the preferred quarterly measure.
Learning and Work Institute comment
The headline labour market figures for employment and unemployment published on 19 May still do not incorporate the impact of the coronavirus pandemic. However, other numbers released today for claimant unemployment, working hours, and vacancies all point to a dramatic negative impact of the crisis.
Duncan Melville, chief economist at Learning and Work Institute, commented:
The numbers for employment, unemployment and economic inactivity released today all relate to the first three months of this year. For all bar the latter part of March, this was prior to the full onset of the coronavirus pandemic and the social distancing / lockdown measures put in place by the Government. The headline numbers show no impact from the crisis: the employment rate
was at a record high, the unemployment rate low at 3.9% and inactivity amongst people of working age was falling.
However, other numbers released today point to a dramatic and negative impact of this crisis on the labour market. Most notably, the claimant count numbers for April which show an increase of 856,500 in the month taking claimant unemployment to 2,096,600. If official unemployment has increased by a similar amount then in April, official unemployment would already have increased to around 2 1/4 million or 6.5%.
Consistent with this a range of other indicators point to a dramatic deterioration in the UK economy and labour market. Figures for economic output for the first quarter of this year released last week showed that in March alone GDP fell by 5.8%, and by 2.0% for the quarter as a whole. Given that the impact of the pandemic only came through in the latter half of March, this suggests that the lockdown measures for the period they
are fully in operation will reduce economic output by around a fifth. In addition, the composite IHS Markit / CIPS index for output fell sharply between March and April. The new Business Impact of Coronavirus Survey (BICS) covering mid-April found that in the previous two weeks, nearly three fifths of business had seen turnover decline with close to a quarter experiencing declines of over 50%.
Today's release found that total working hours in the first three months of 2020 fell by the largest amount for 10 years. The HMRC's 'flash estimate' of paid employment for April showed a fall of 457,000 in the month. This is close to four times the largest monthly fall in employment in the official numbers since records began in 1971 of 117,000. Vacancy numbers for the three months to April fell by a fifth or by 157,000 on the numbers for the first three months of this year. Research by the Institute for Employment Studies suggests that vacancy levels have continued
to fall and that in early to mid-May were 60% lower than they had been before the onset of the pandemic crisis. In short, the impact of the pandemic is clear in these more timely numbers: economic activity and employment have fallen very substantially, unemployment has risen very sharply and vacancy levels have collapsed.
Looking forward the situation is likely to worsen further. Since last month's briefing two projections for the UK economy have been released: by the National Institute for Economic and Social Research (NIESR) and the Bank of England and which projected a fall in economic output in the second quarter of this year of 15% and 25% respectively. Both organisations expect the unemployment rate to peak at around 10% later this year before starting to fall back and averaging 8% for the year as a whole.
Both organisations, expect a rapid rebound in economic activity and consequently anticipate that unemployment will start to fall from
late this year / next year. Both organisations stress that the risks to their projections are on the downside, i.e. that the outlook is more likely to be worse than they expect rather than better than expected. There is a considerable risk that households will increase spending and businesses increase investment by substantially less than is expected given ongoing economic uncertainty. In addition, lockdown measures could stay in place longer than anticipated or be reimposed. Based on estimates reported by the Bank of England these factors could easily cause the unemployment rate to peak in the low teens. Unemployment at levels such as these would take a very long time to unwind. A period of sustained high unemployment remains a substantial possibility.
With 7 1/2 million employees being supported by the Job Retention Scheme the biggest risk to the outlook or unemployment is the manner in which this support is unwound. The Government will need to be
skilful so as to avoid the winding down of this scheme resulting in furloughed workers moving into open unemployment rather than back to working for their existing employer. A new report by a coalition of labour market experts, including from the Learning and Work Institute, sets out how to avoid this risk and how to reverse the rise in unemployment and get Britain back to work.
The national claimant count rose by 856,500. This takes account of normal seasonal effects but adjusted figures are not published for local areas. The actual number of claimants, nationally, has risen by 851,600 in the month to April.
The youth claimant count rose
sharply by 60.9% in the month. This was slightly smaller than the rise for 25-49 year olds, where the rise was 75.2%, and for the over-50s at 61.4%.
Self-employment fell by 27,000 this quarter. Involuntary part-time employment has risen by 14,000 this month to 0.9 million.
Employment rose by 211,000 between October to December 2019 and January 2019 to March 2020. In the last 12 months employment rose by 448,000.
Unemployment is up by 58,000 between October to December 2019 and January 2019 to March 2020. and the unemployment rate rose by 0.1 percentage points to 3.9% in the quarter the lowest level since 1975.
Economic inactivity fell by 125,000 between October to December 2019 and January 2019 to March 2020. and the inactivity rate is down by 0.3 percentage points to 20.2% in the quarter.
|
 |
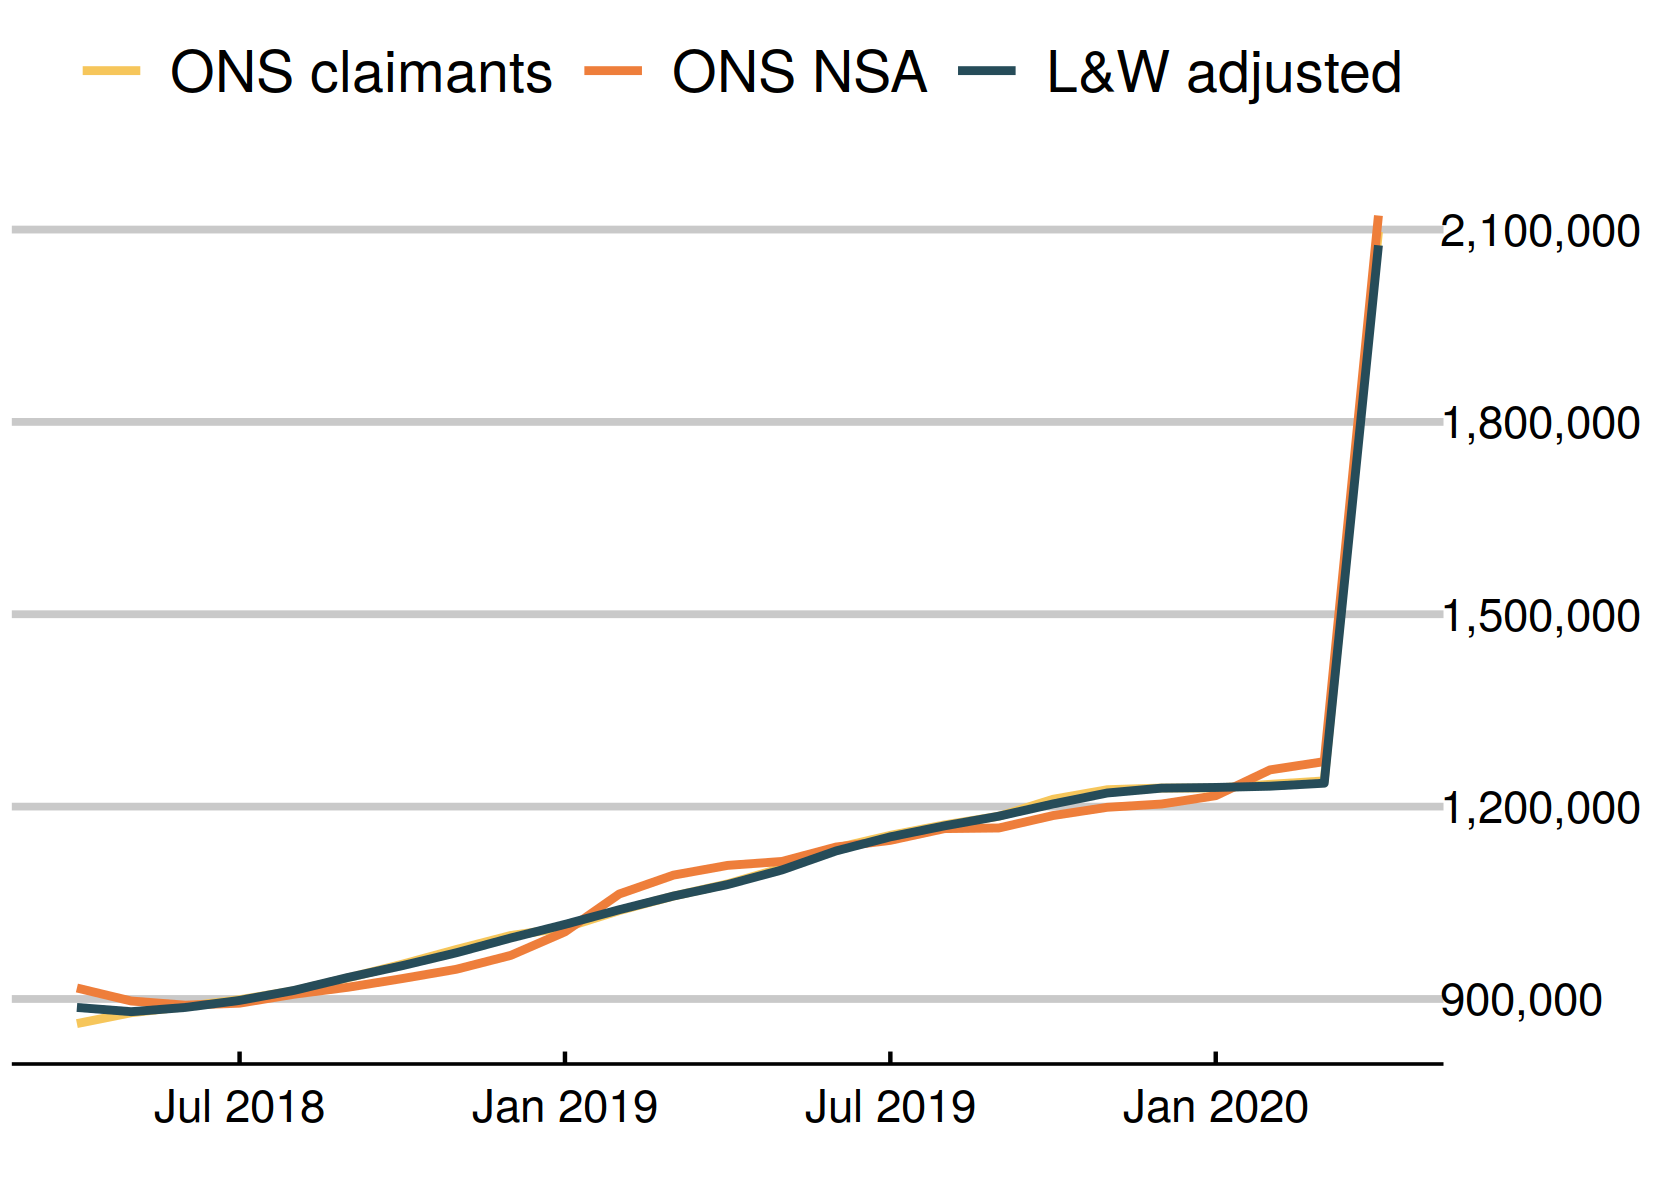
Chart 1: Jobseeker’s Allowance and Universal Credit claimant count
The ONS headline Jobseeker’s Allowance and Universal Credit claimant count increased by 856,481 in April, taking the total to 2,096,603. ONS' claimant count before seasonal adjustment rose by 851,641 to 2,121,855.
 |
|
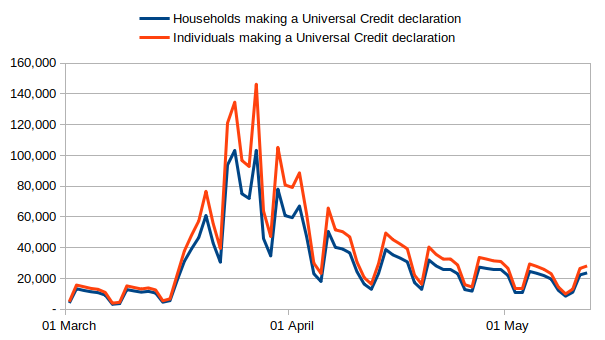
Chart 2: Universal Credit new claims
DWP have announced that, since Universal Credit claims started rising on 16th March, they have taken 2,619,000 individual claims, representing 2,042,560 families.
 |
|
Chart 3: Youth unemployment
The number of unemployed young people has risen by 2,000 since last month’s figures, to 516,000.
Meanwhile, the number of young Universal Credit or Jobseeker’s Allowance claimants sharply rose last month by 143,077, to 378,139. 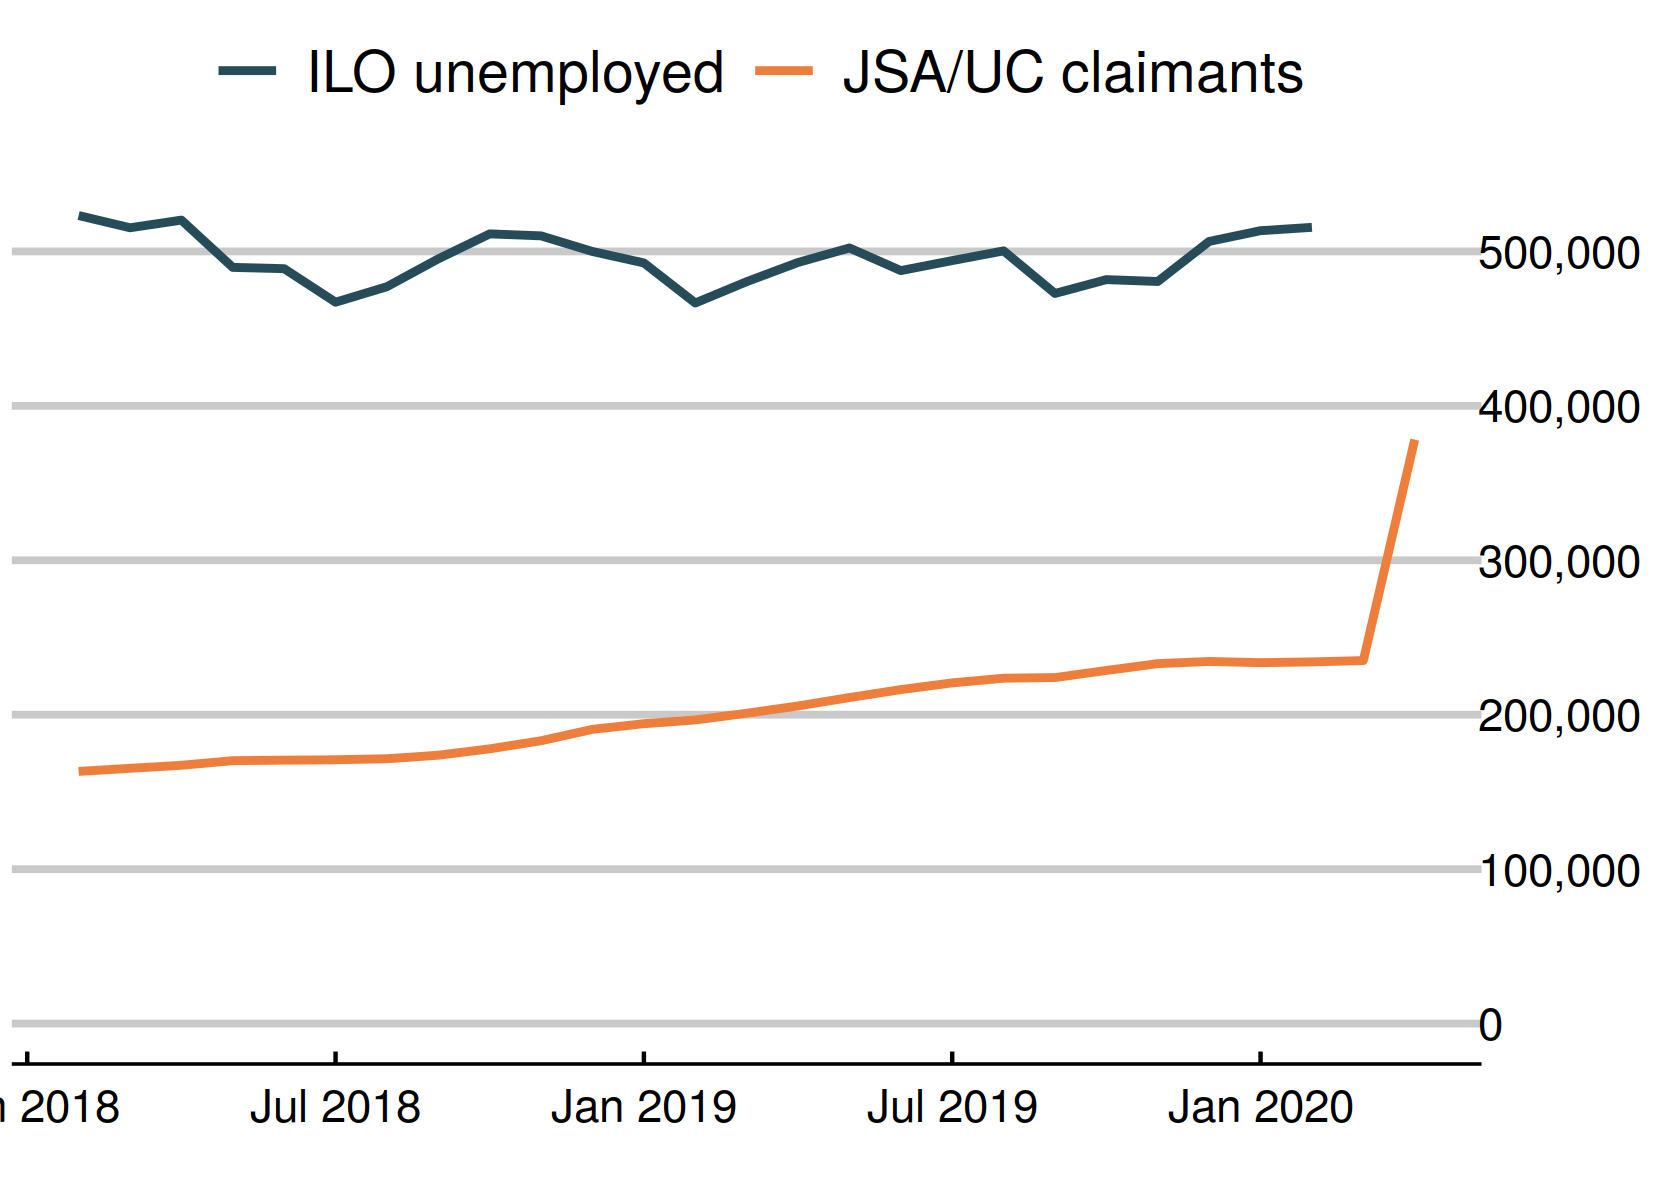 |
|
Chart 4: Vacancies – whole economy survey
Vacancies (in the Office for National Statistics survey of the whole economy) fell sharply this month, to 637,000. As the number of vacancies is quite volatile, and frequently revised, the Office for National Statistics uses a three-month average. 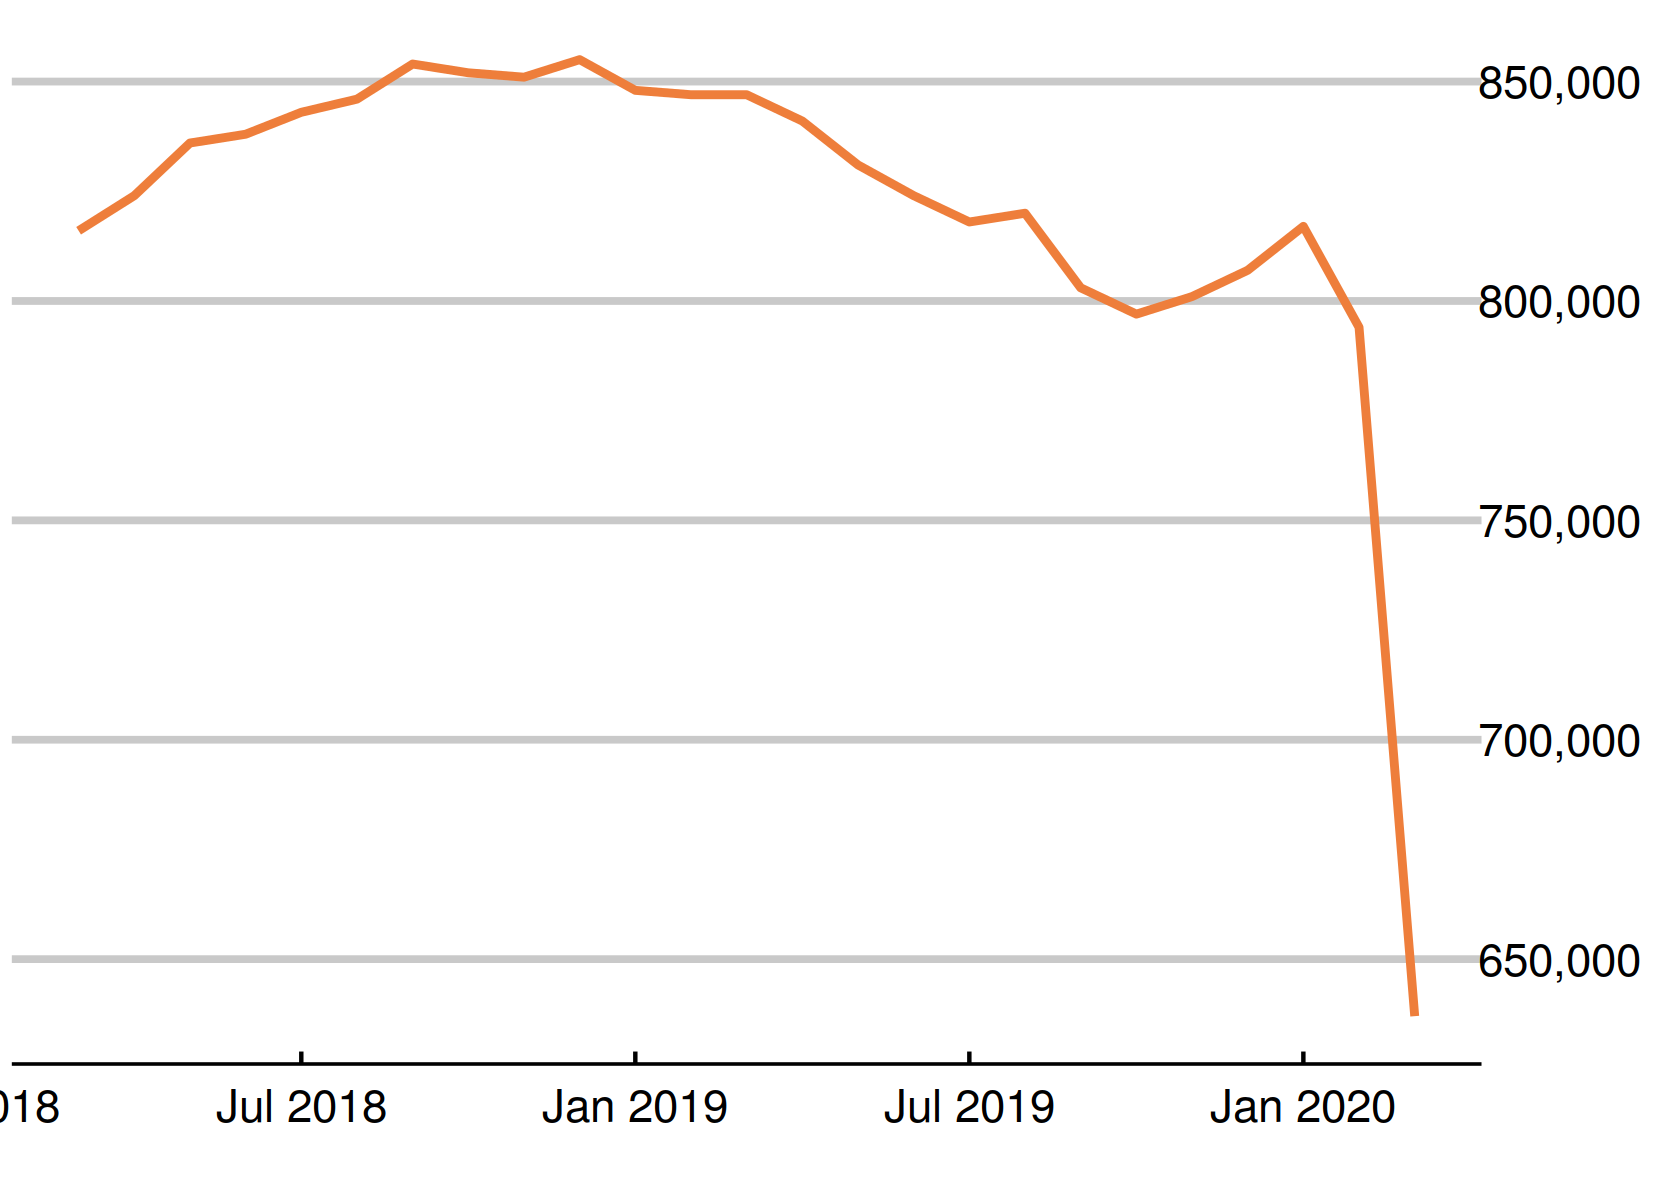 |
|
Chart 5: Experimental single month vacancies – whole economy survey
The Office for National Statistics has published experiental single month vacancy estimates. These fell even more sharply this month than the official series, by 399,000, to 351,000 or a fall of 53.2%. As these are not seasonally adjusted, it is fairer to use an annual change, where the fall was even bigger at 59.4% 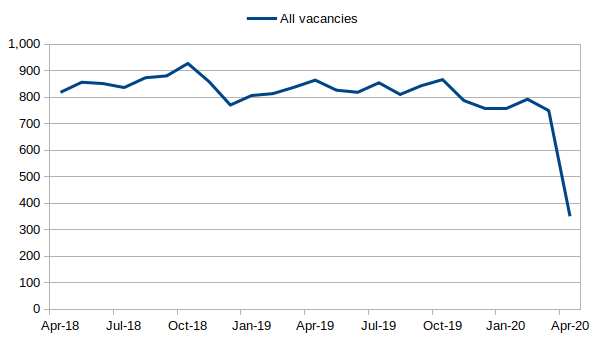 |
|
Chart 6: Experimental single month vacancies – by industry
The experimental single month vacancy estimates include industry detail. Vacancies fell in every sector, with falls of over 85% in the year for construction, motor trades and accommodation and food services. The smallest falls were in 'key worker' sectors, with an annual fall of 23% in human health and social work activities. 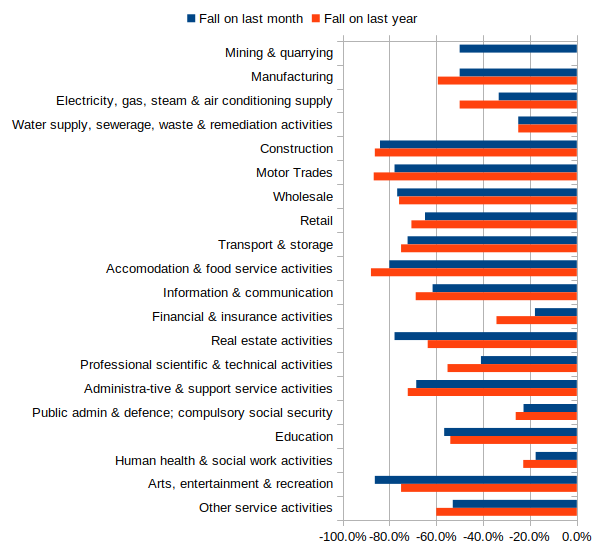 |
|
Chart 7: UK unemployment (ILO)
The latest unemployment figure is 1,348,000. It has decreased by 17,000 from the figure published last month. The unemployment rate fell by 0.1 percentage points to 3.9%. 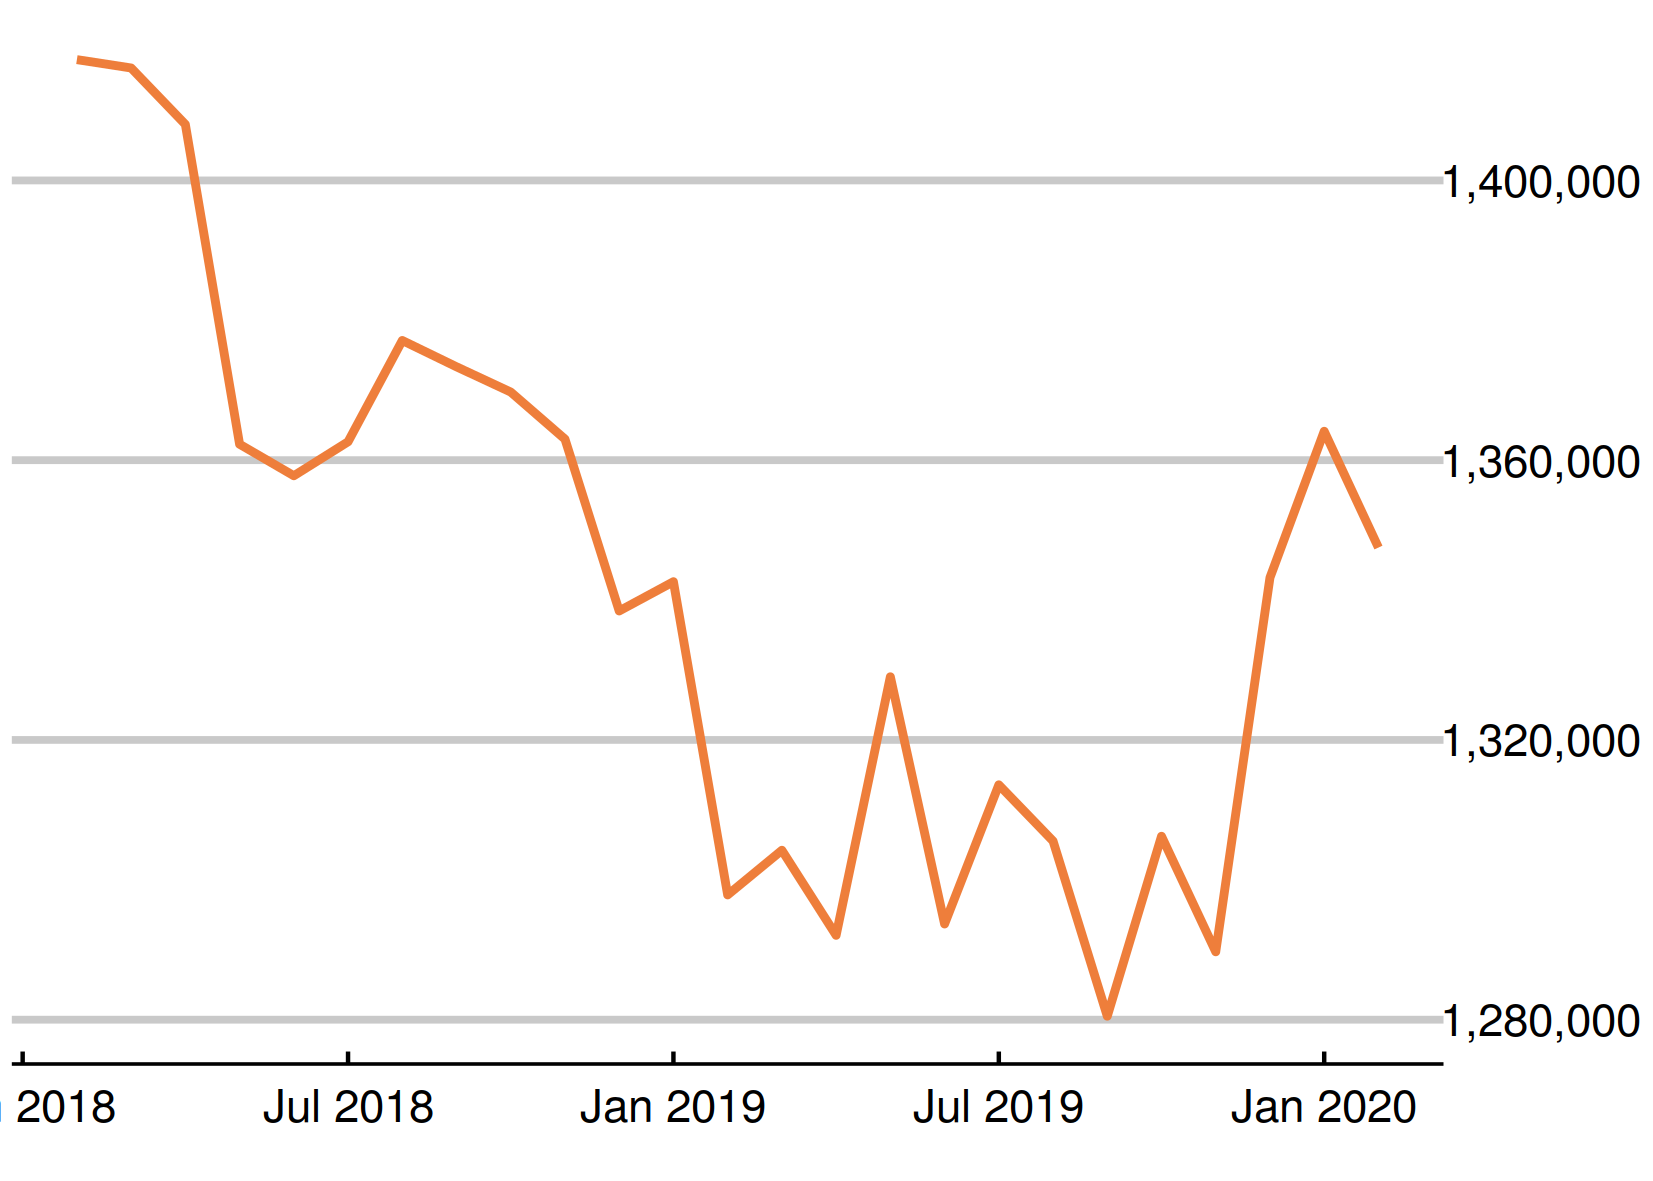 |
|
Chart 8: Percentage unemployed not claiming Jobseeker’s Allowance
The proportion of unemployed people not claiming Jobseeker’s Allowance has is now 8.4%; (113,000). 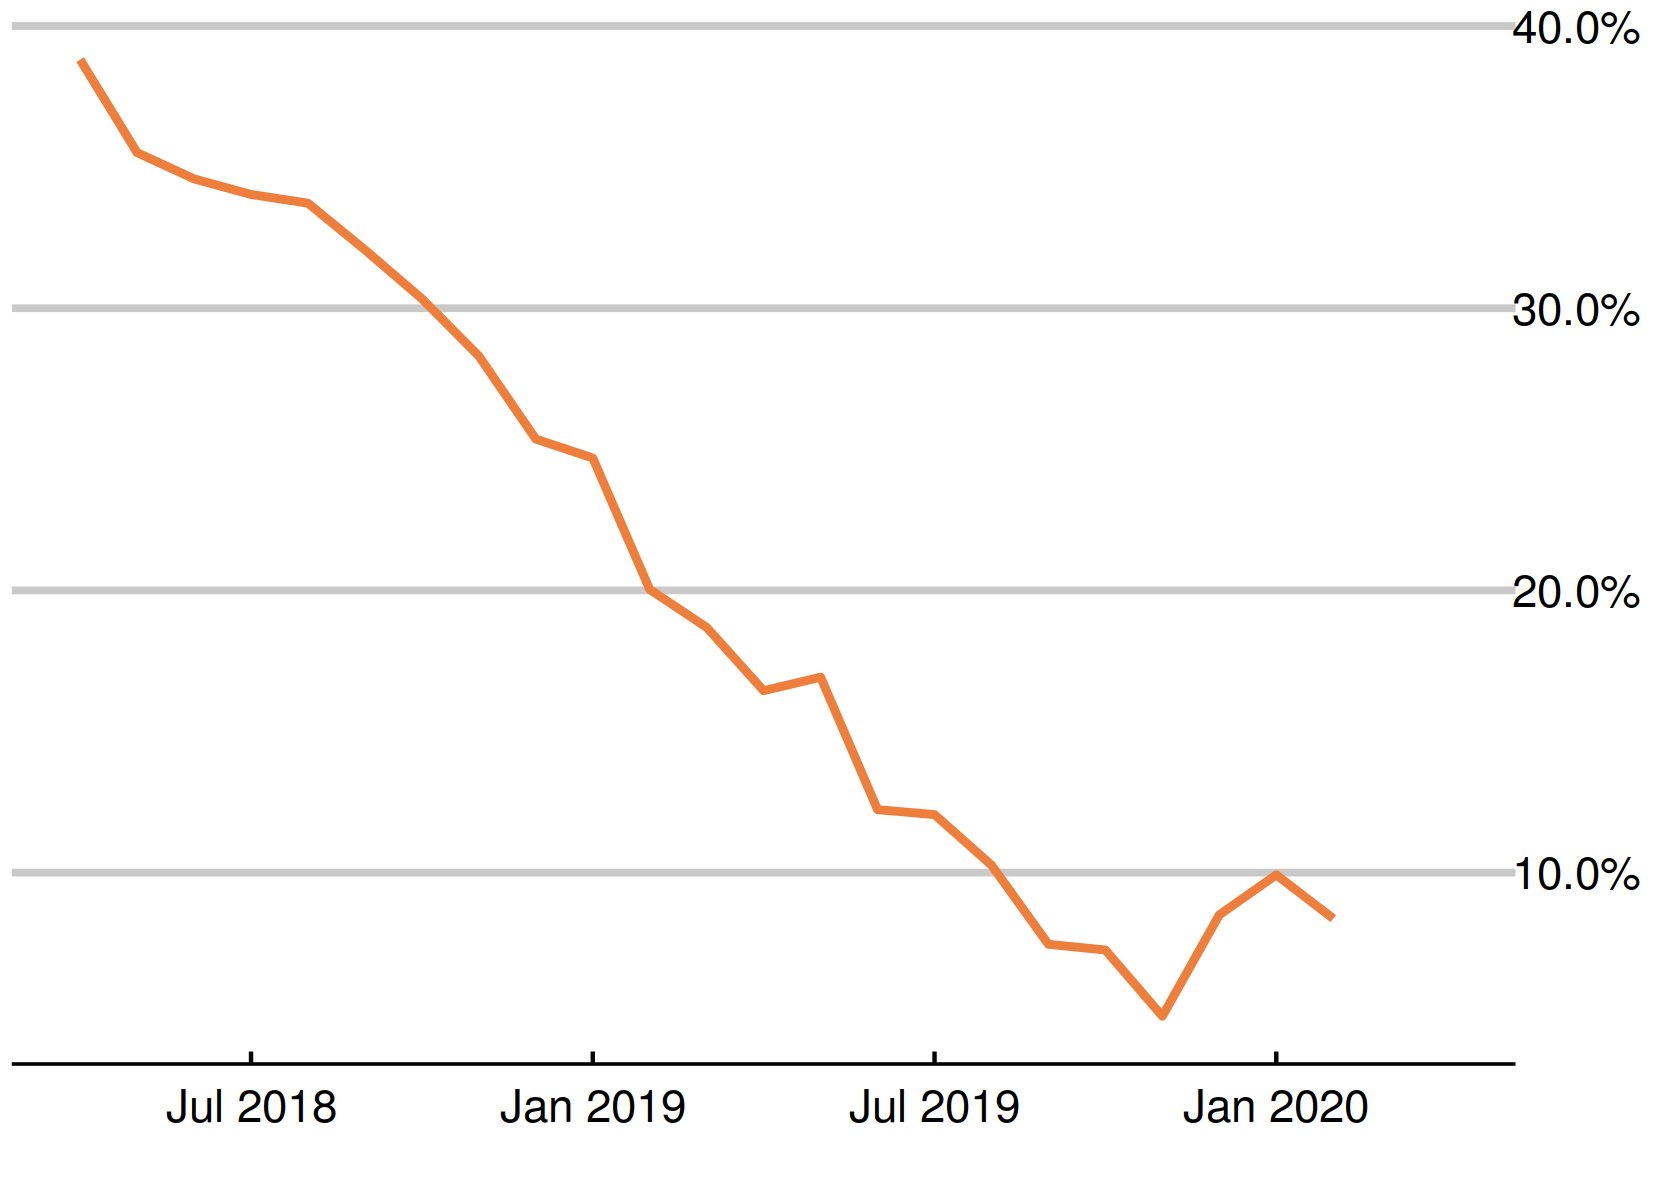 |
|
Chart 9: Youth long-term unemployment (six months and over, 18-24)
Youth long-term unemployment (which can include students) has risen by 4,000 from last month’s figure and is now 125,000.
The youth long-term Jobseeker’s Allowance count (but not UC) remains far behind, at 5,600. The count fell by 300 this month. 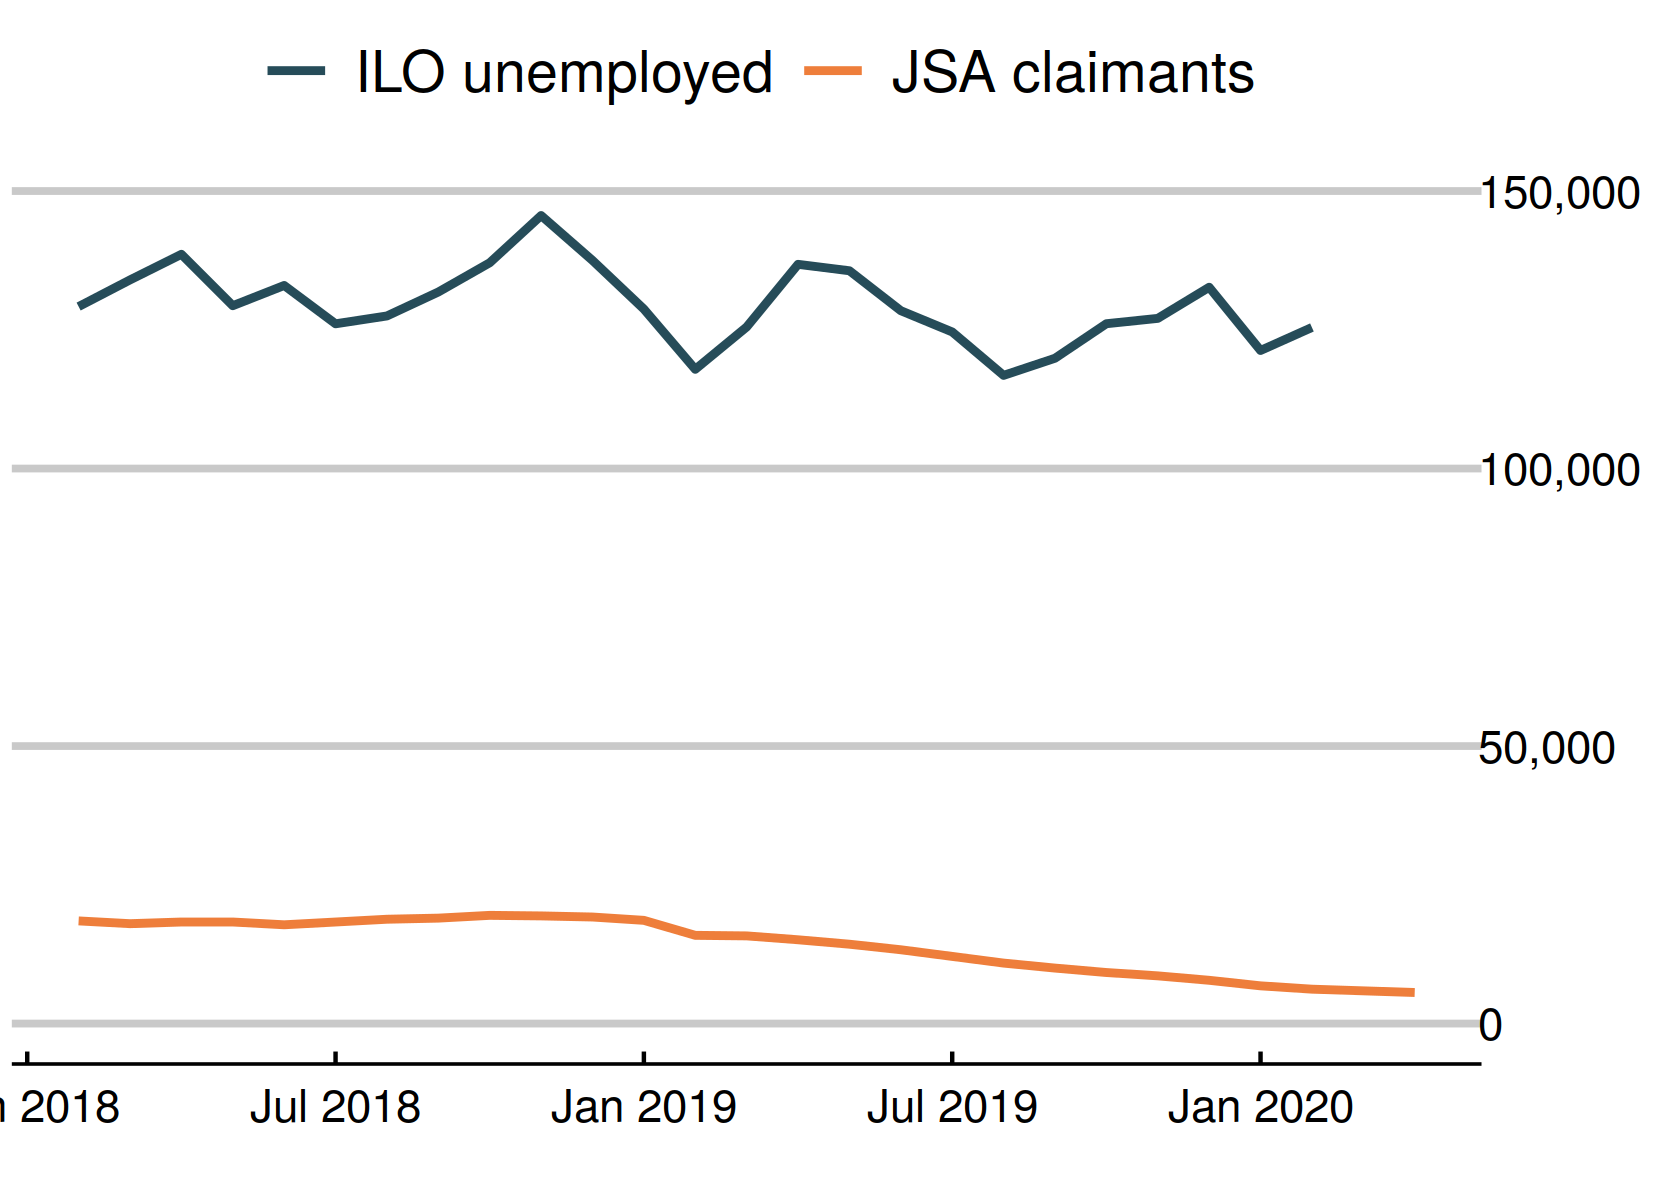 |
|
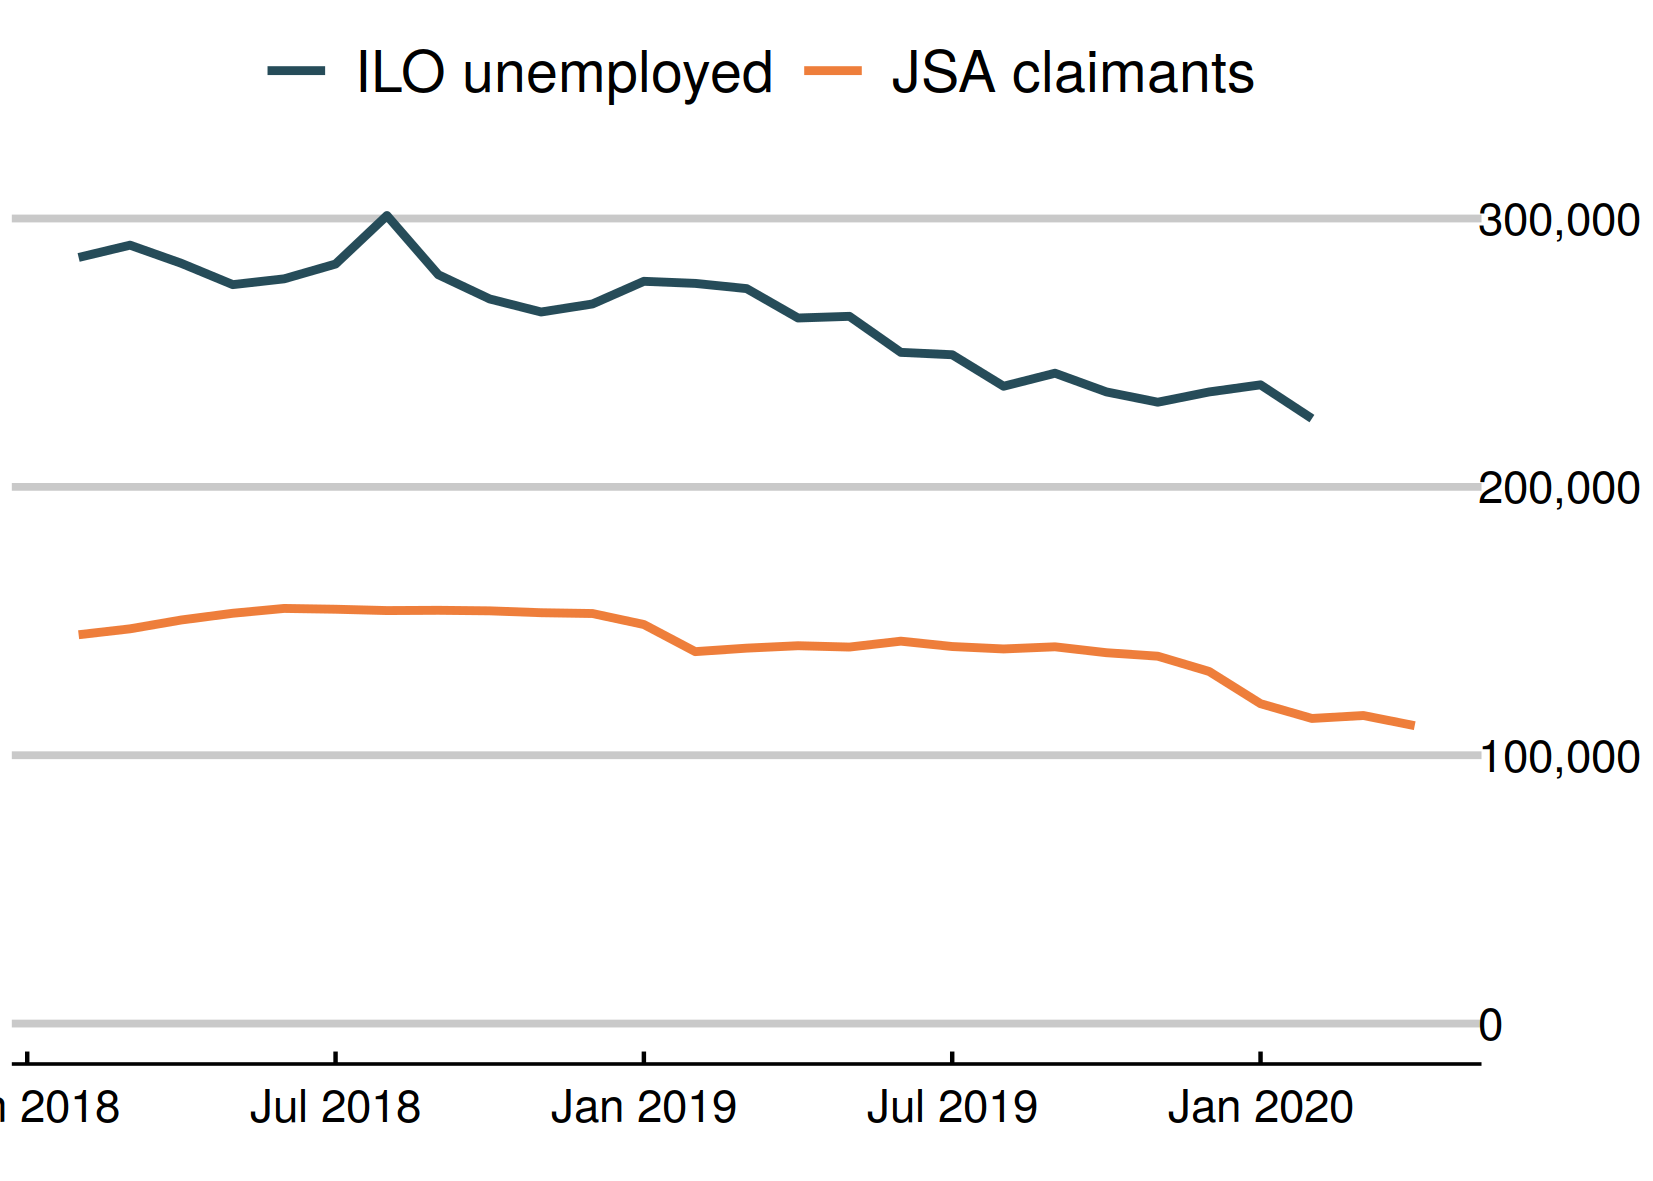
Chart 10: Adult long-term unemployment (12 months and over, 25+)
Adult long-term unemployment on the survey measure is now 225,000. The Jobseeker’s Allowance measure is 111,000.
 |
|
Chart 11: Unemployment rates by age
The 18 to 24 year old unemployment rate (including students) is 10.5% of the economically active – excluding one million economically inactive students from the calculation. The rate for those aged 25 to 49 is 2.8%. For those aged 50 and over it is 2.7%. The quarterly change is up 0.5 for 18 to 24 year olds, down 0.1 for 25 to 49 year olds, and down 0.1 for the over-50s. 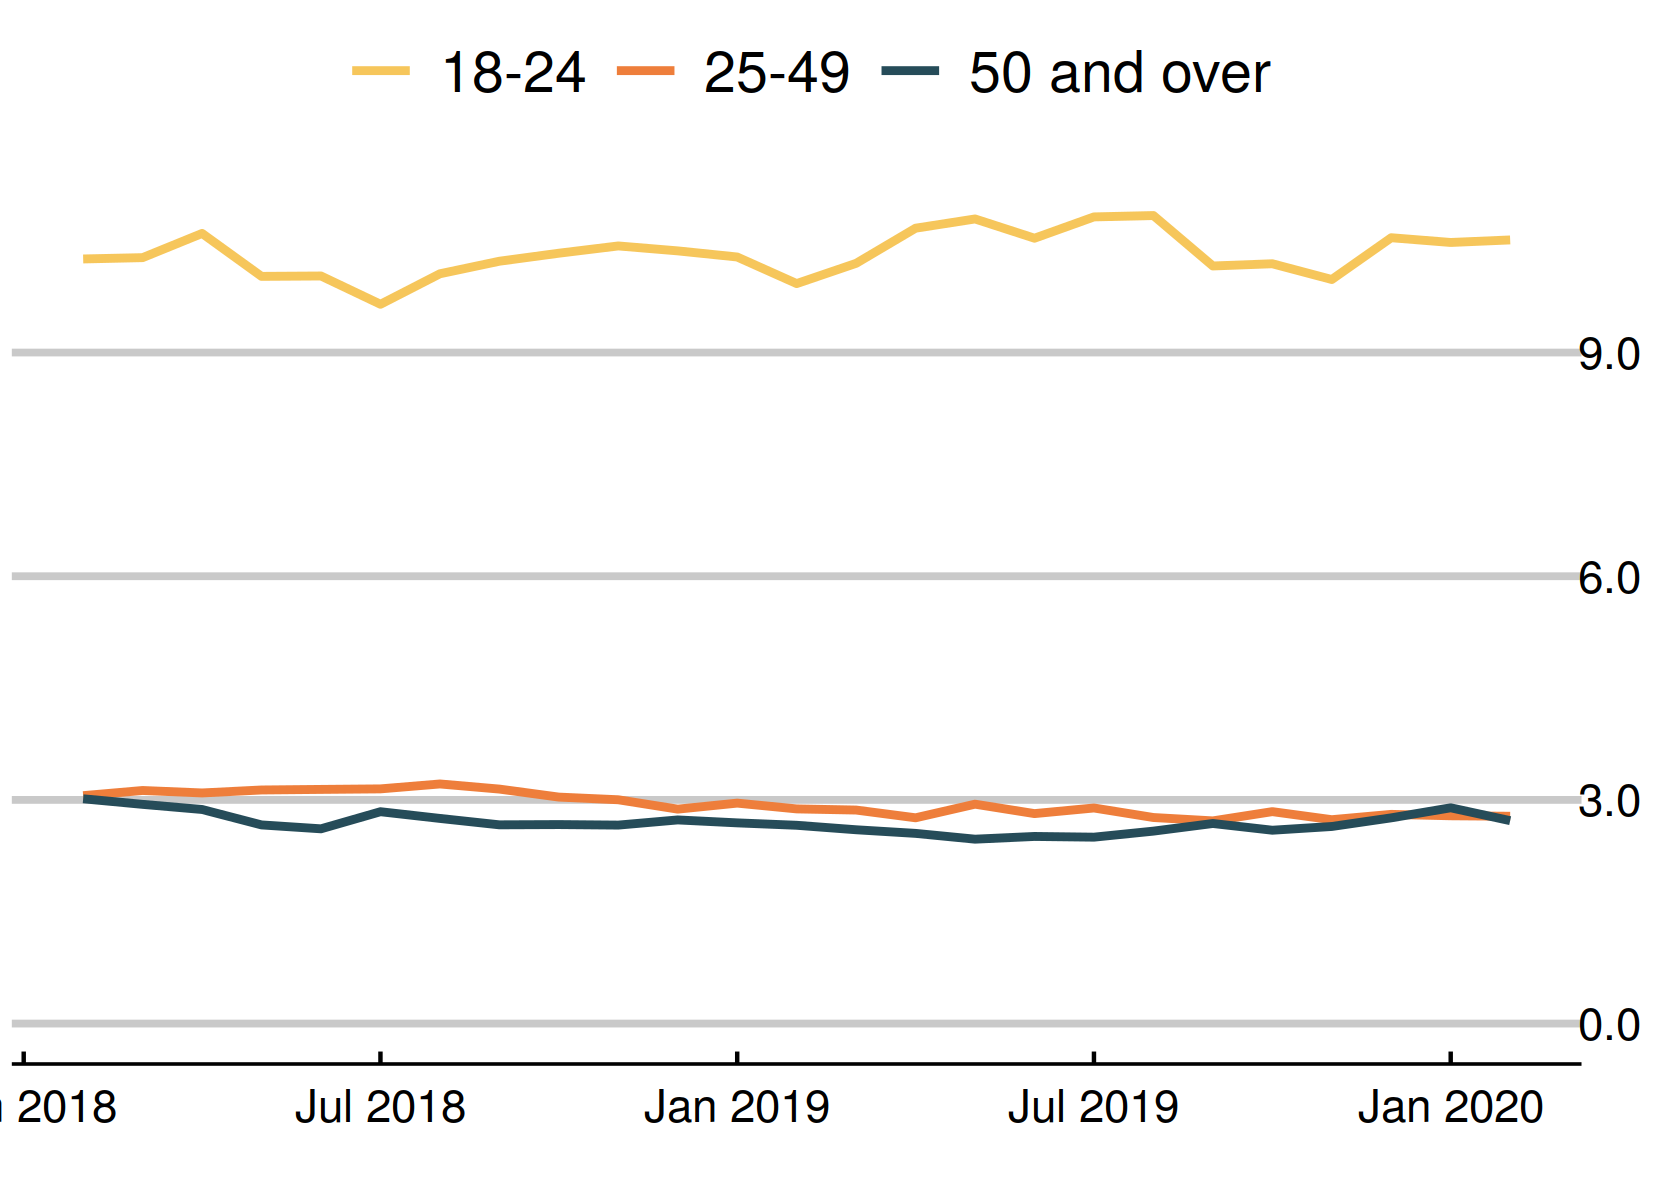 |
|
Chart 12: Young people not in employment, full-time education or training
The number of out of work young people who are not in full-time education (983,000) has fallen in the past quarter by 21,000, or 2.2%. The fall was largely among the inactive, with the number of unemployed young people not in full-time education or training falling at a lower rate. 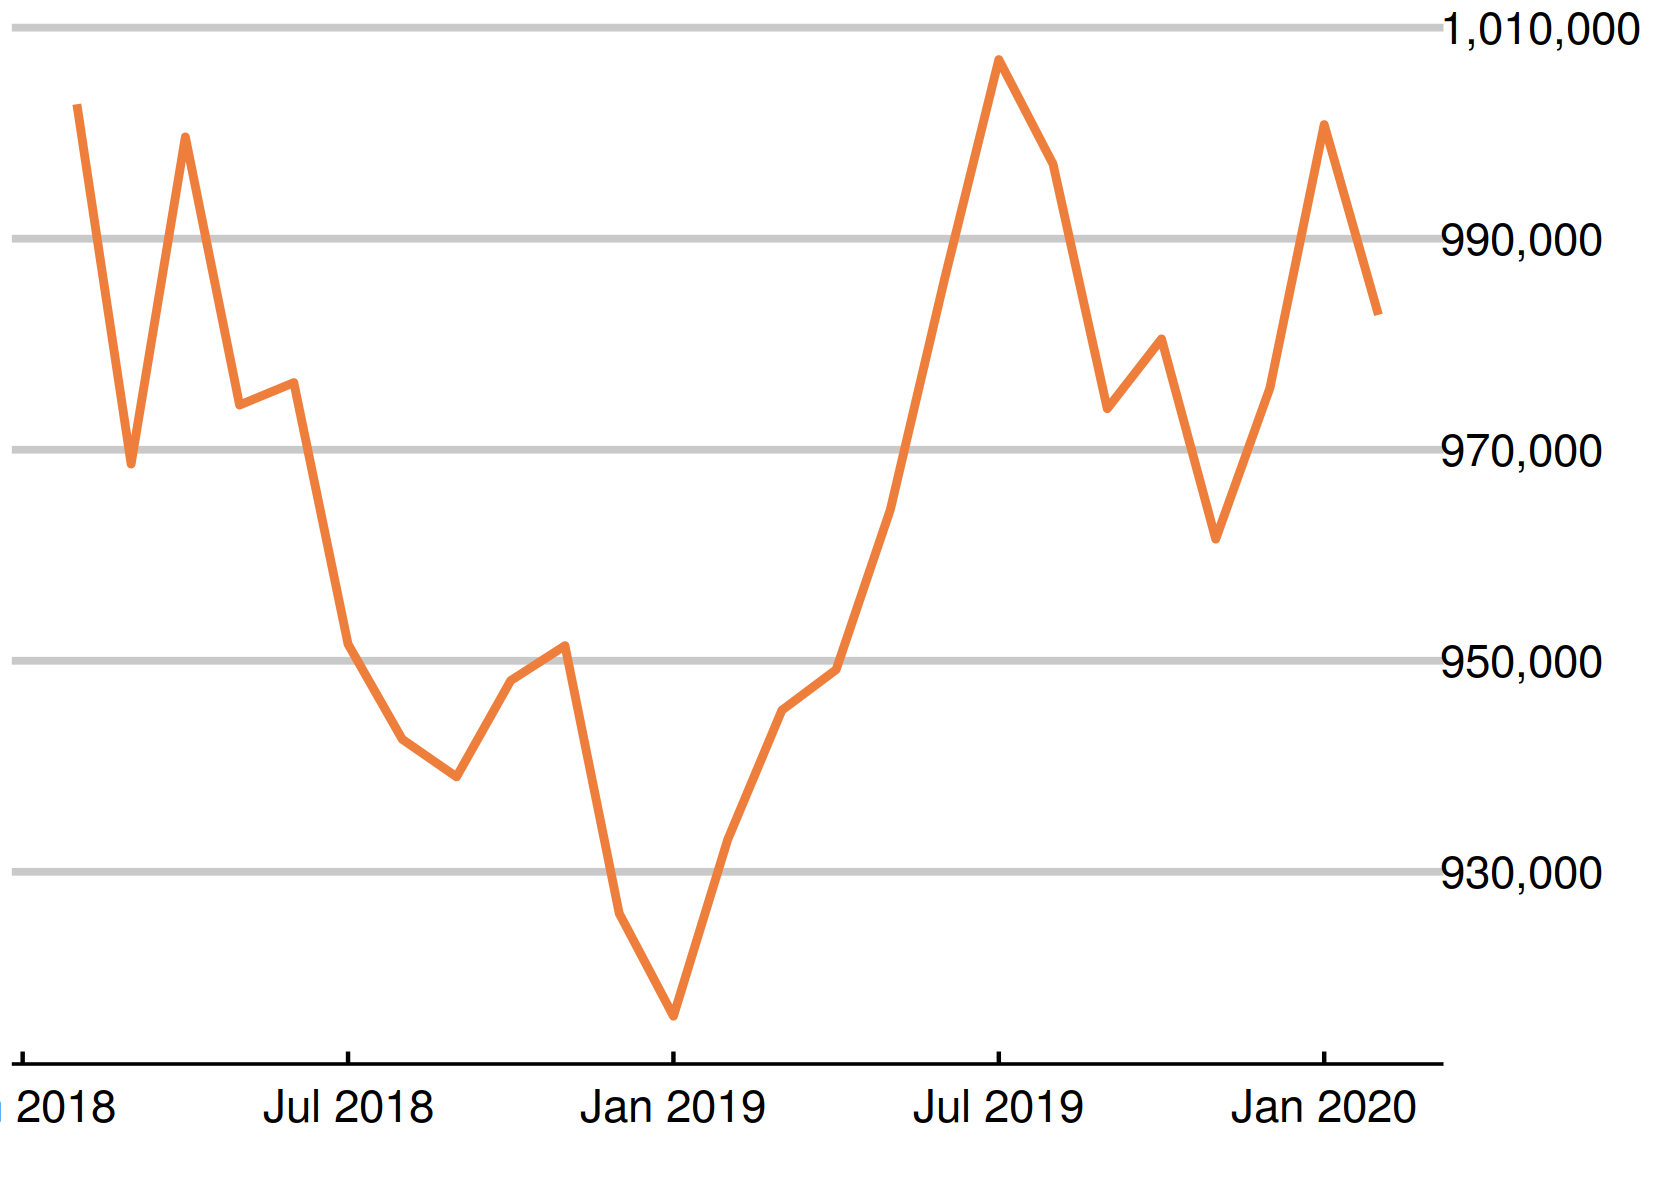 |
|
Chart 13: Unemployed people per vacancy
There are 1.7 unemployed people per vacancy. 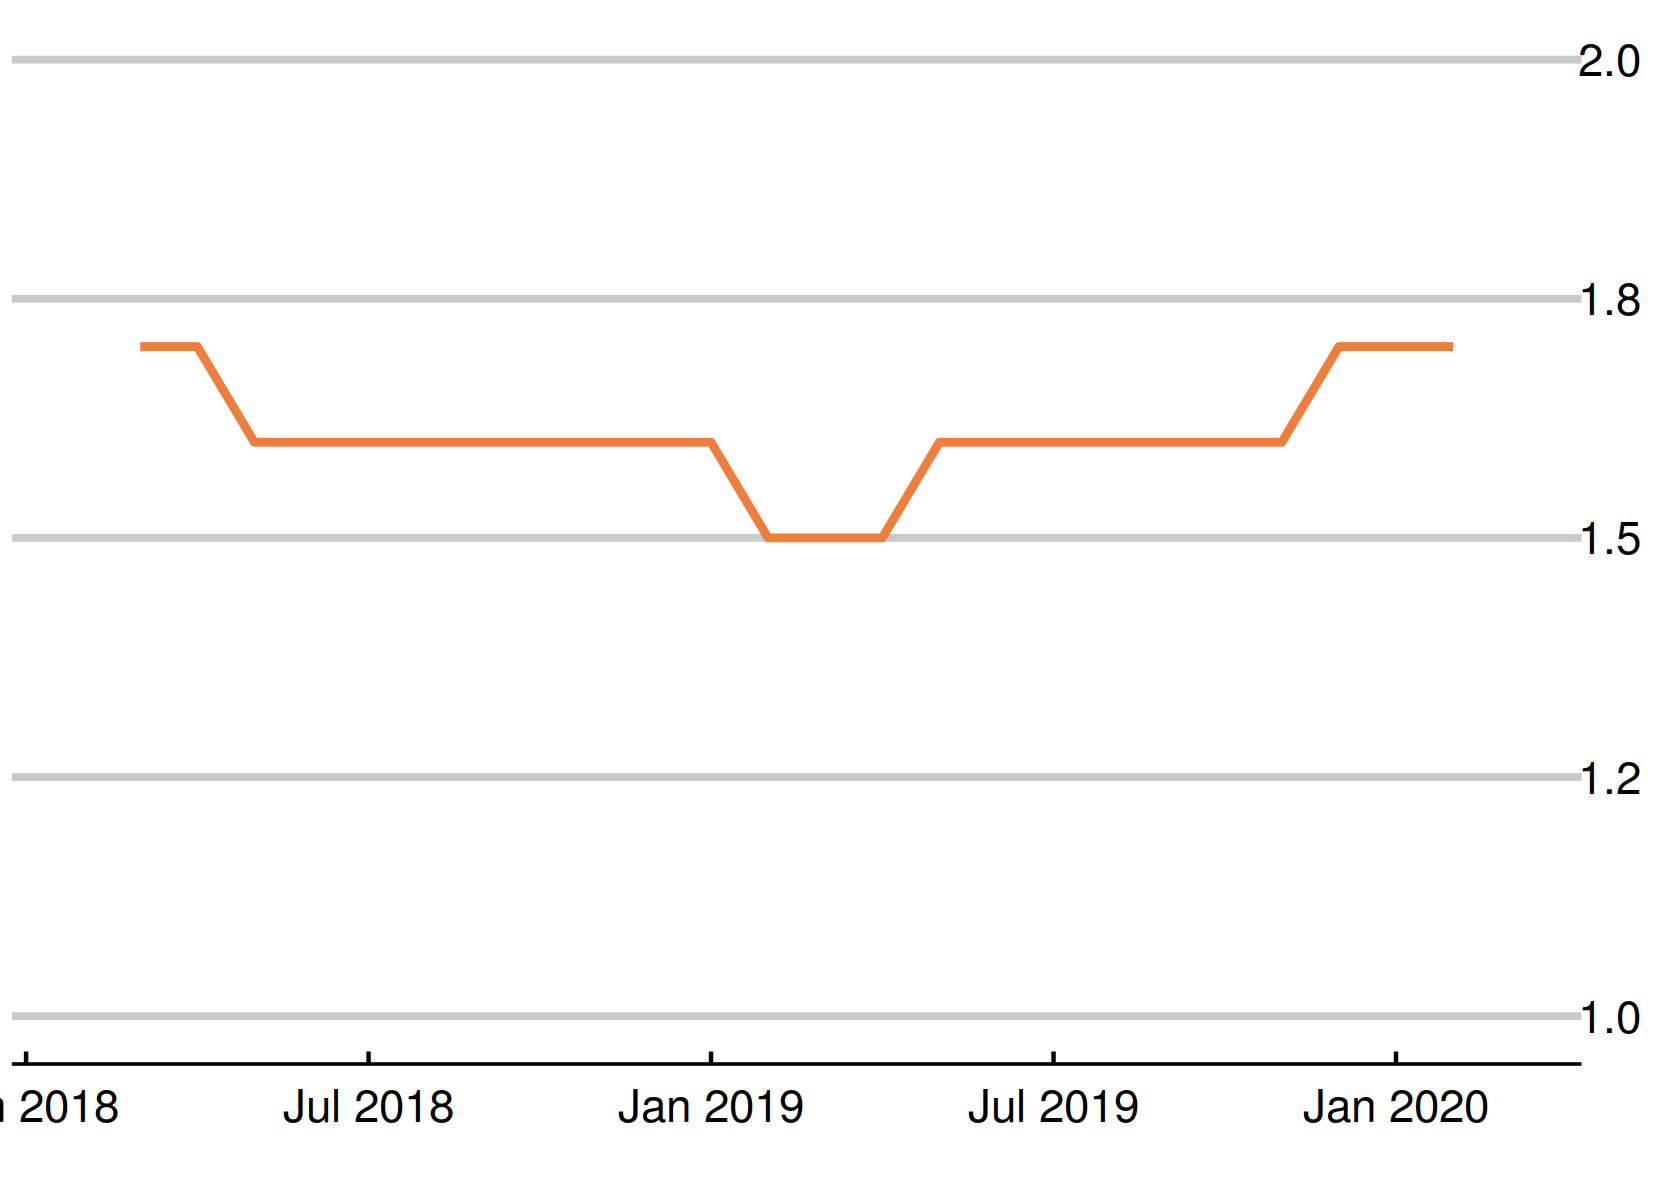 |
|
Chart 14: UK employment
Employment rose by 71,000 on the figure published last month, to 33,144,000. 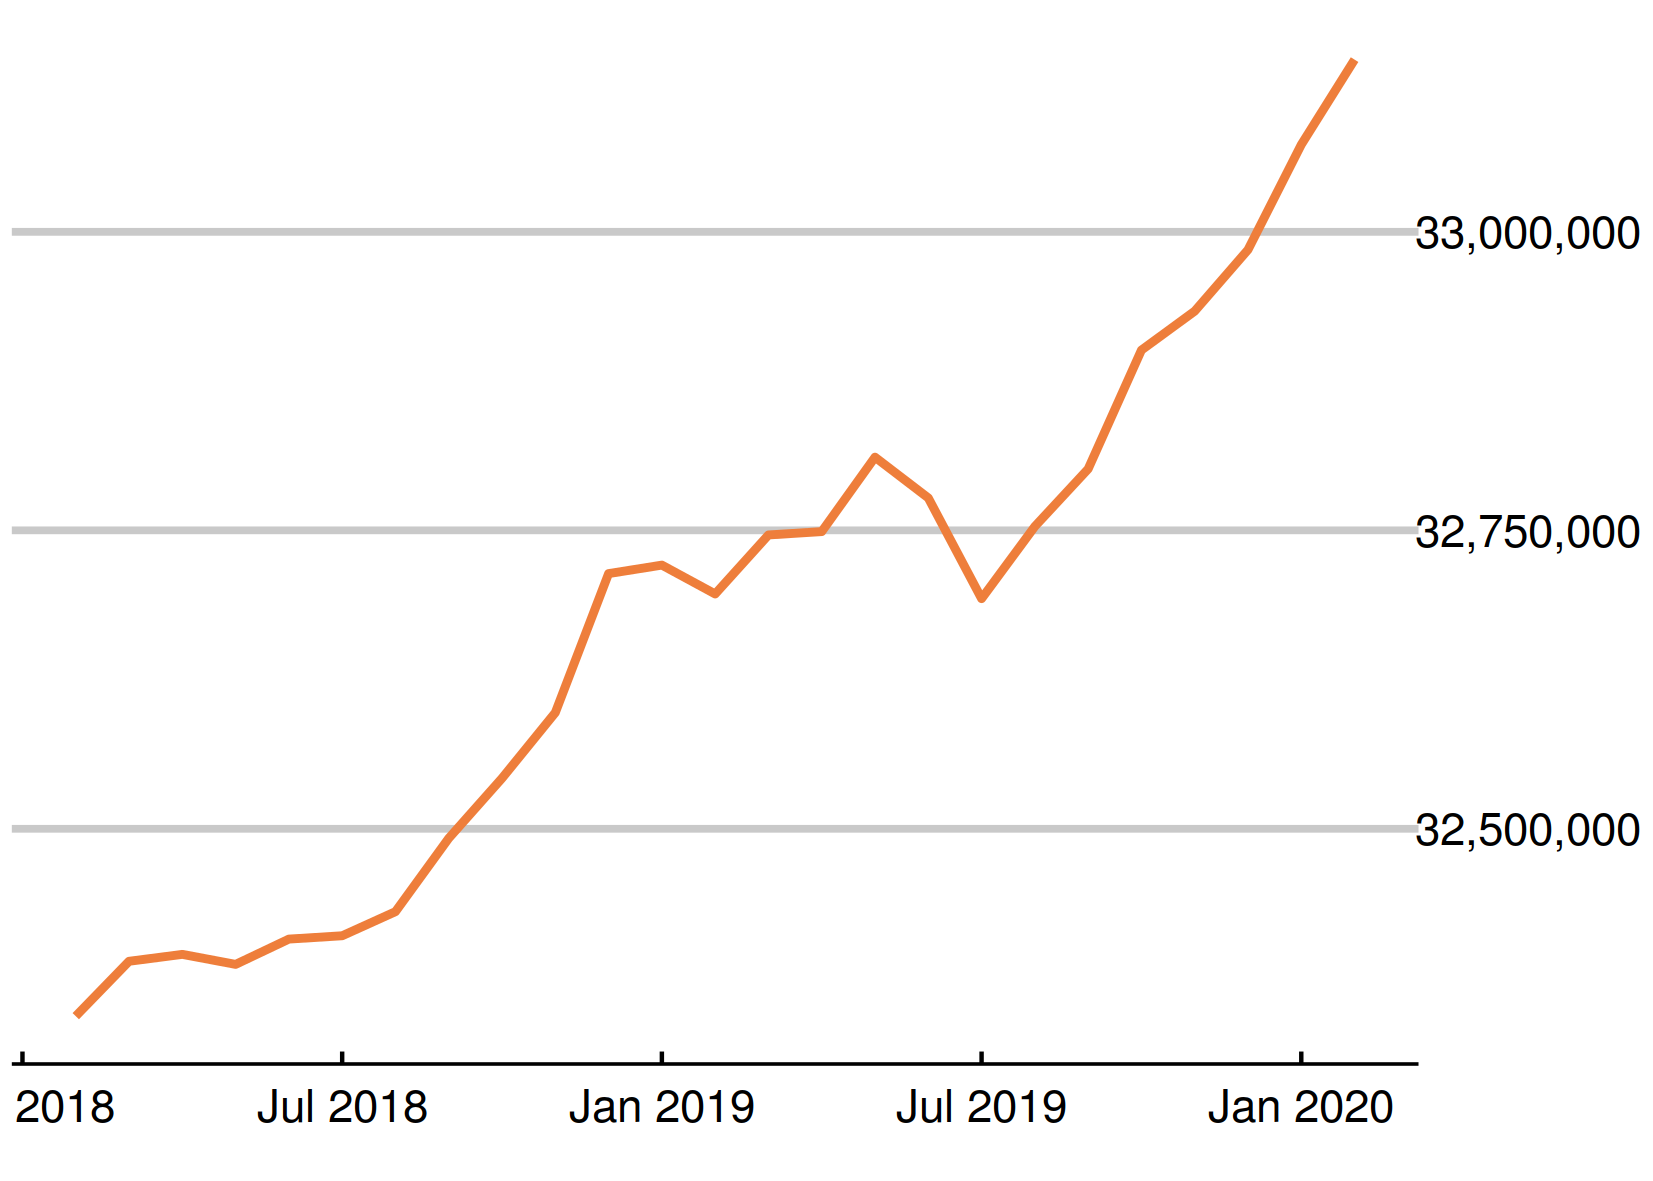 |
|
Chart 15: Employment rate in the UK
The employment rate is up by 0.2 percentage points over the quarter, to 76.6%. 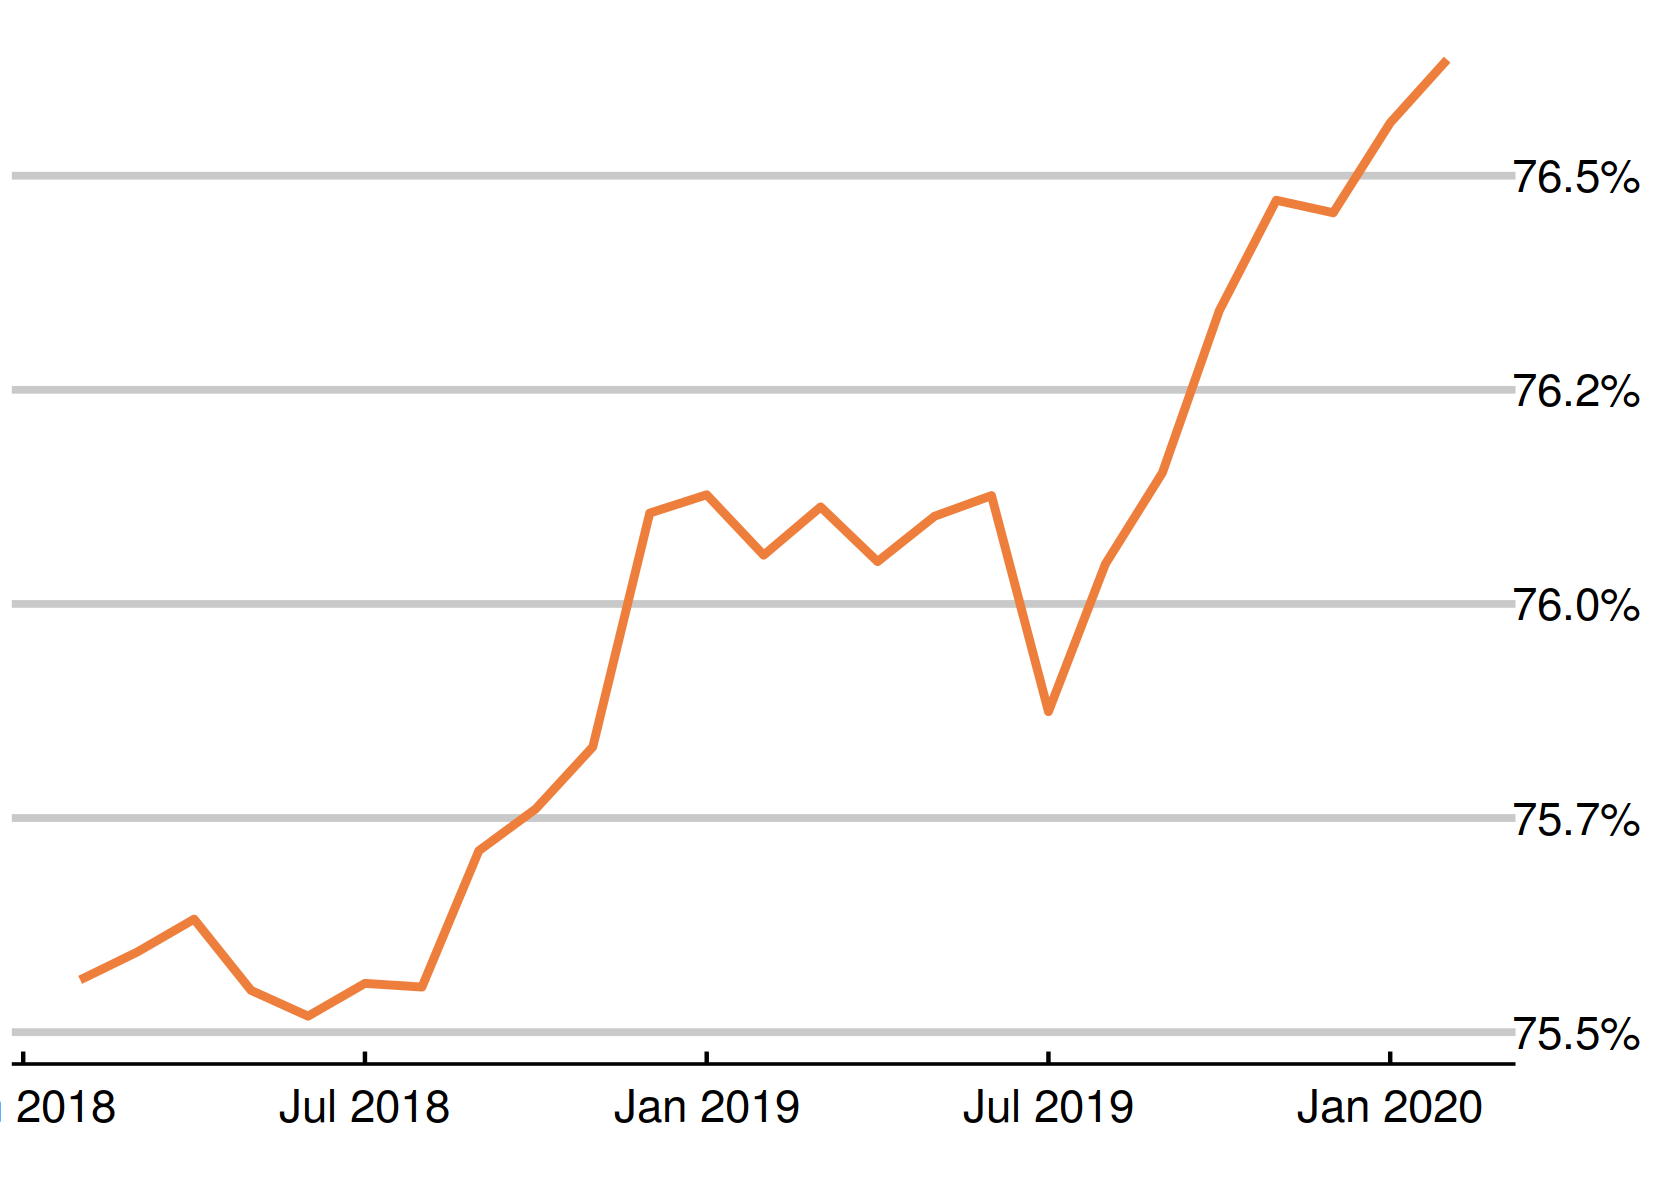 |
|
Chart 16: Claimants for inactive benefits and the economically inactive – inactivity benefits
The number of people inactive owing to long-term sickness fell, as did the benefit figure.
This chart shows claimants of Employment and Support Allowance, and Universal Credit planning for work and those with no work requirements (both out of work) (the orange dots), compared with survey figures for the economically inactive owing to long-term sickness. 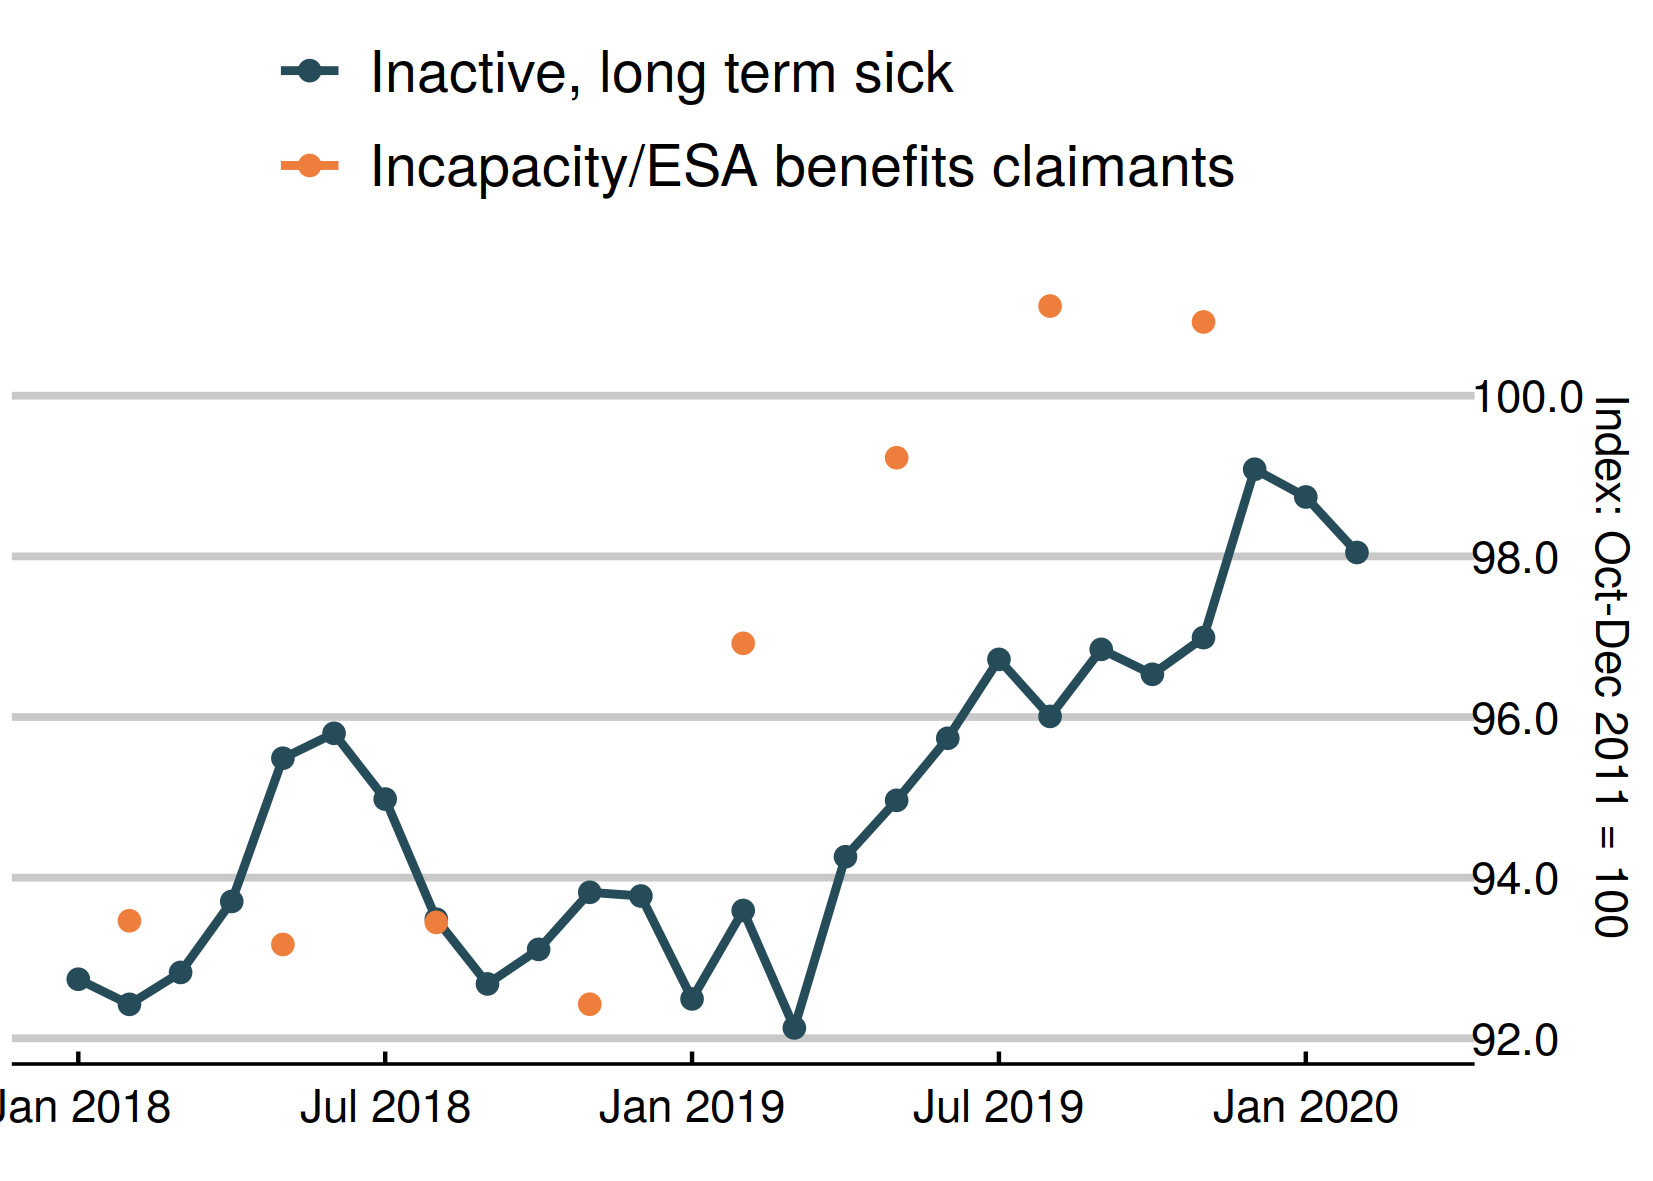 |
|
Chart 17: Claimants for inactive benefits and the economically inactive – lone parents
This chart shows claimants of out of work benefits as lone parents (the orange dots) and survey figures for all those who are economically inactive looking after family (including couple families). The survey figures (showing those looking after family) continued to fall while benefit measures had fallen earlier.
The benefit figures include lone parents remaining on Income Support as lone parents and Universal Credit claimants in the planning for work group. The latest DWP data does not show any still on Jobseeker's Allowance.
This chart shows claimants of out of work benefits as lone parents (the
orange dots) and survey figures for all those who are economically inactive looking after family (including couple families). 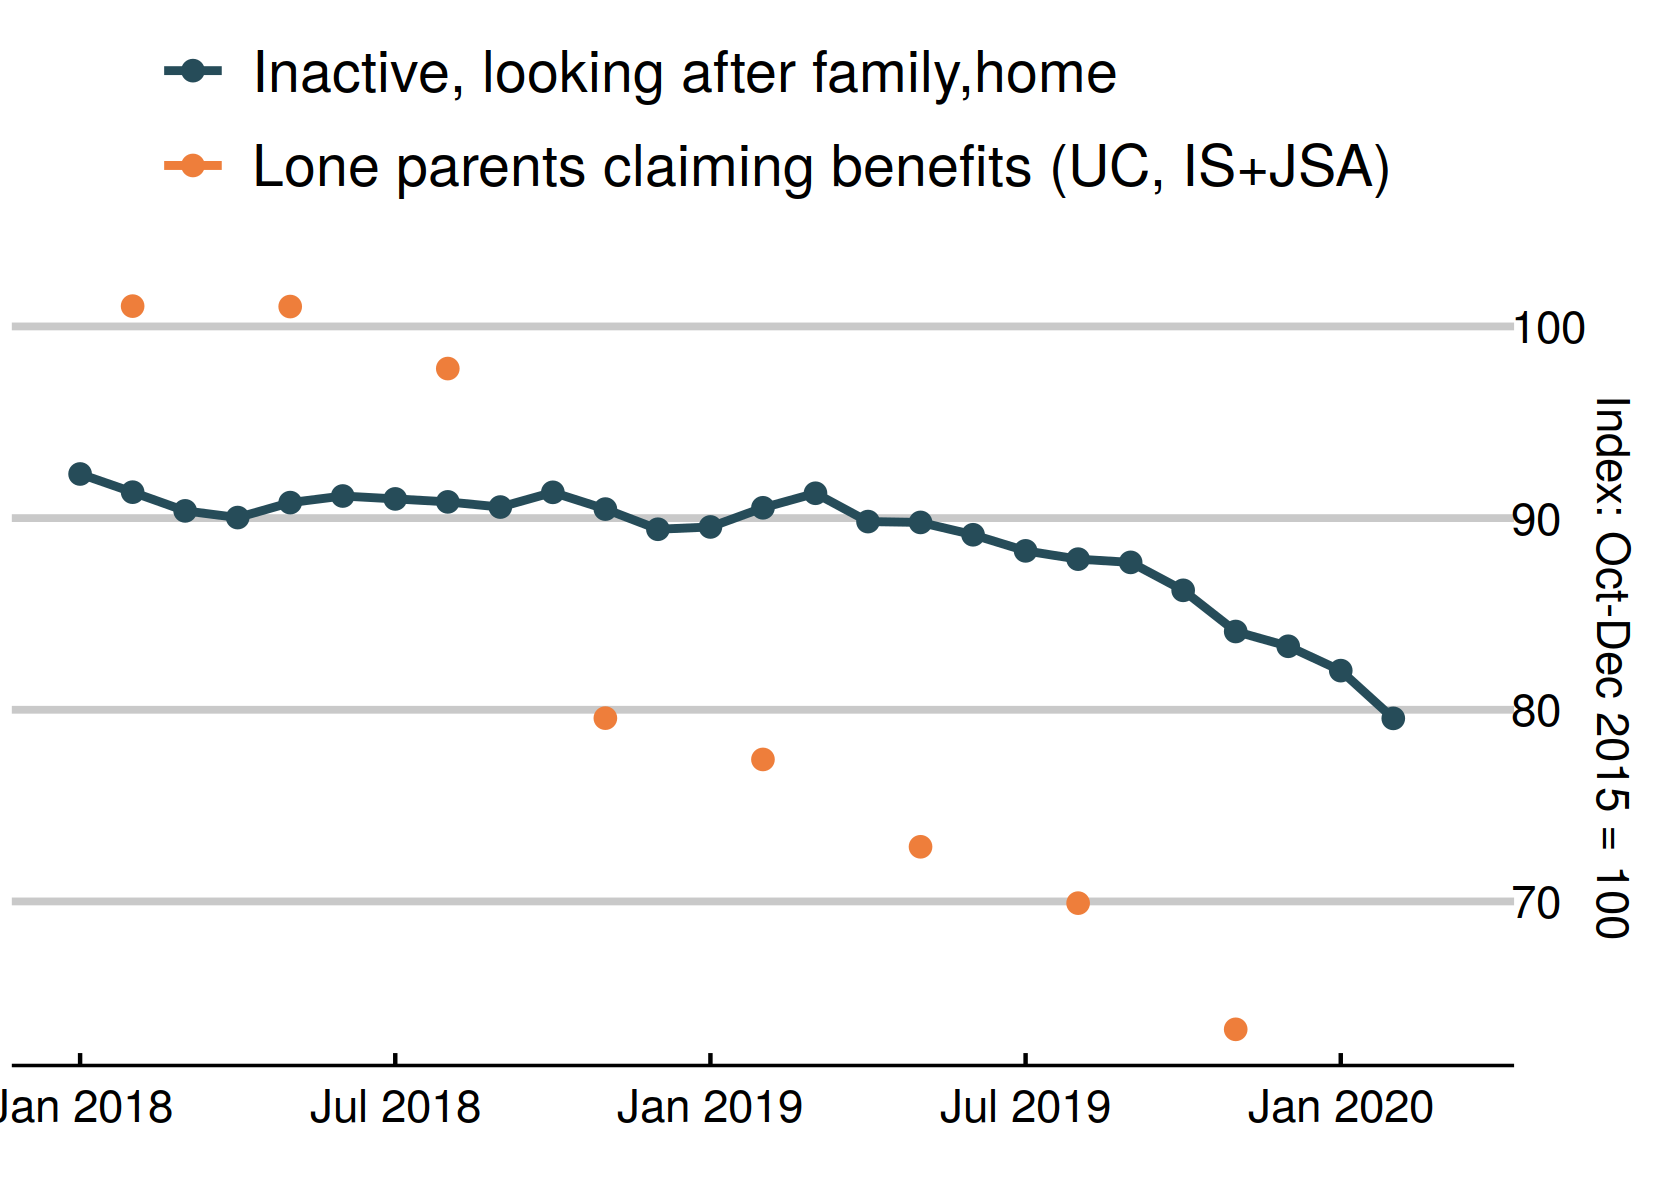 |
|
Chart 18: Employment rate quarterly change in regions – January 2019 to March 2020
This quarter, 6 regions showed a rise in the employment rate, led by the North East and London. The employment rate fell in 6 regions, led by the East and South West. 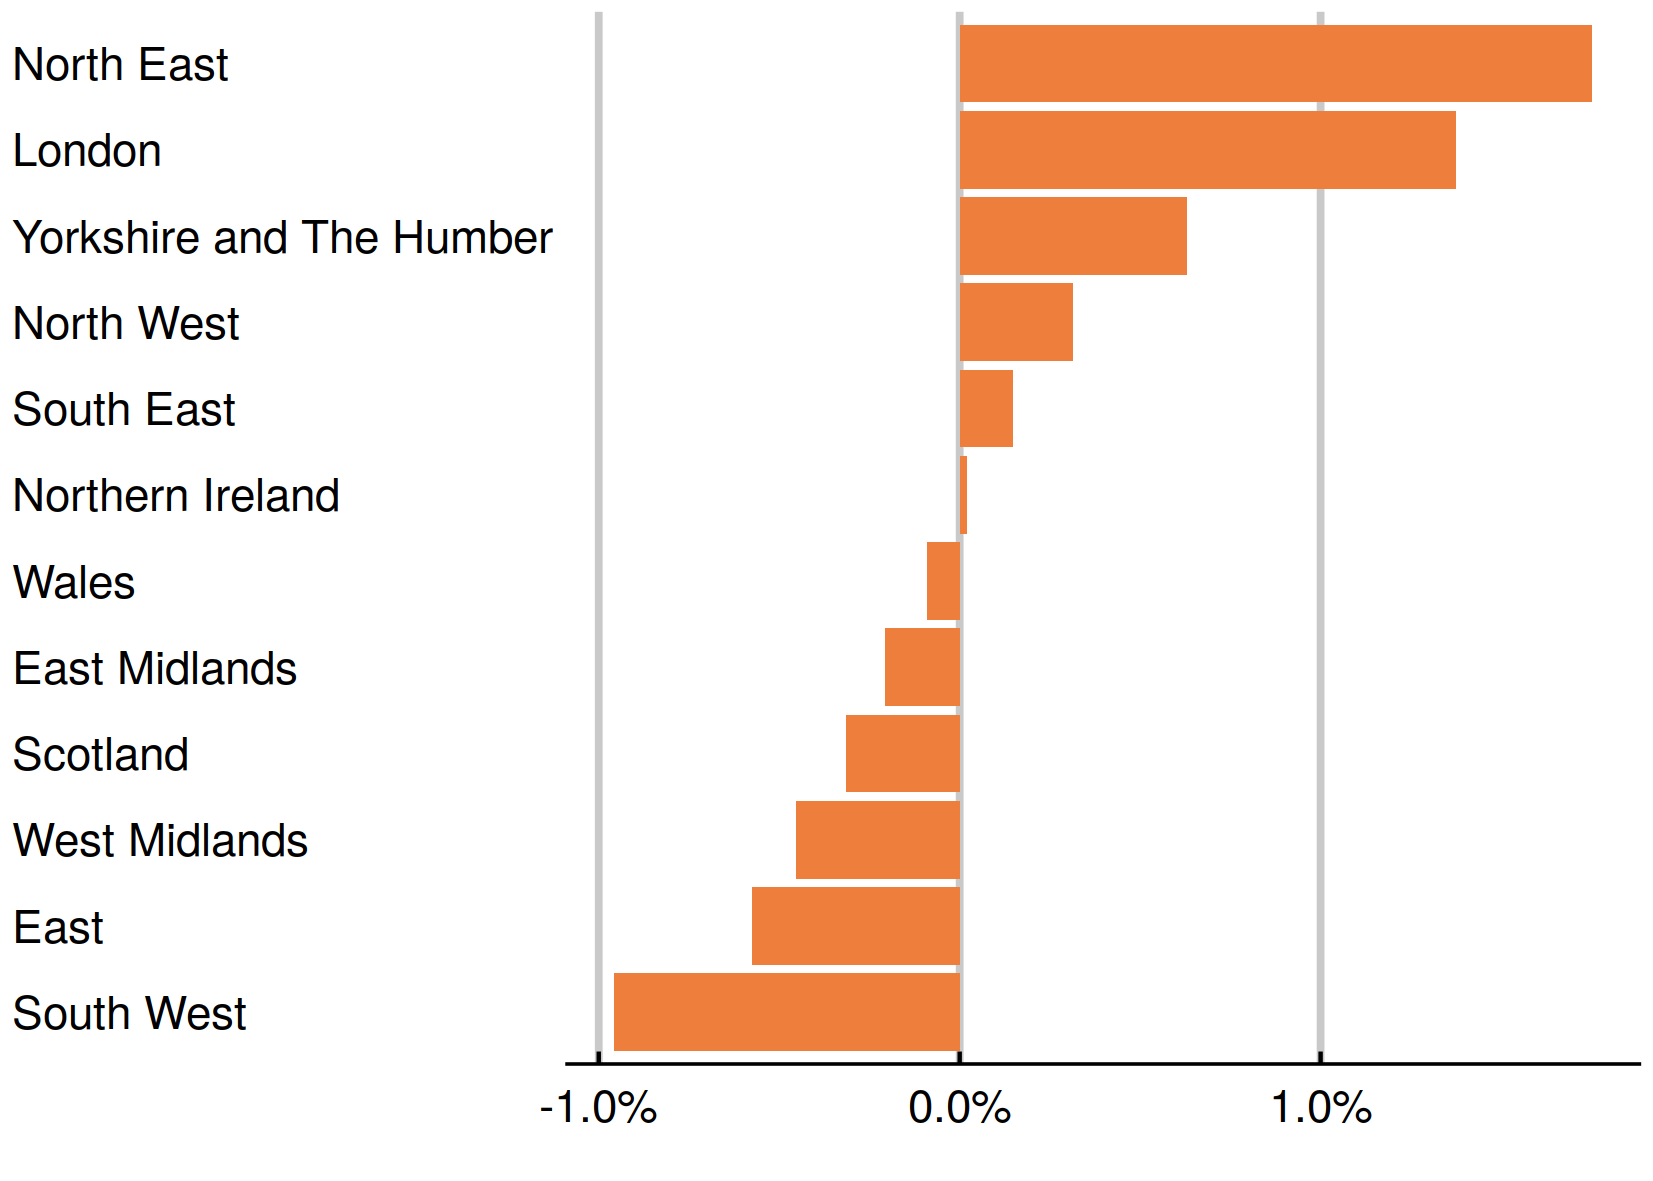 |
|
Chart 19: Unemployment rate quarterly change in regions – January 2019 to March 2020
Five regions showed an improvement in the unemployment rate this quarter. Seven showed a worsening. The rises were led by Scotland and the West Midlands. 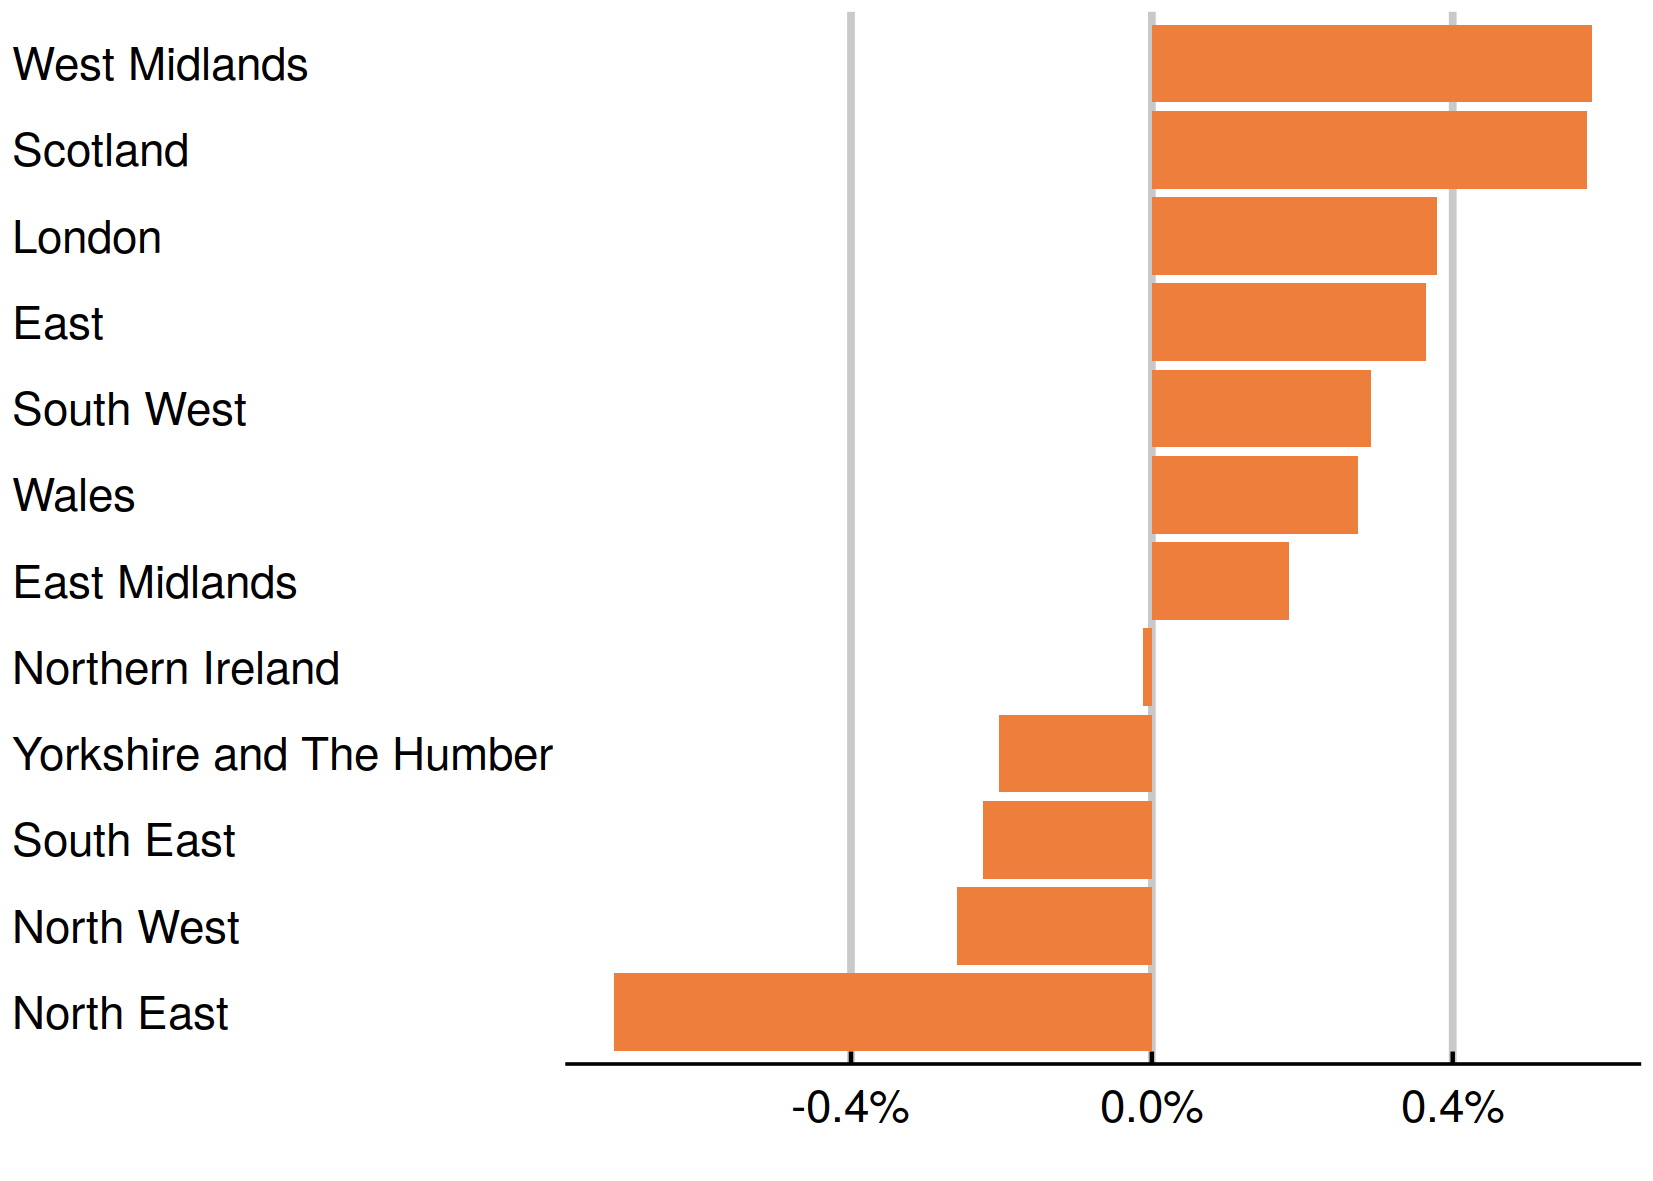 |
|
Chart 20: Inactivity rate quarterly change in regions – January 2019 to March 2020
Overall, there was a 0.3 percentage point fall in the inactivity rate. Four regions showed rises in inactivity, led by the South West and the East. 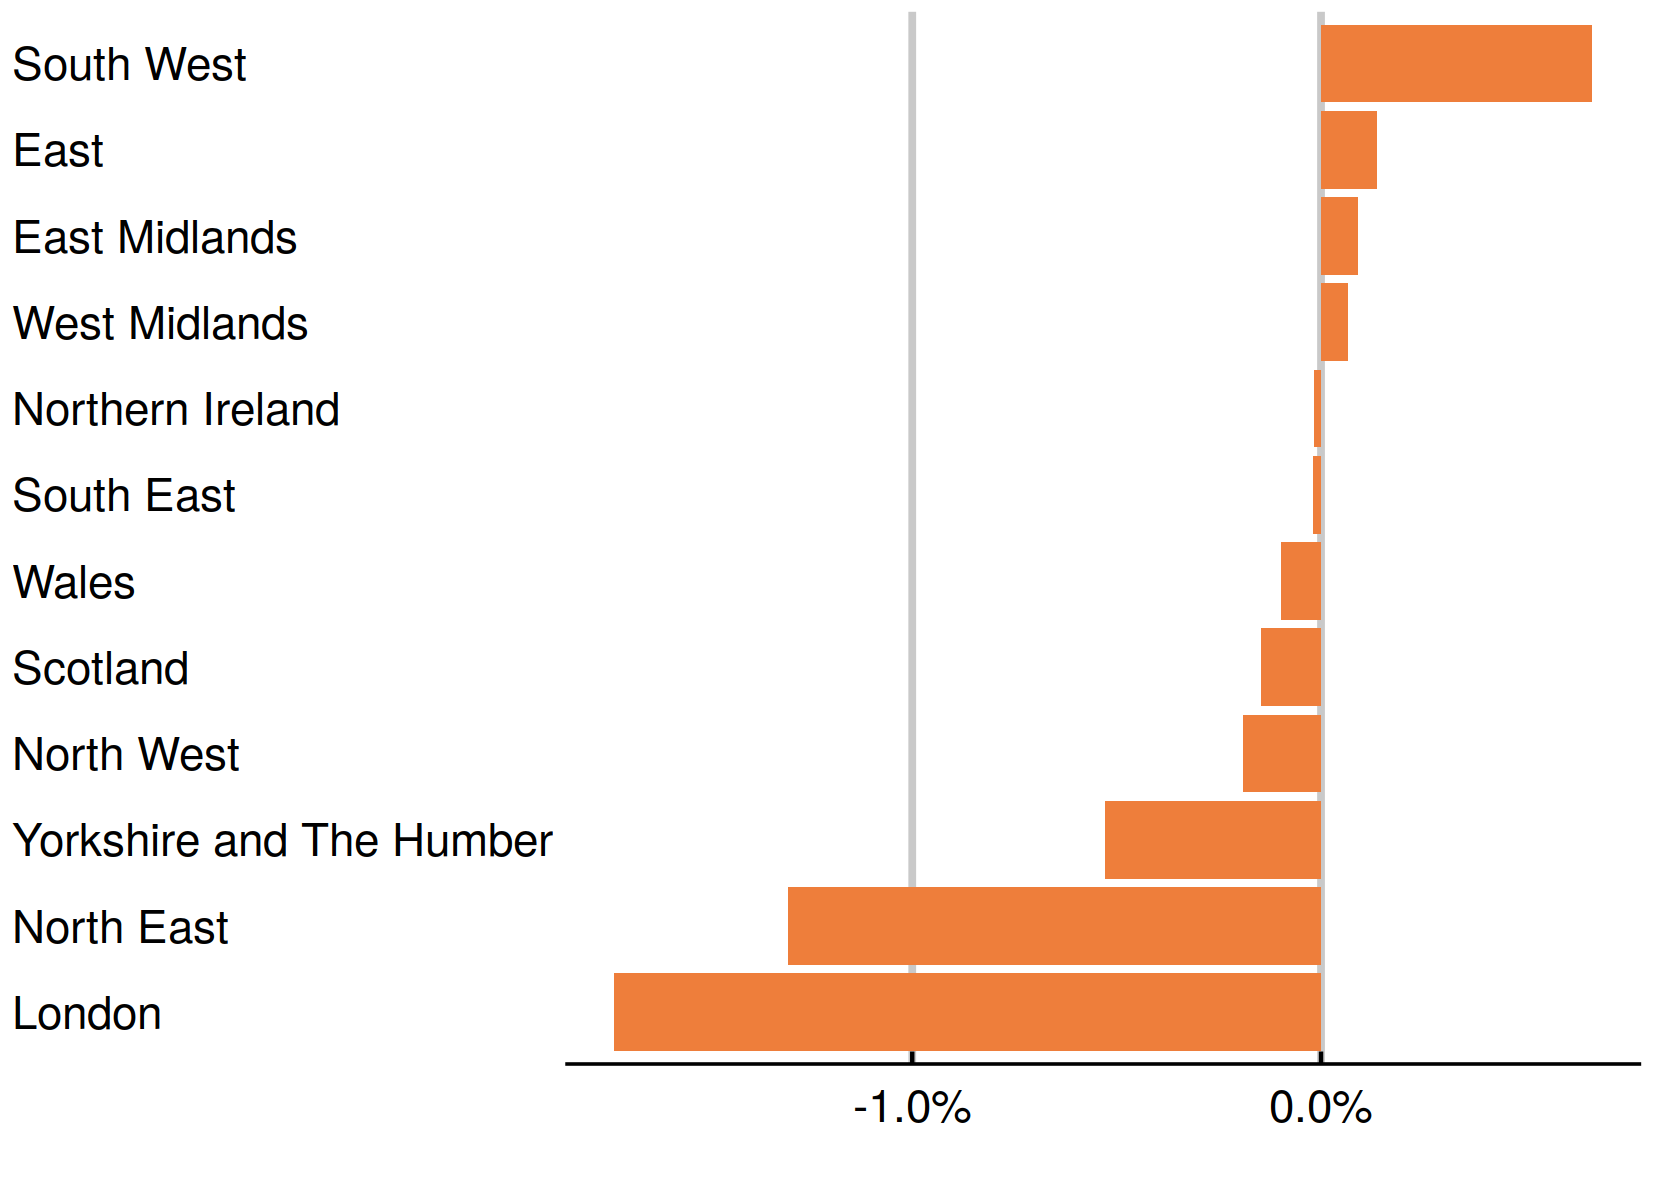 |
|
This newsletter is produced by Learning and Work Institute and keeps readers up to date on a wide range of learning and work issues.
If you have any questions, contact Paul Bivand
© 2020 Learning and Work Institute. All rights reserved.
Click here to unsubscribe Click here to see a web copy of this email
|
 |