 |
|
| Making learning and work count Labour market LIVE from Learning and Work Institute 17 May 2022
Learning and Work Institute comment |
|
| Chart 1: UK unemployment (ILO) The latest unemployment rate has fallen by 0.1 percentage points to 3.7%. 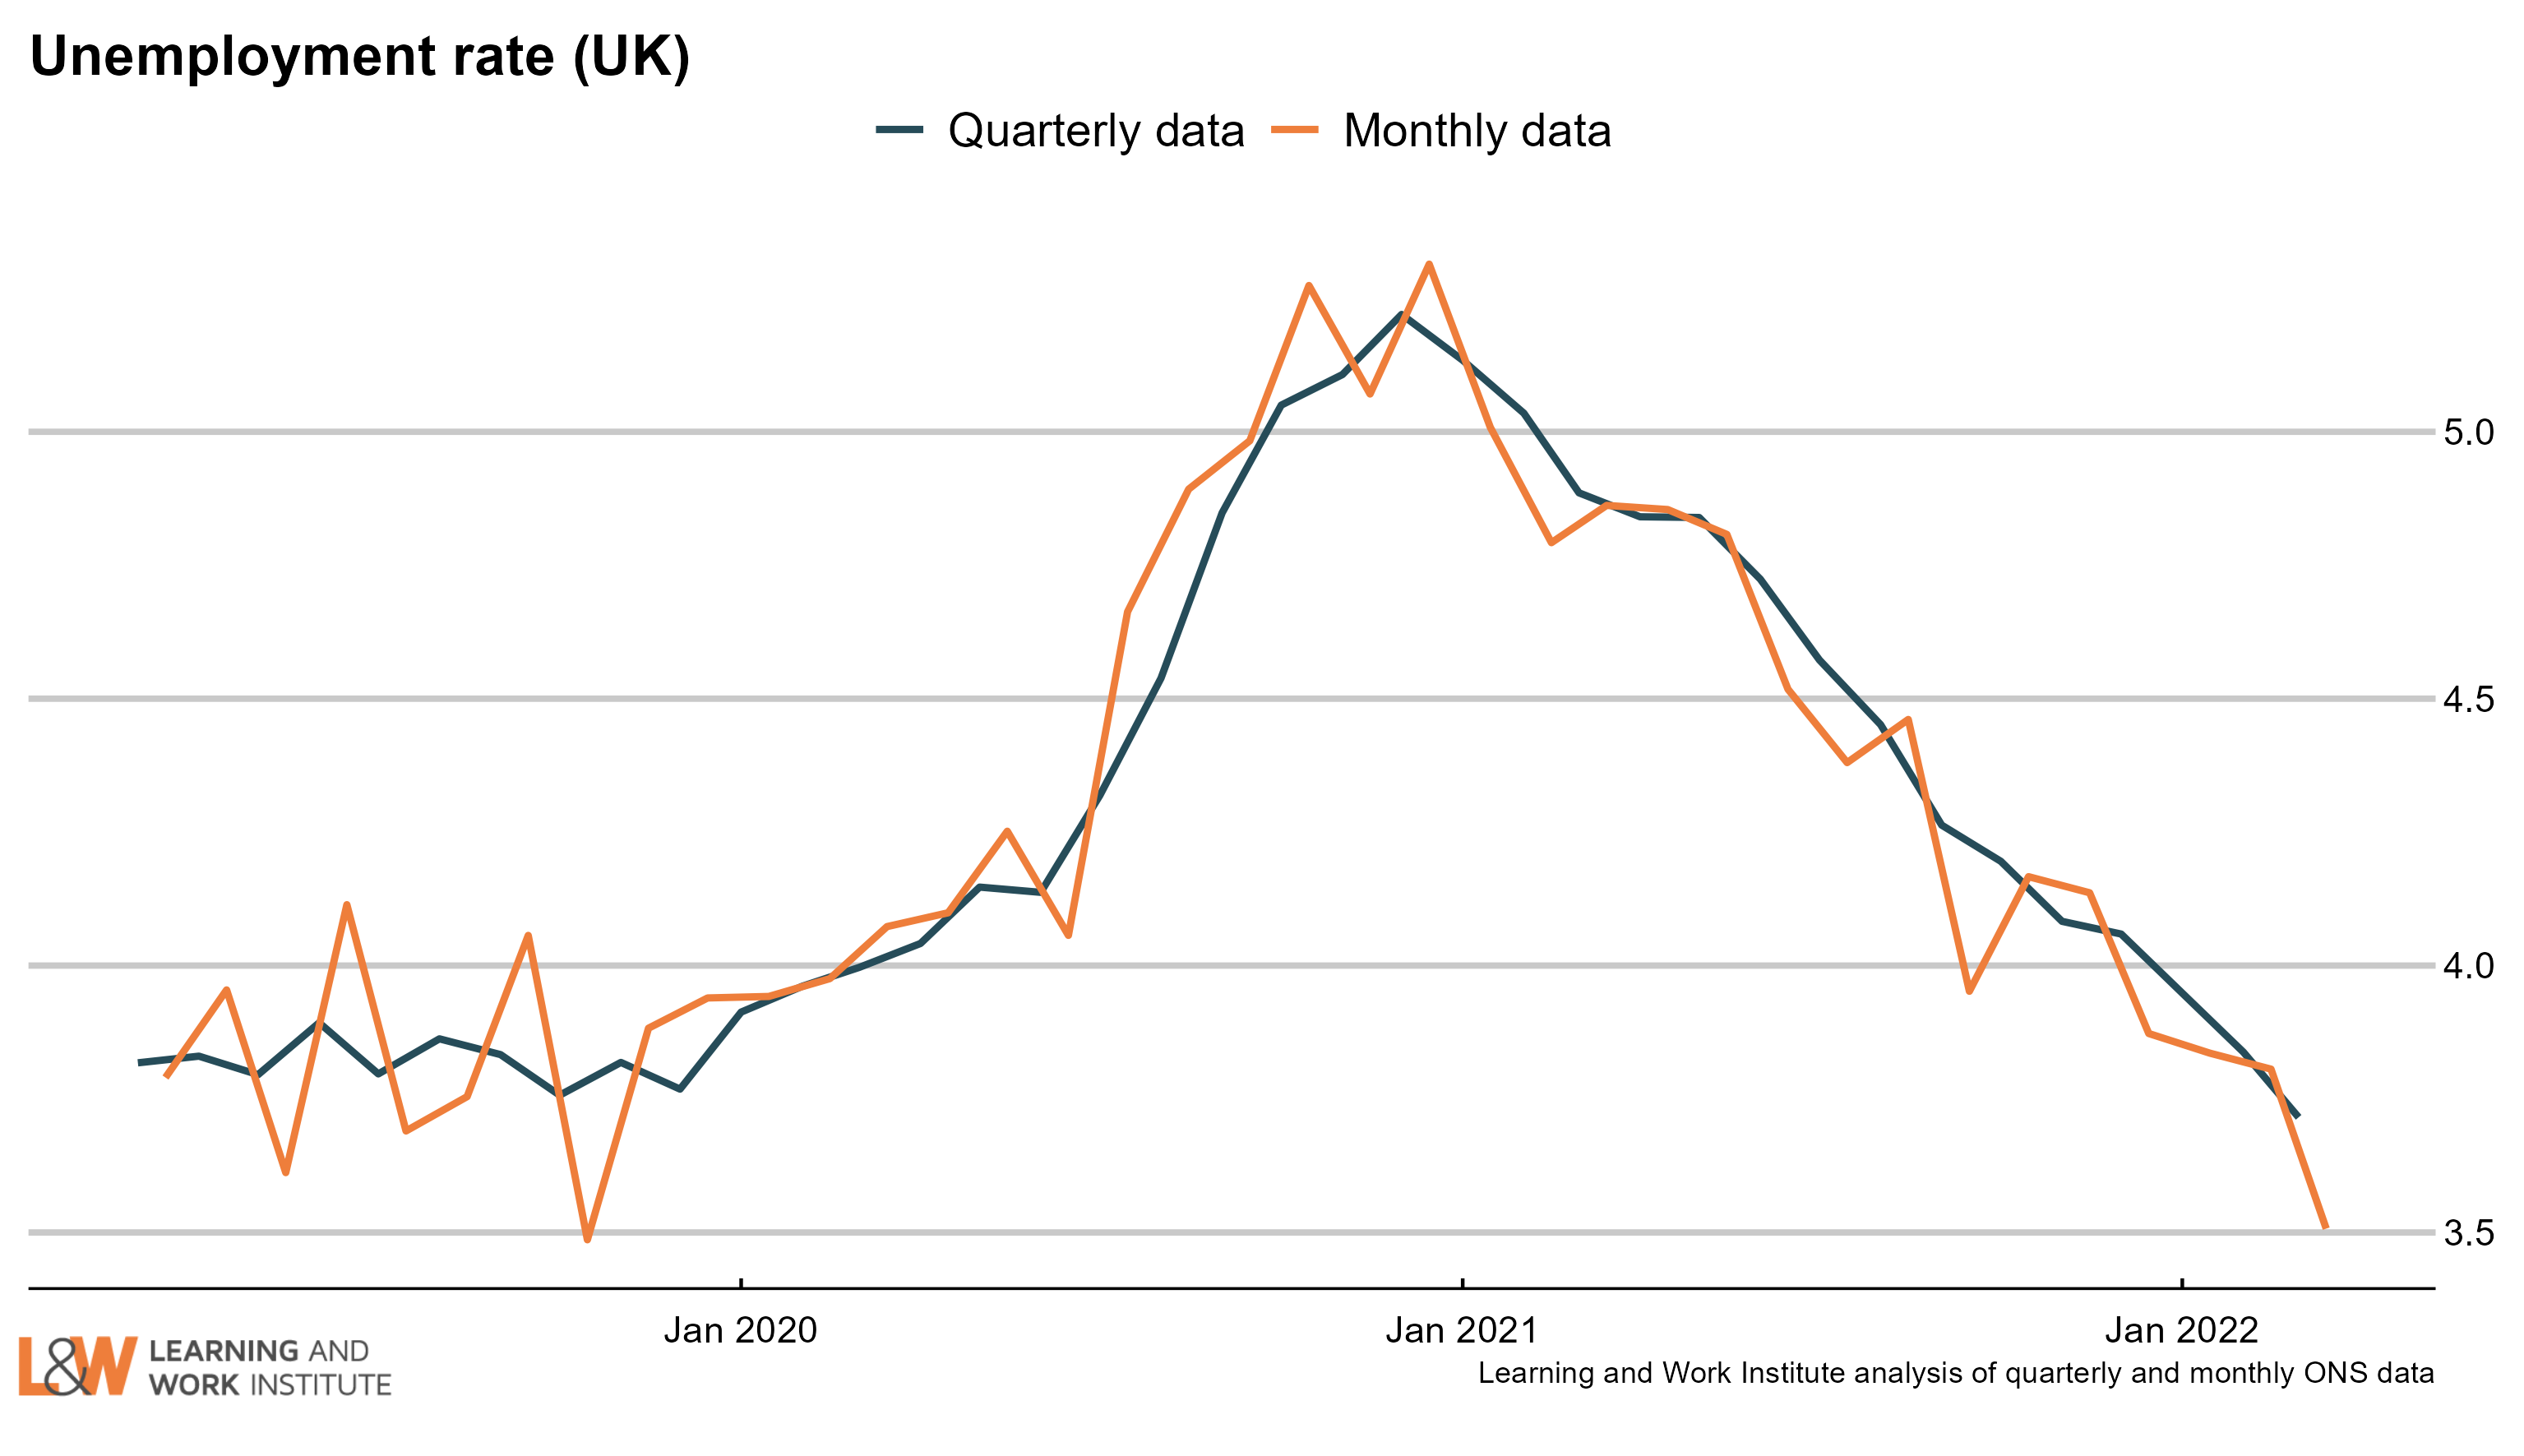 |
|
| Chart 2: The claimant count and UK unemployment compared The number of unemployed people who are claiming unemployment-related benefits is now 355,700 higher than the number of unemployed in the official measure. 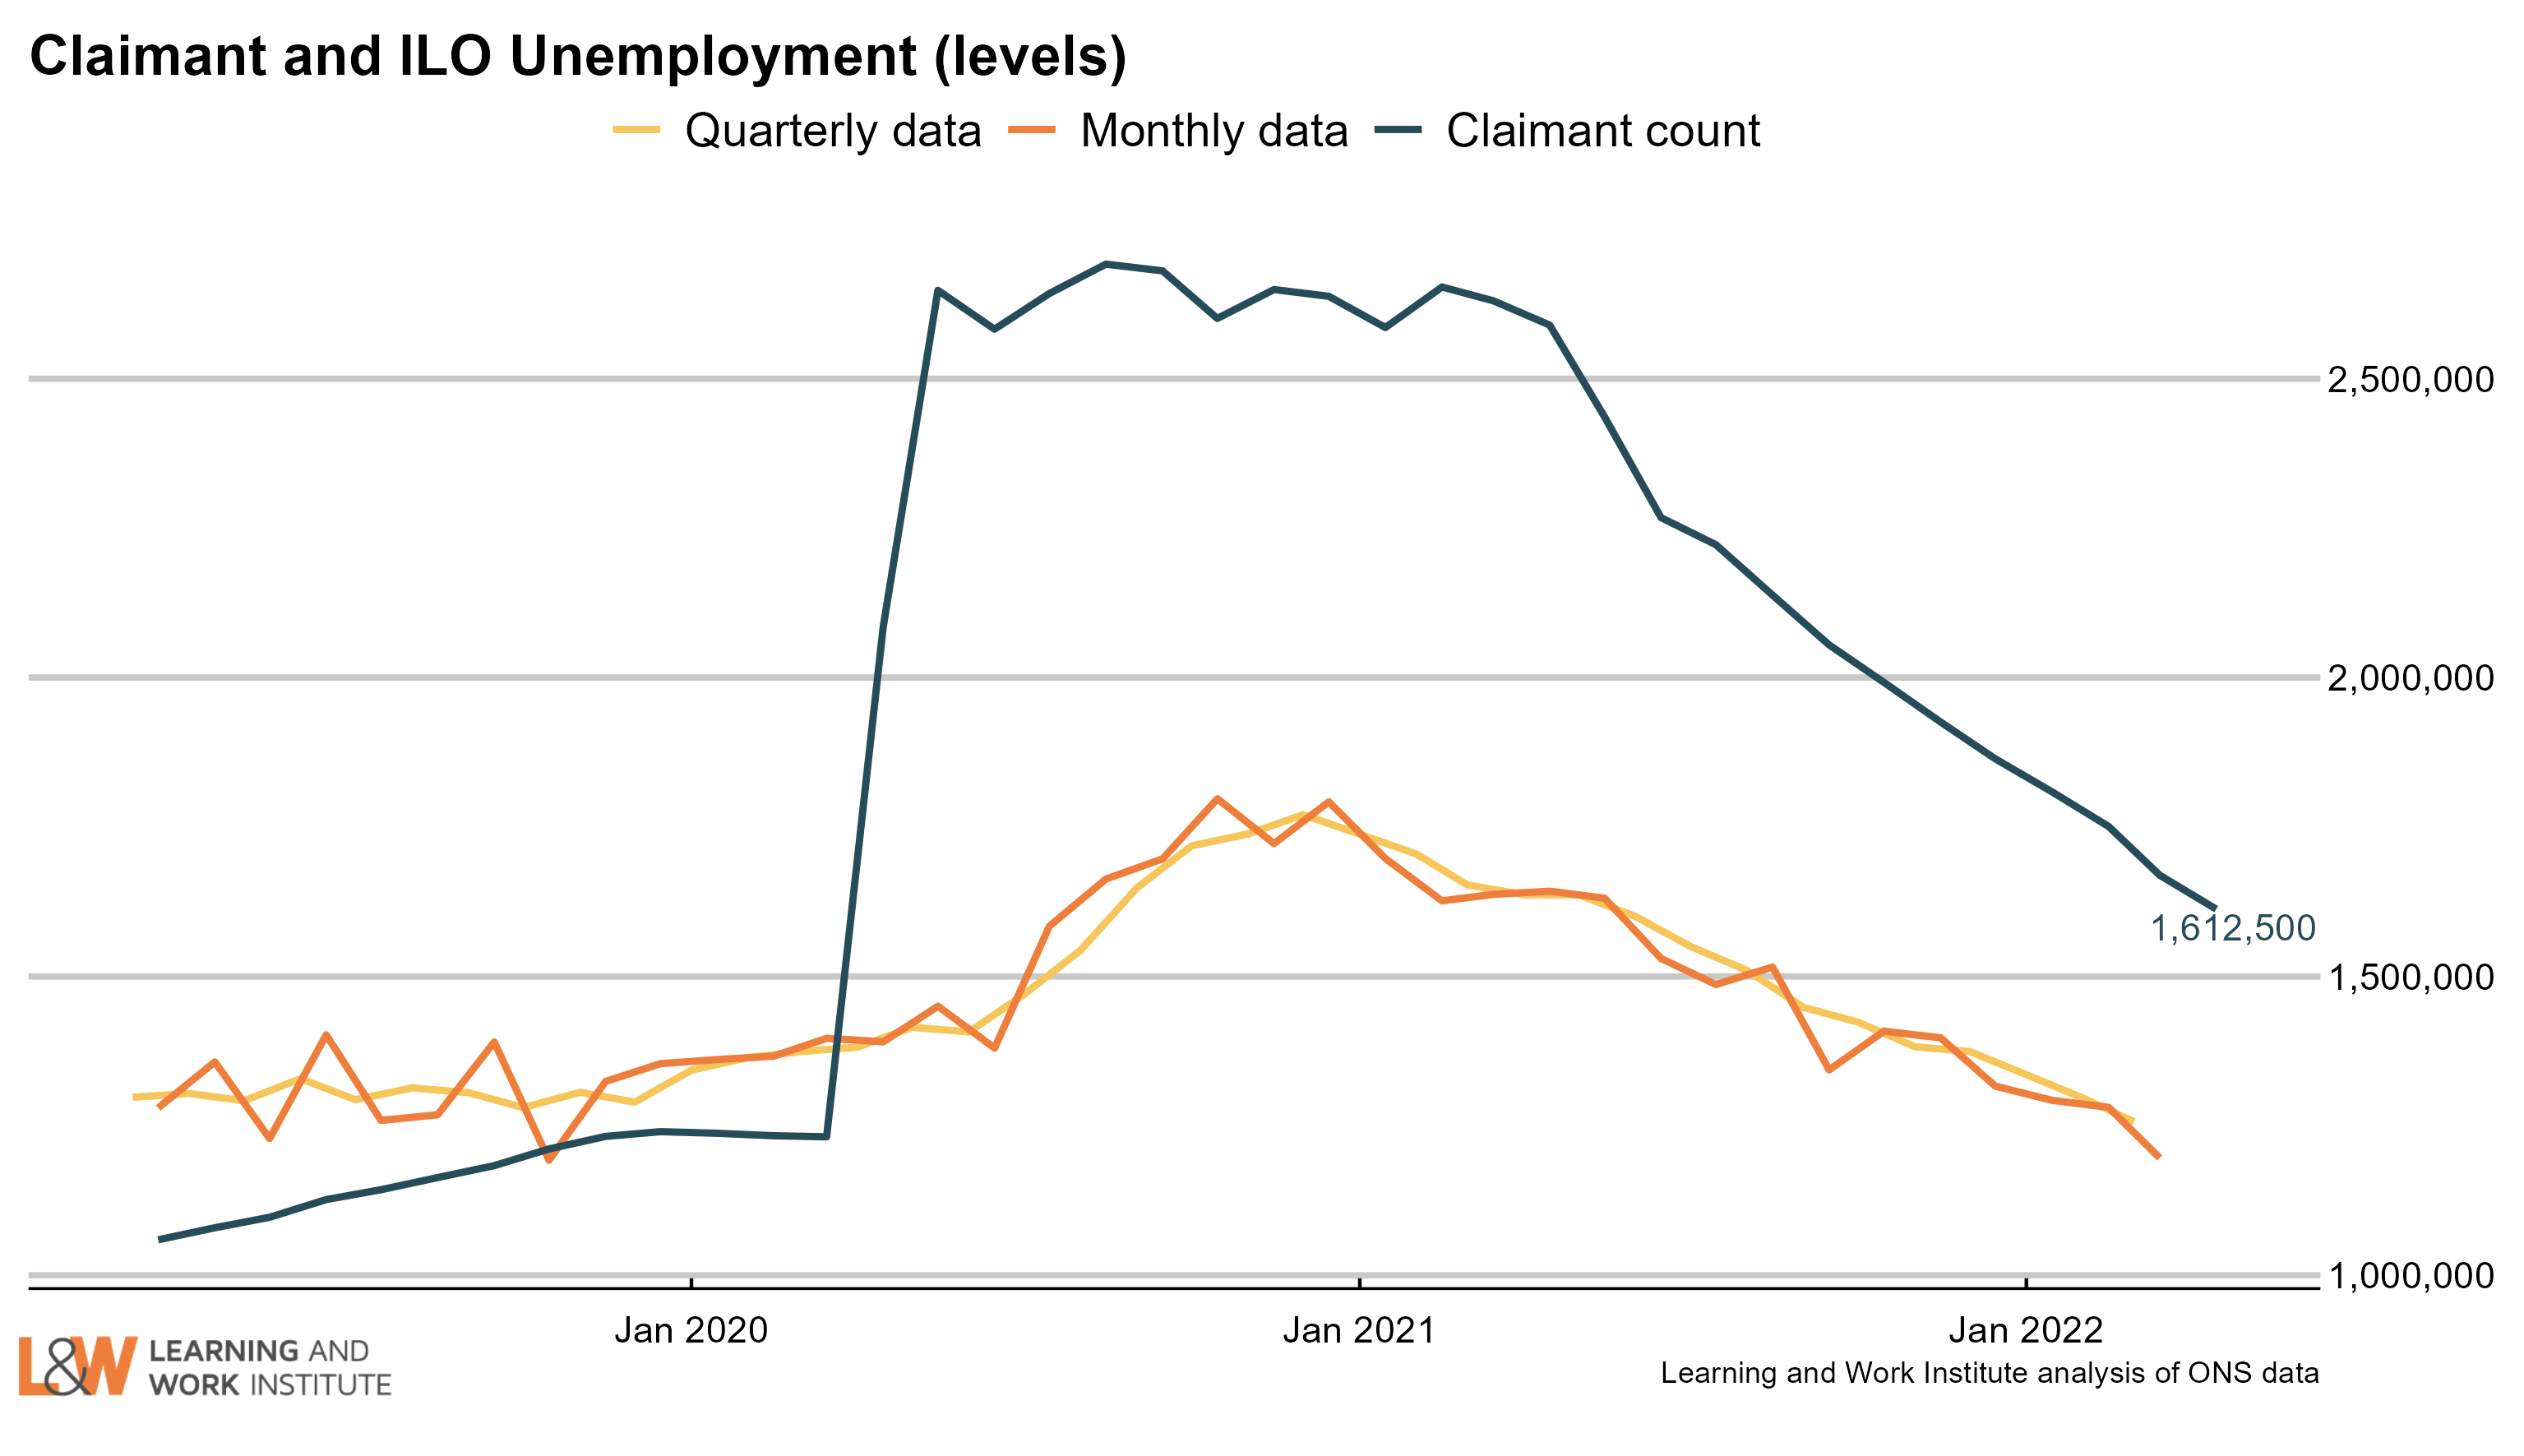 |
|
| Chart 3: Youth unemployment The number of unemployed young people has fallen by 29,000 since last month’s figures, to 438,000. Meanwhile, the number of young Universal Credit or Jobseeker’s Allowance claimants has fallen by last month by 12,100, to 252,700. 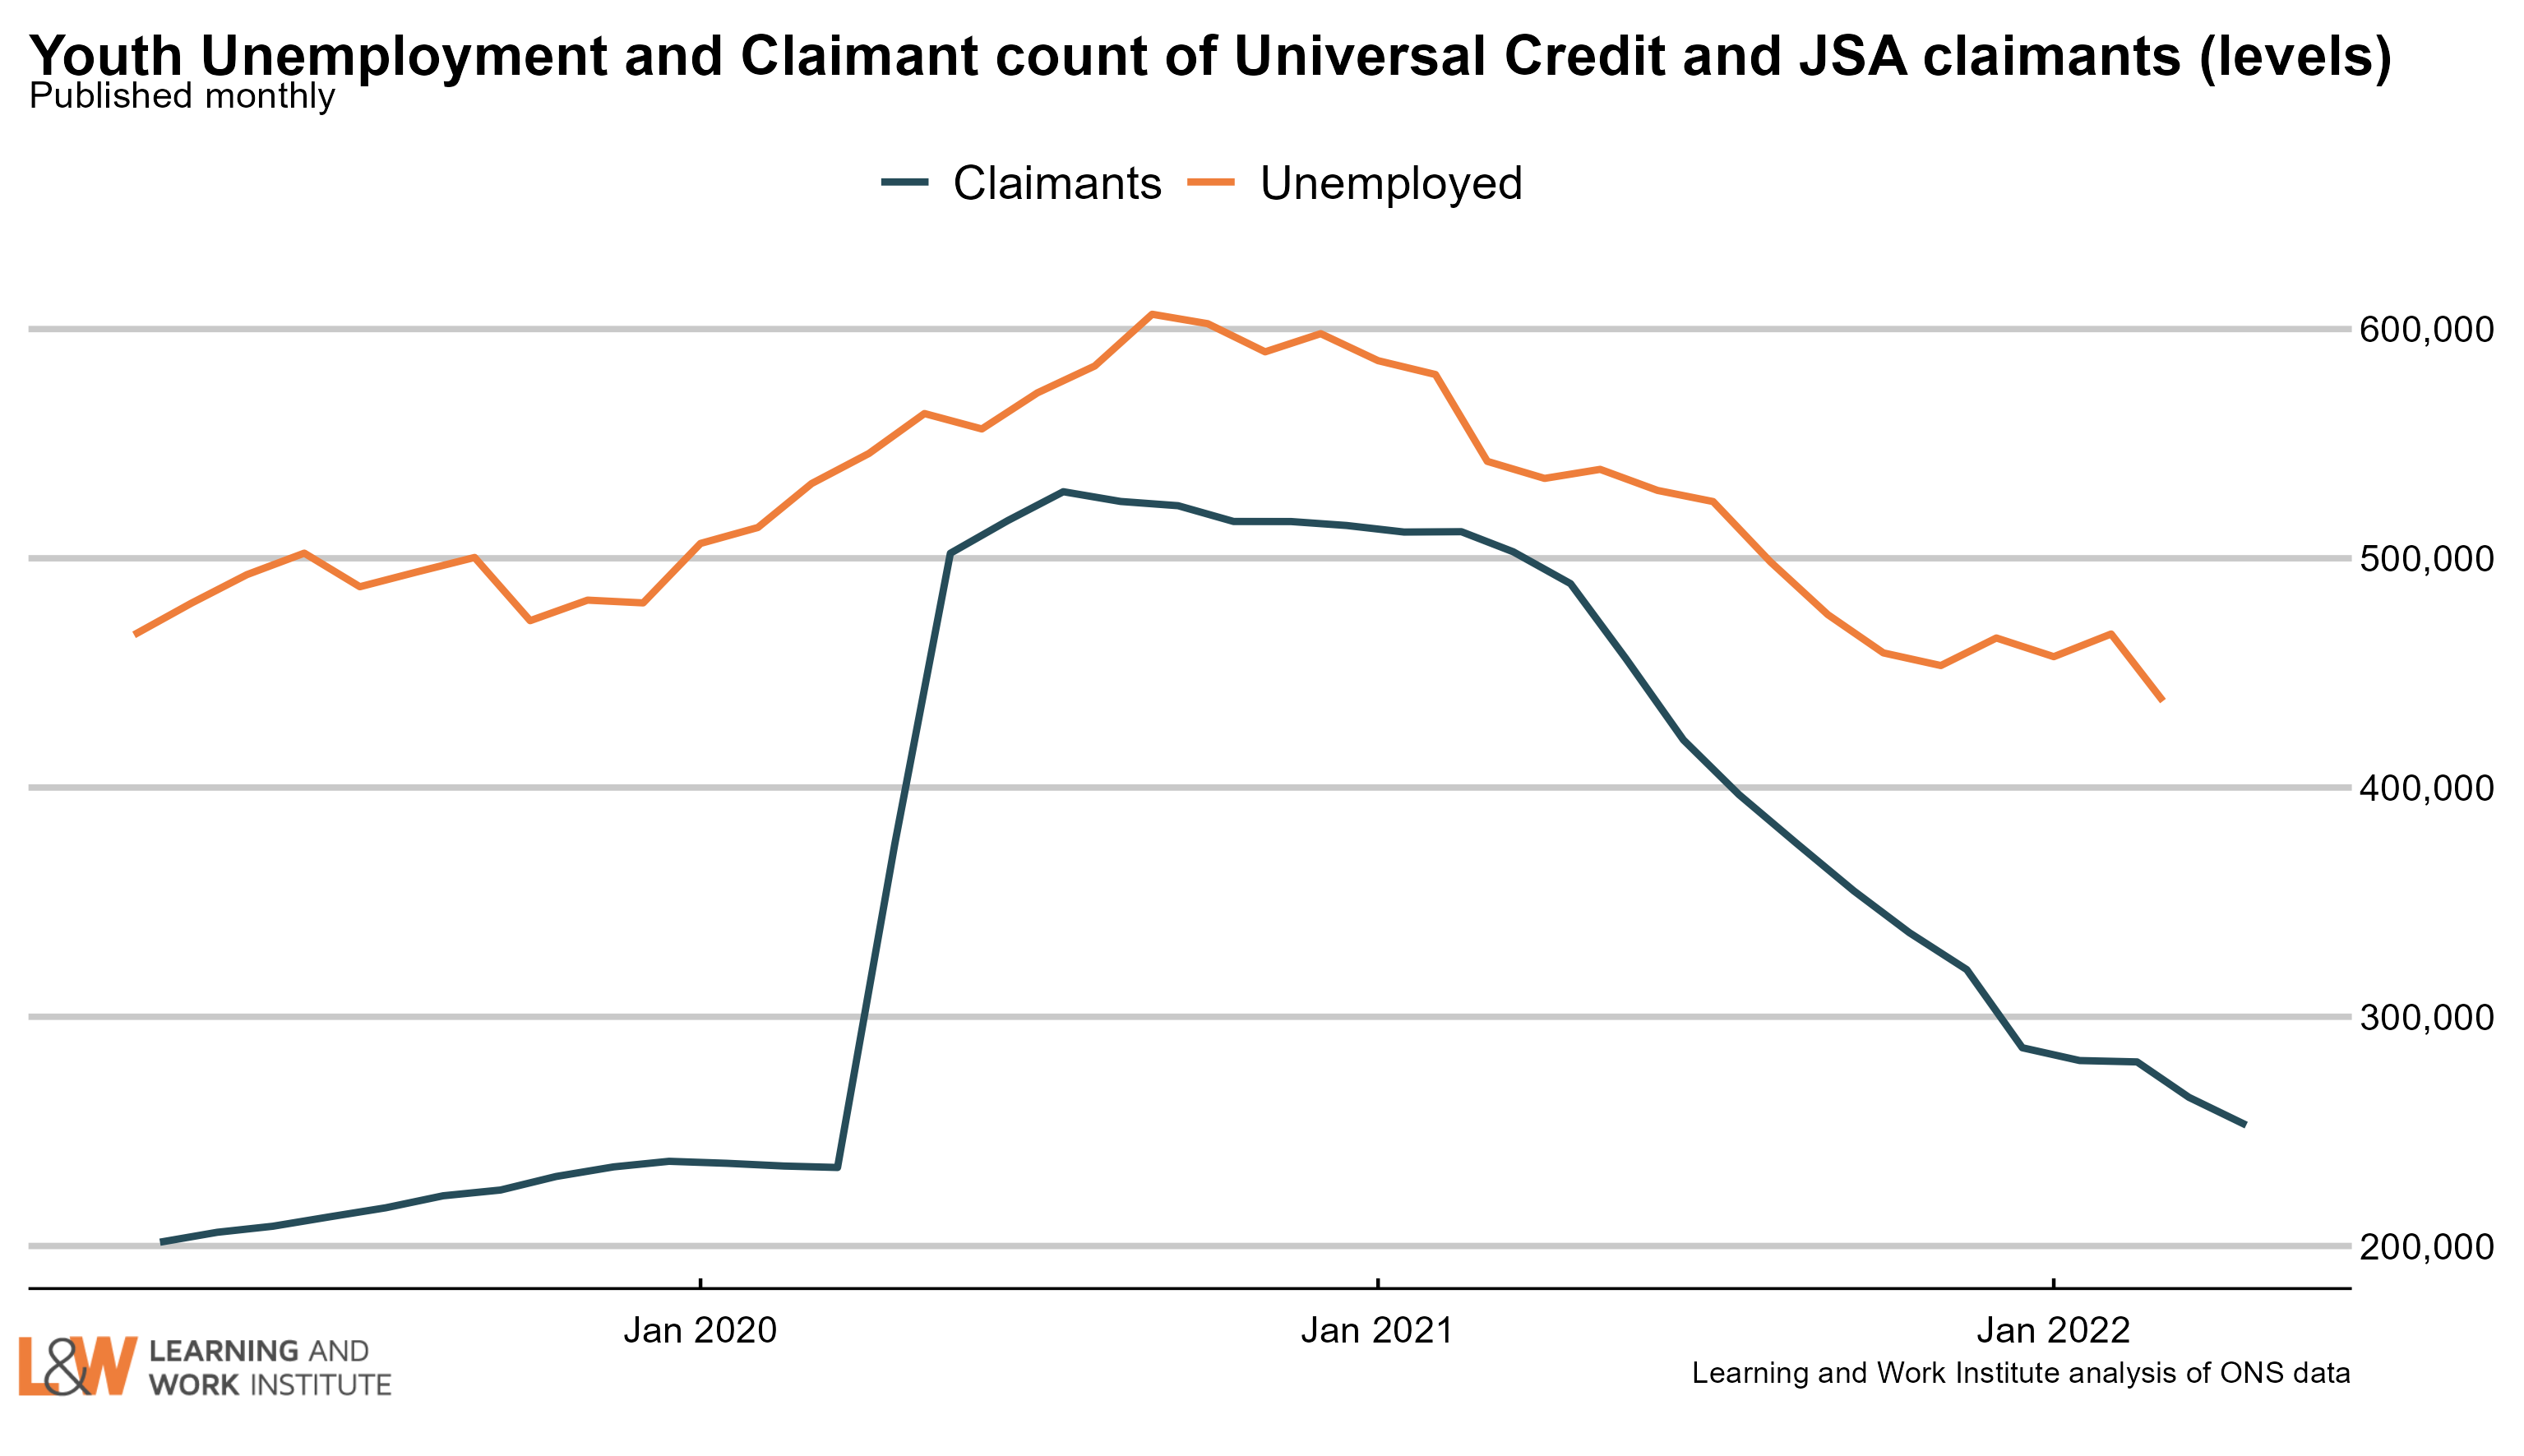 |
|
| Chart 4: Young people not in employment, full-time education or training The number of out of work young people who are not in full-time education (880,000) reduced by 28,000 in the last quarter, or 3.1%. Two-thirds (68%) of young people not in full-time education or employment are economically inactive, rather than unemployed. To be counted as unemployed, people need to be both actively seeking work and available to start. People out of work who do not meet these criteria are counted as economically inactive. 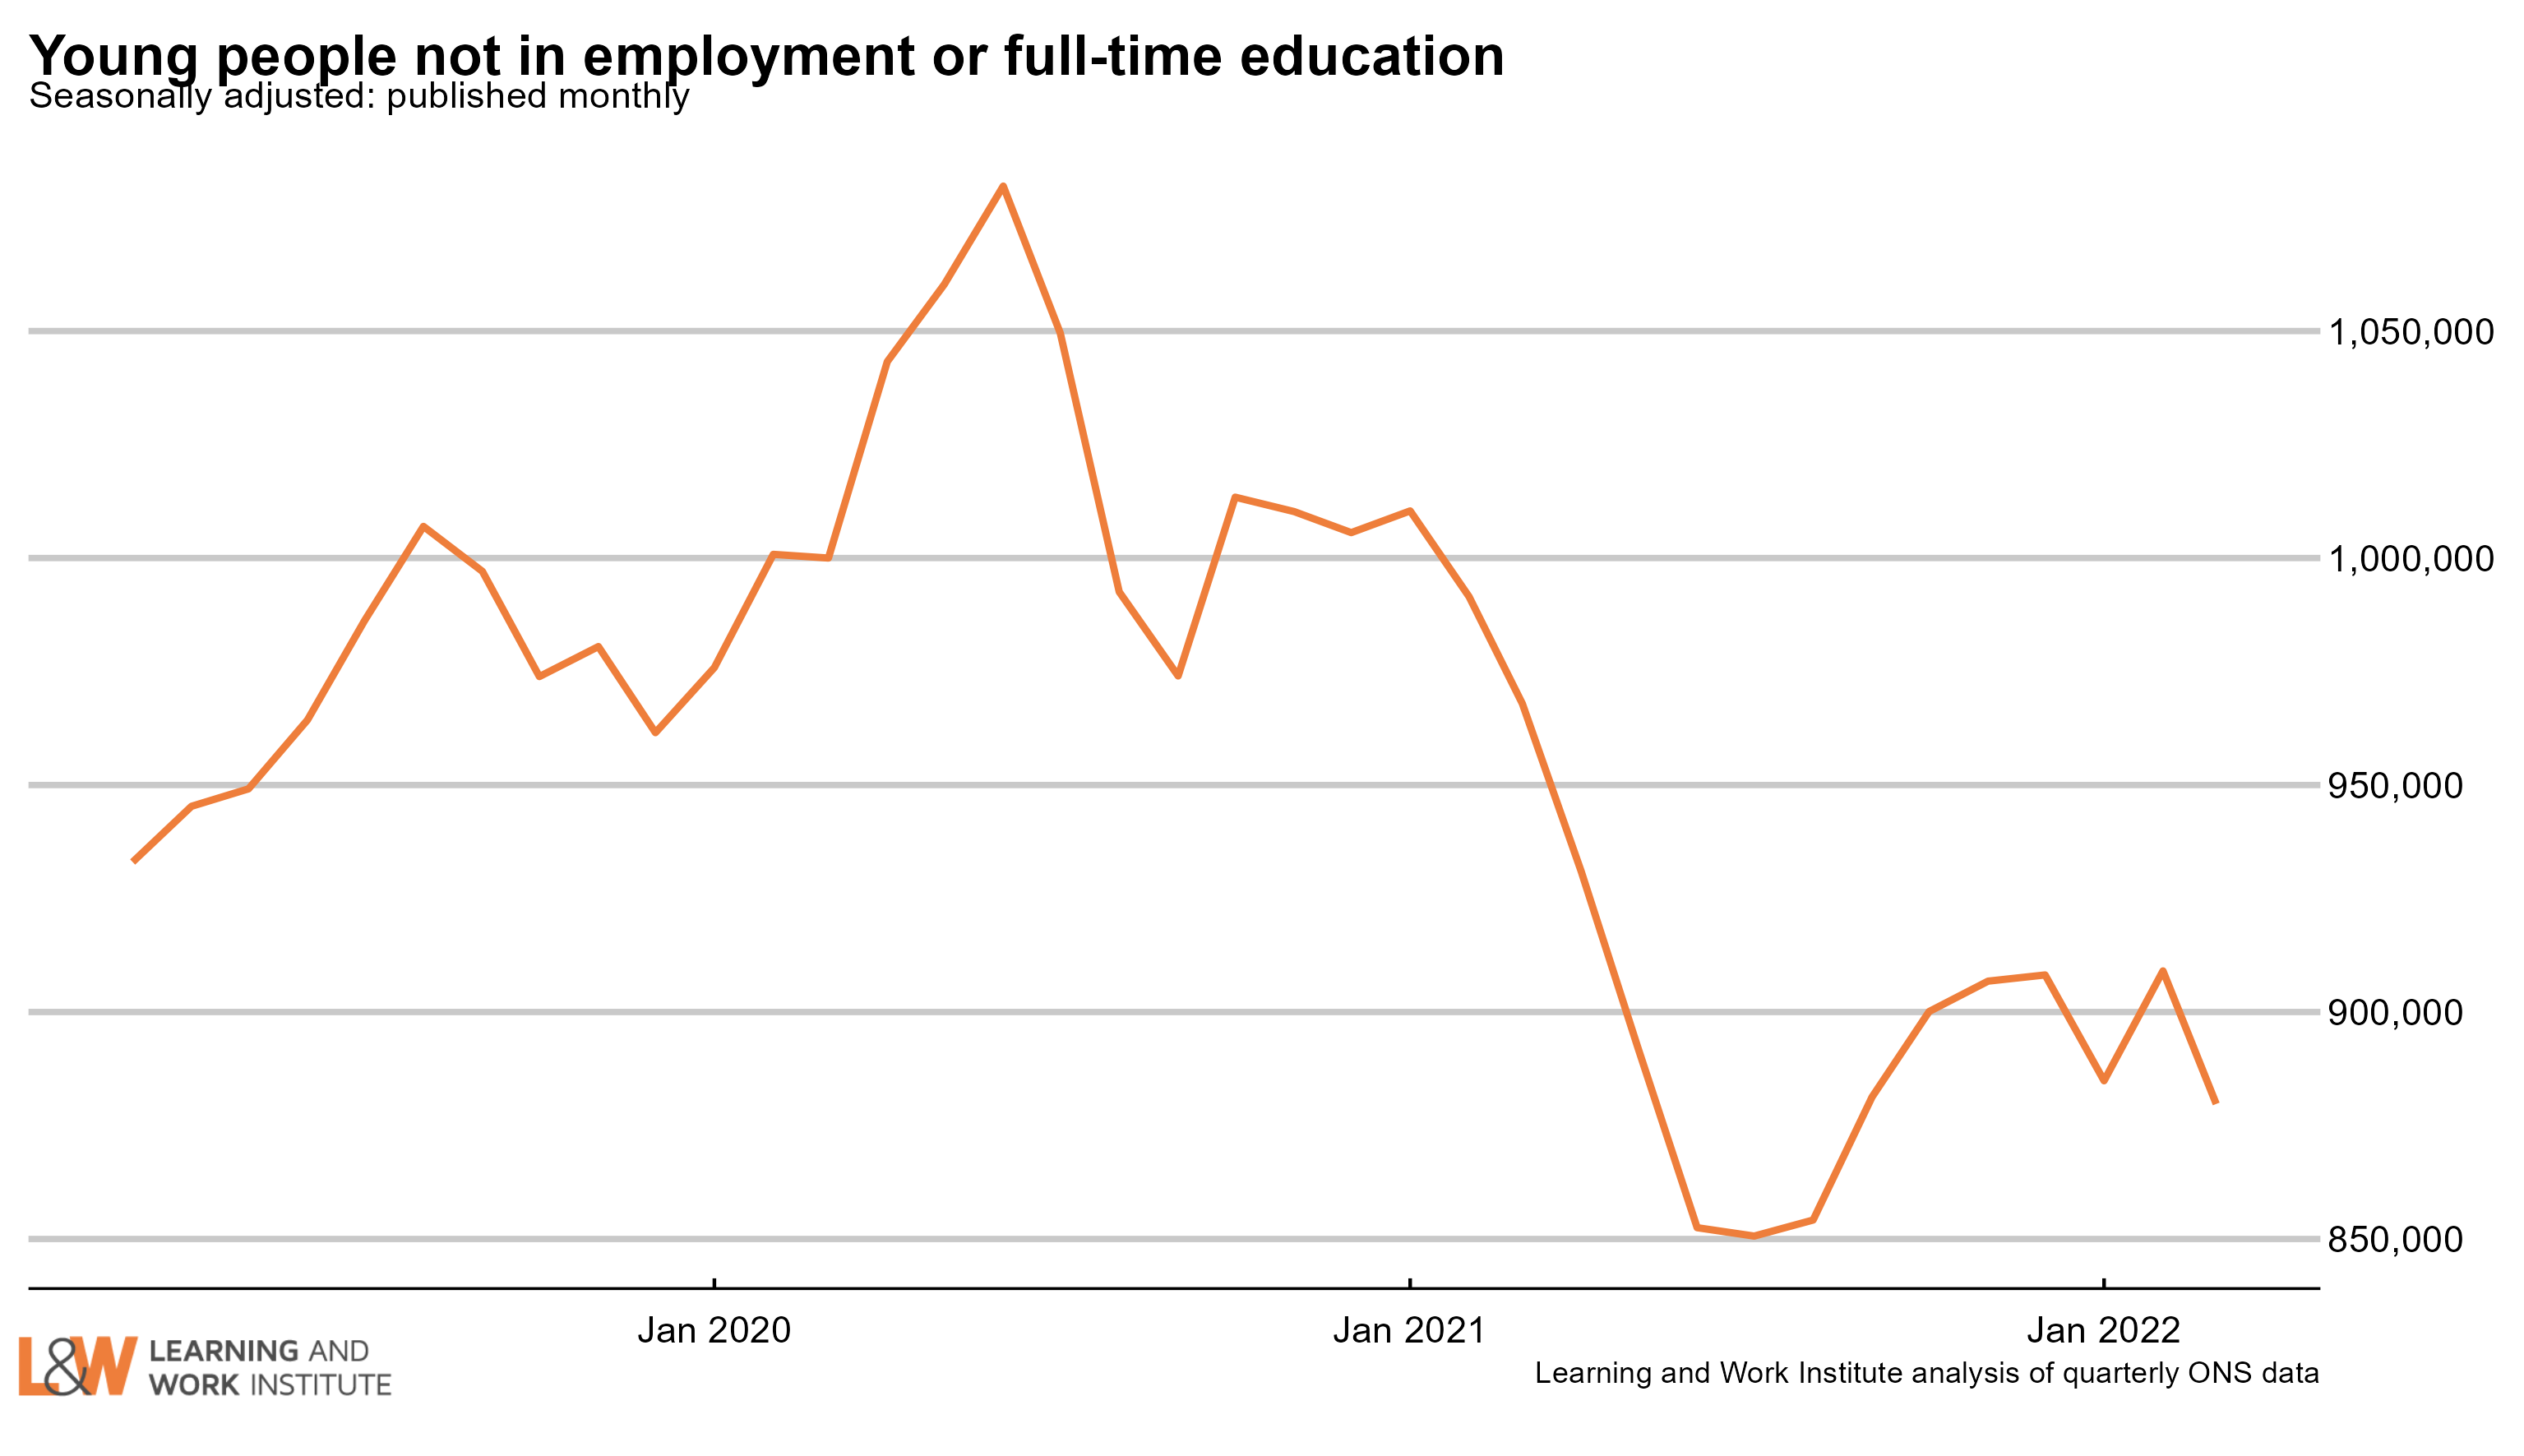 |
|
| Chart 5: Youth long-term unemployment (six months and over, 16-24) Youth long-term unemployment (which can include students) has fallen by 34,000 over the last quarter and is now 116,000. Long-term unemployment for young people is normally counted as being unemployed for six months or more. Youth long-term unemployment is now the lowest on record. 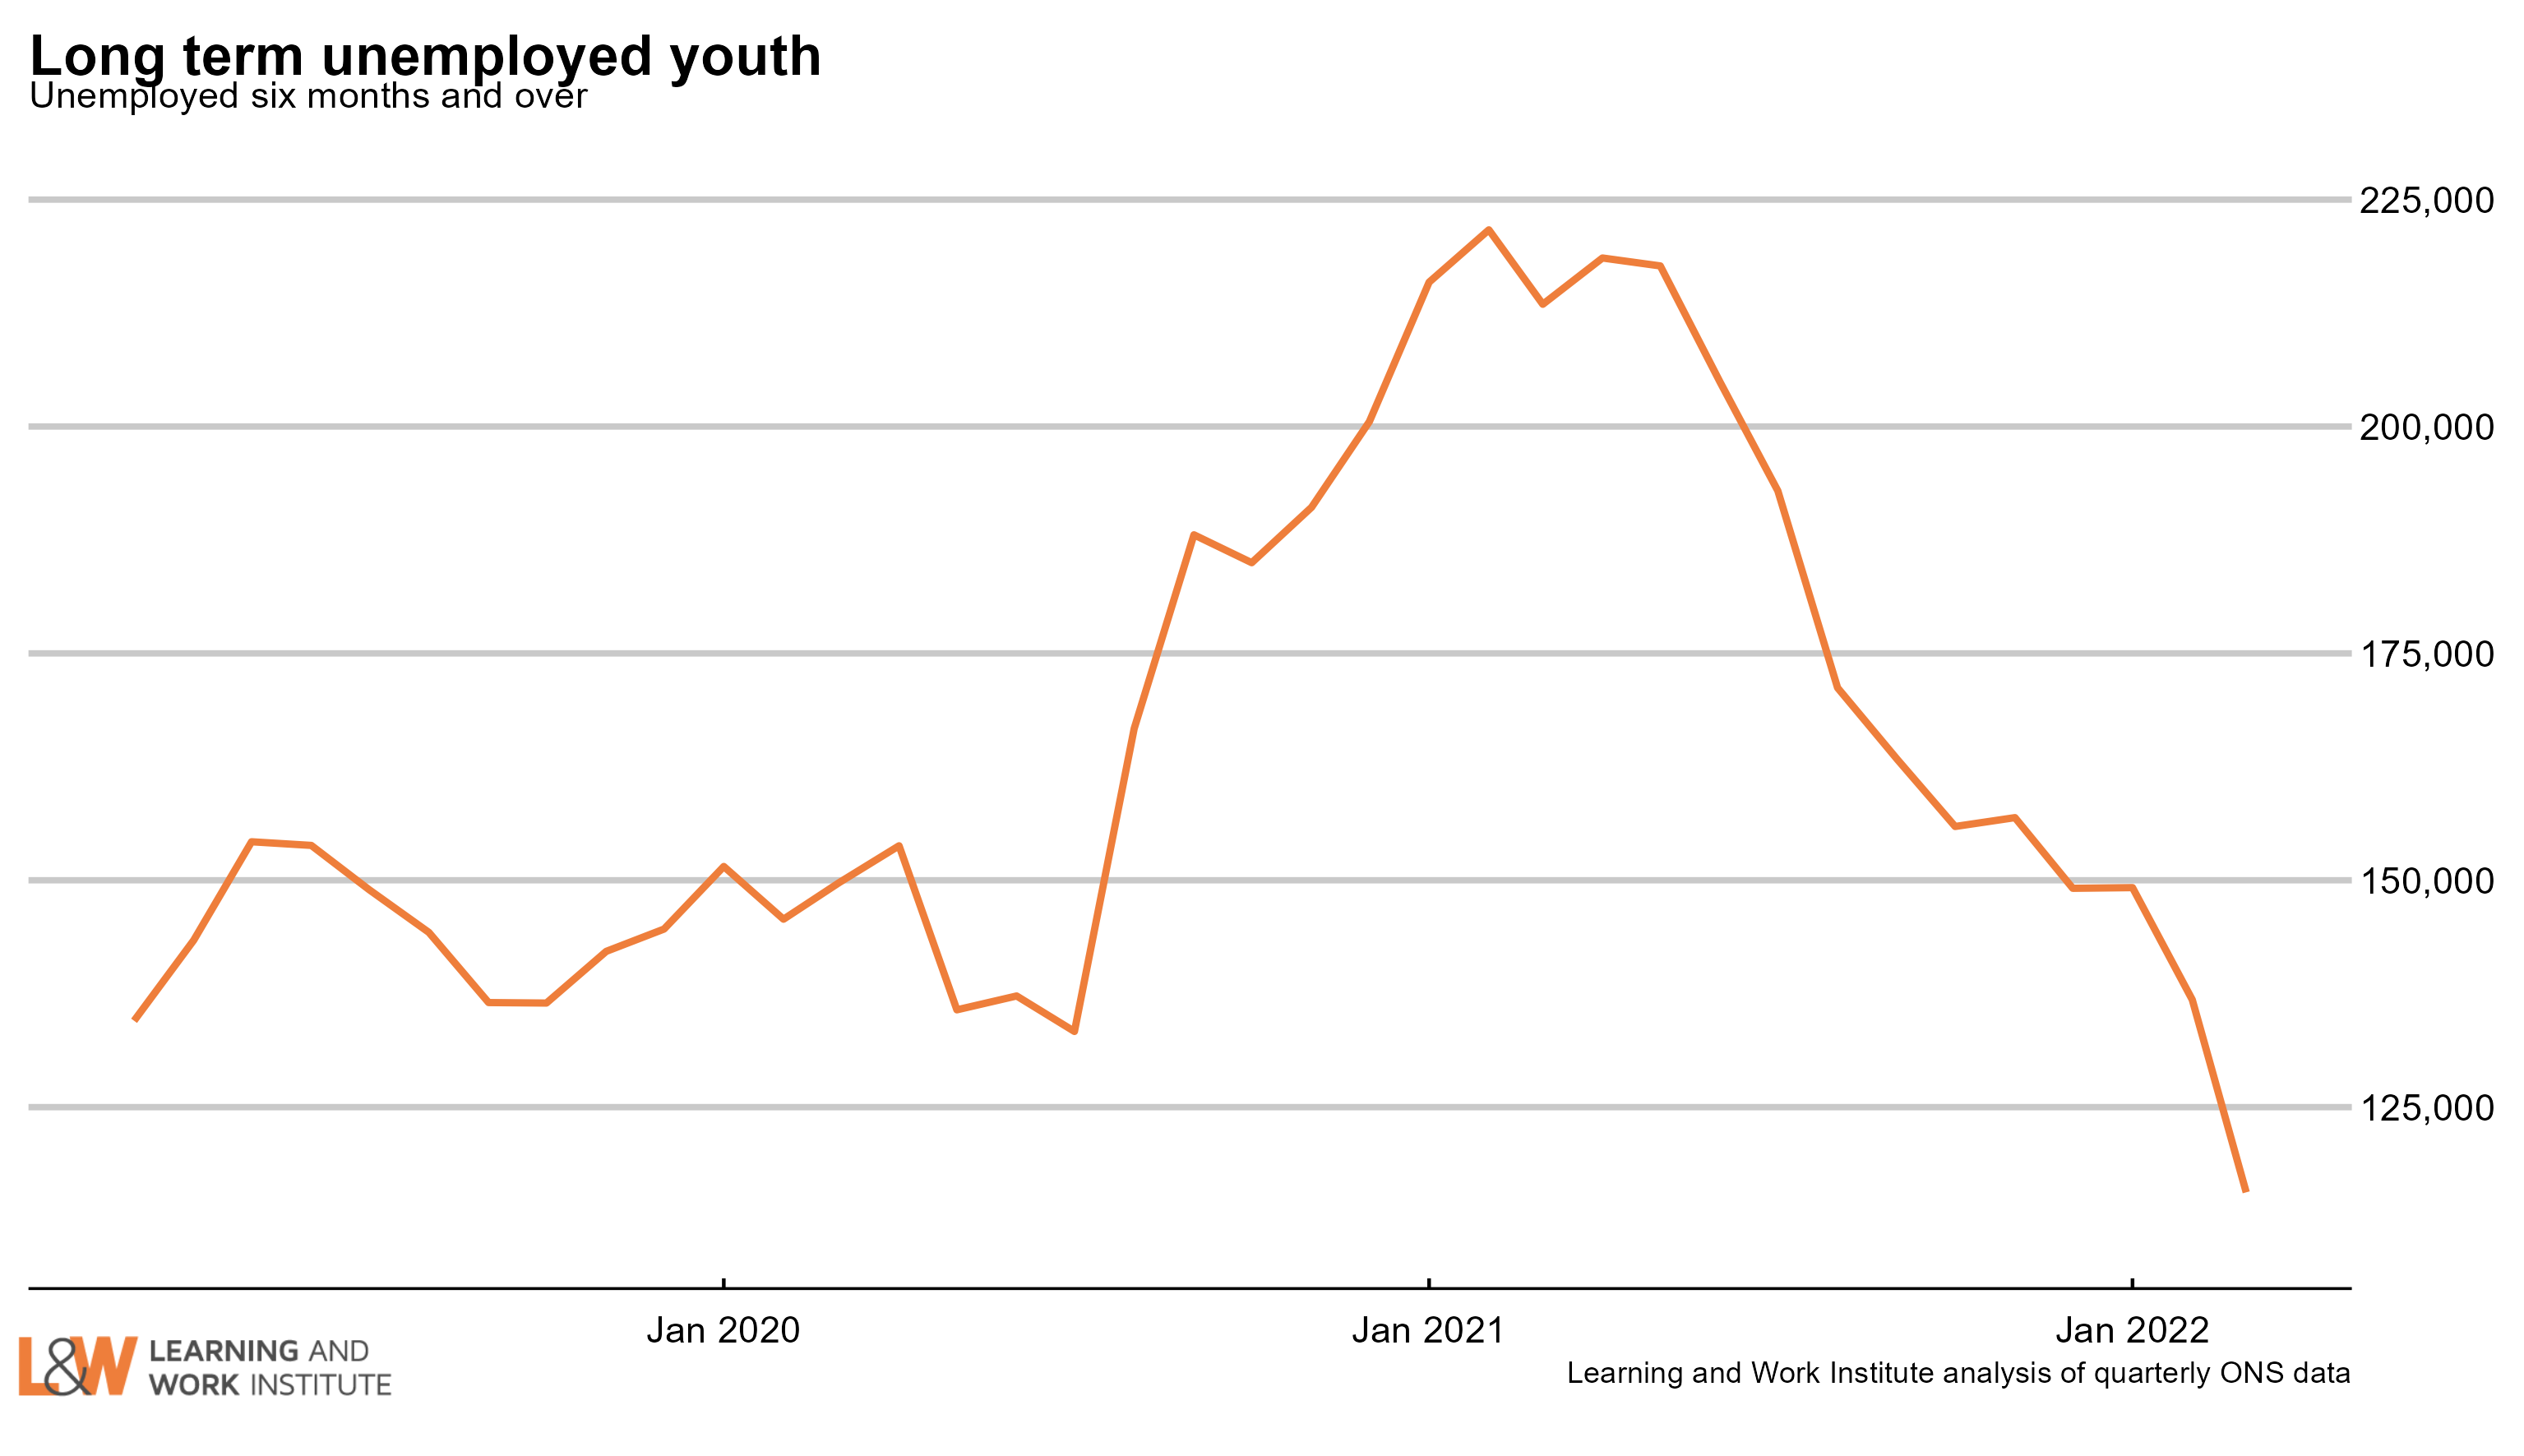 |
|
| Chart 6: Adult long-term unemployment (12 months and over, 25+) Adult long-term unemployment on the survey measure is now 289,000. There are 51,000 more people aged 25 and over out of work for 12 months or more than before the pandemic (Dec 19-Feb 20), though this is now falling (either due to people finding work or moving into economic inactivity). 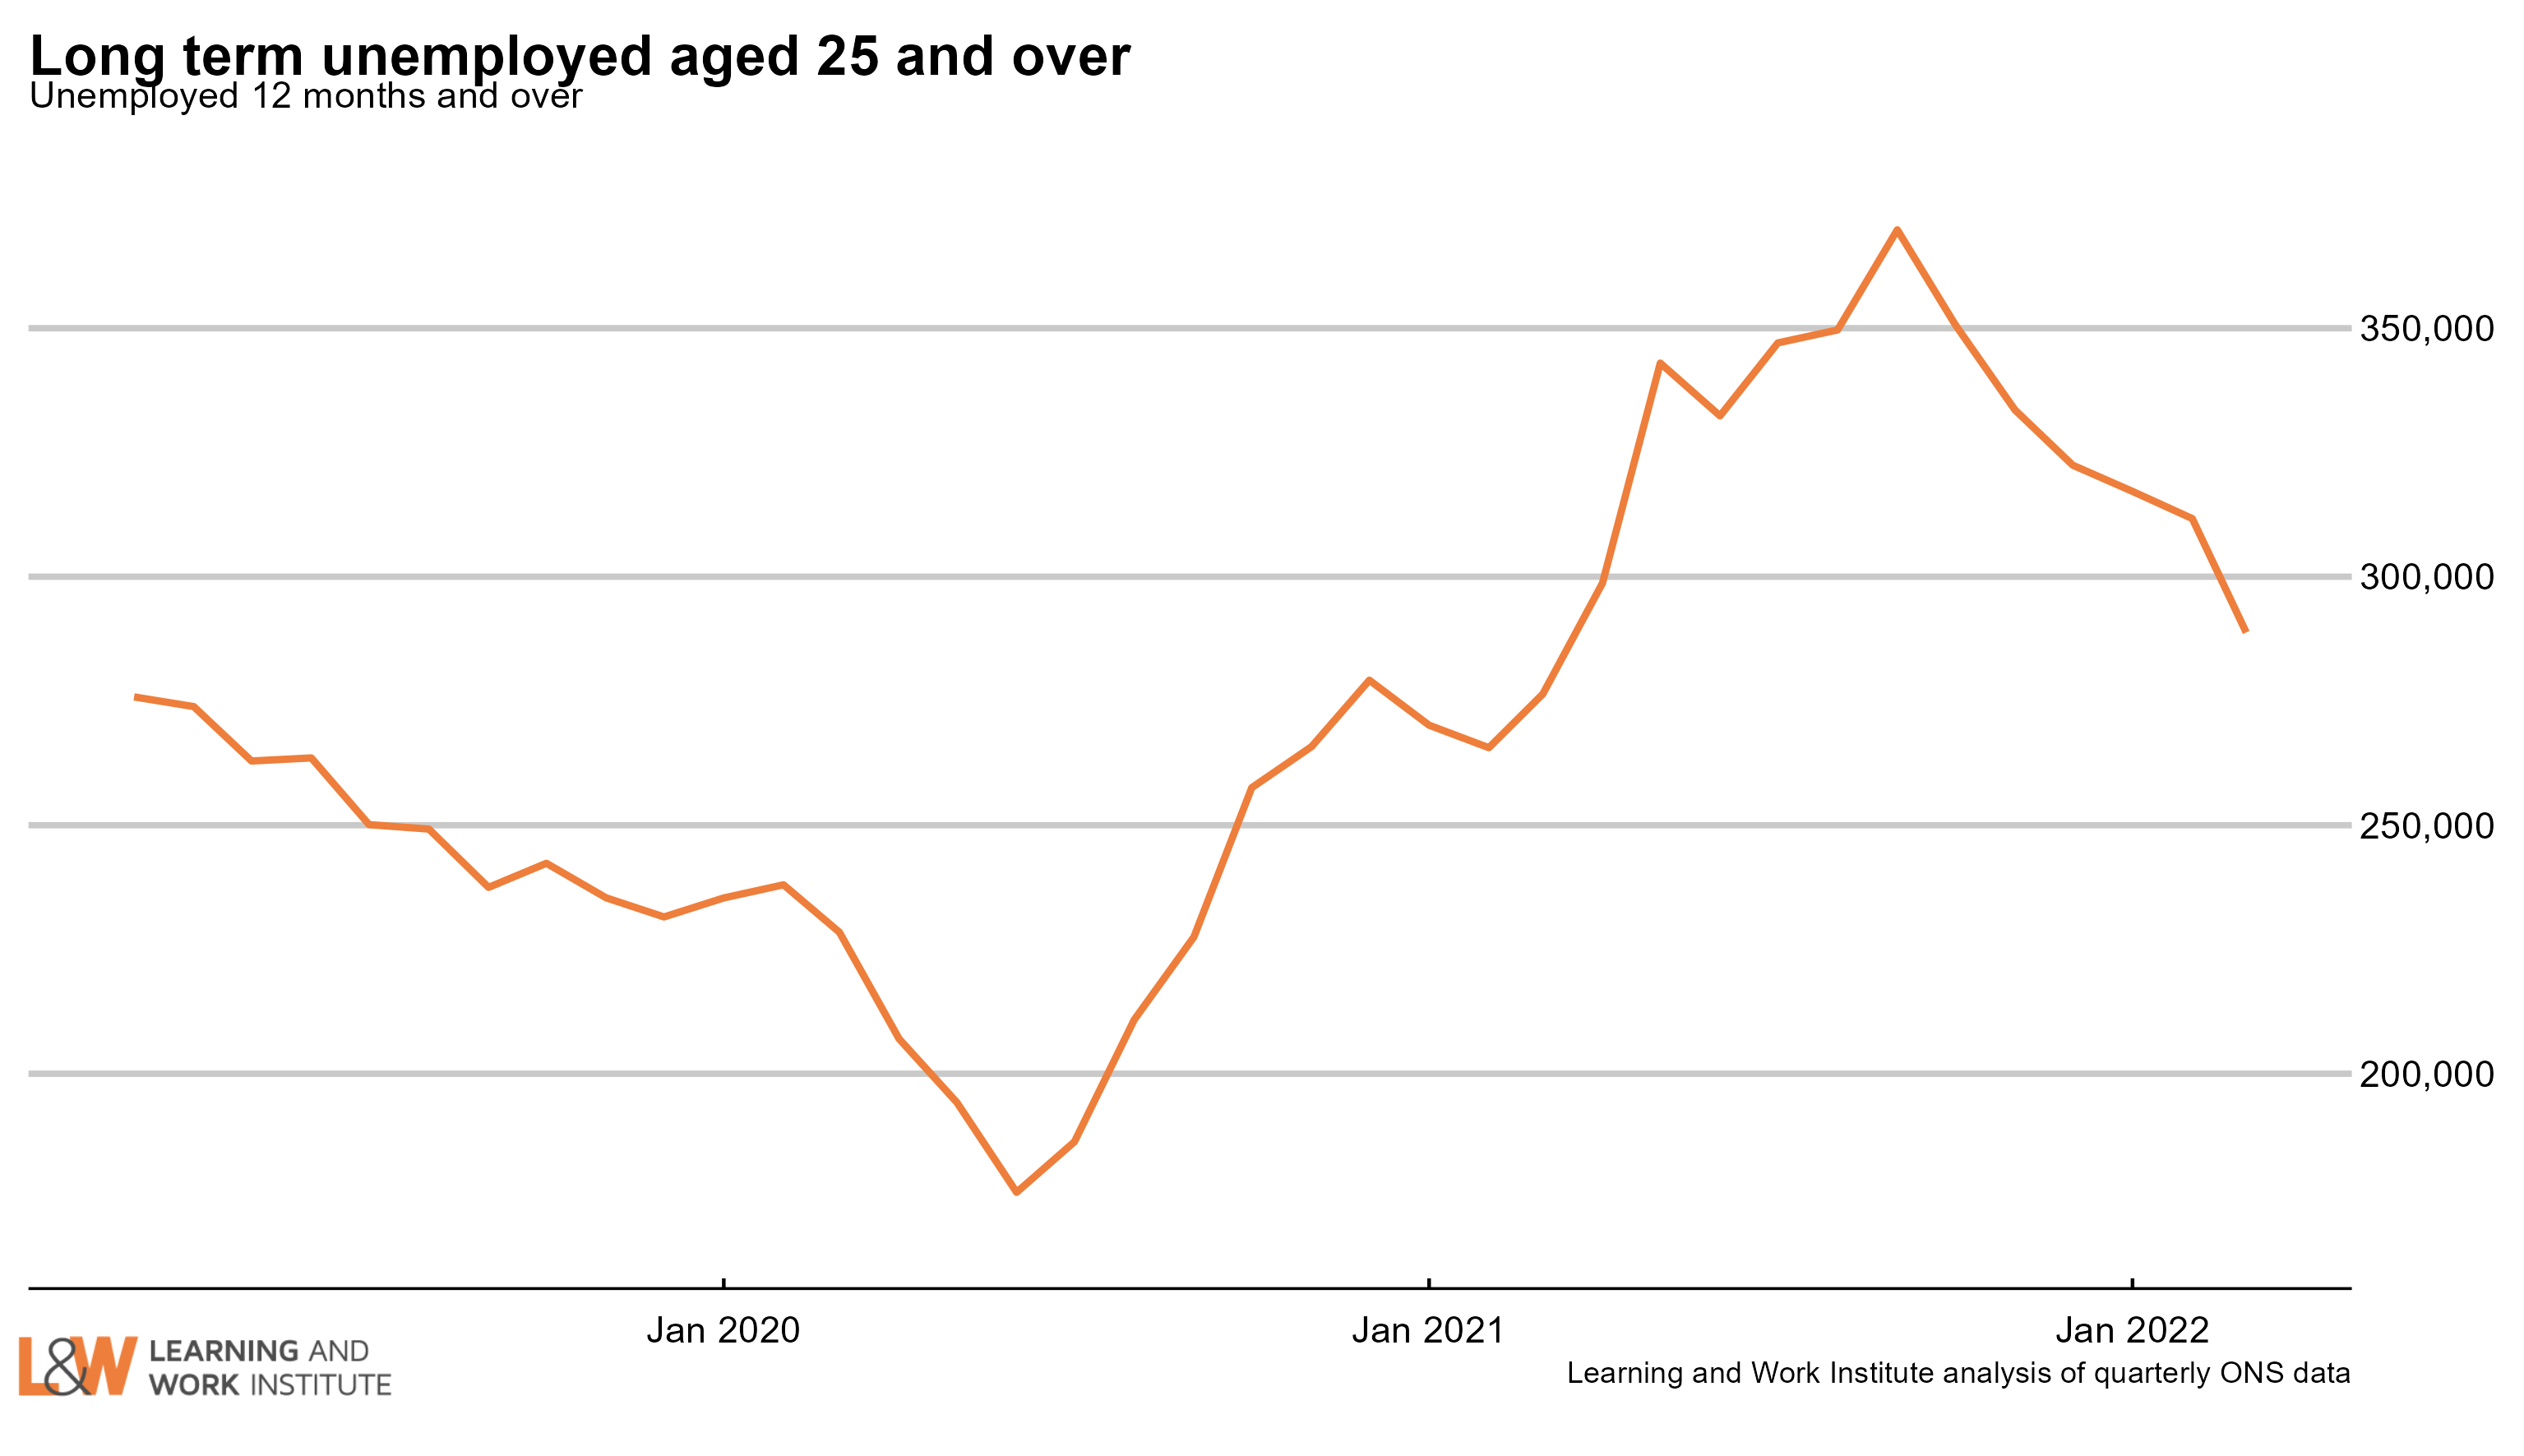 |
|
| Chart 7: Unemployment rates by age The 18 to 24 year old unemployment rate (including students) is 9.1% of the economically active – excluding one million economically inactive students from the calculation. The rate for those aged 25 to 49 is 2.9%. For those aged 50 and over it is 2.6%. The quarterly change is 1.0 percentage points down for 18 to 24 year olds, 0.2 points down for 25 to 49 year olds, and 0.4 points down for the over-50s. 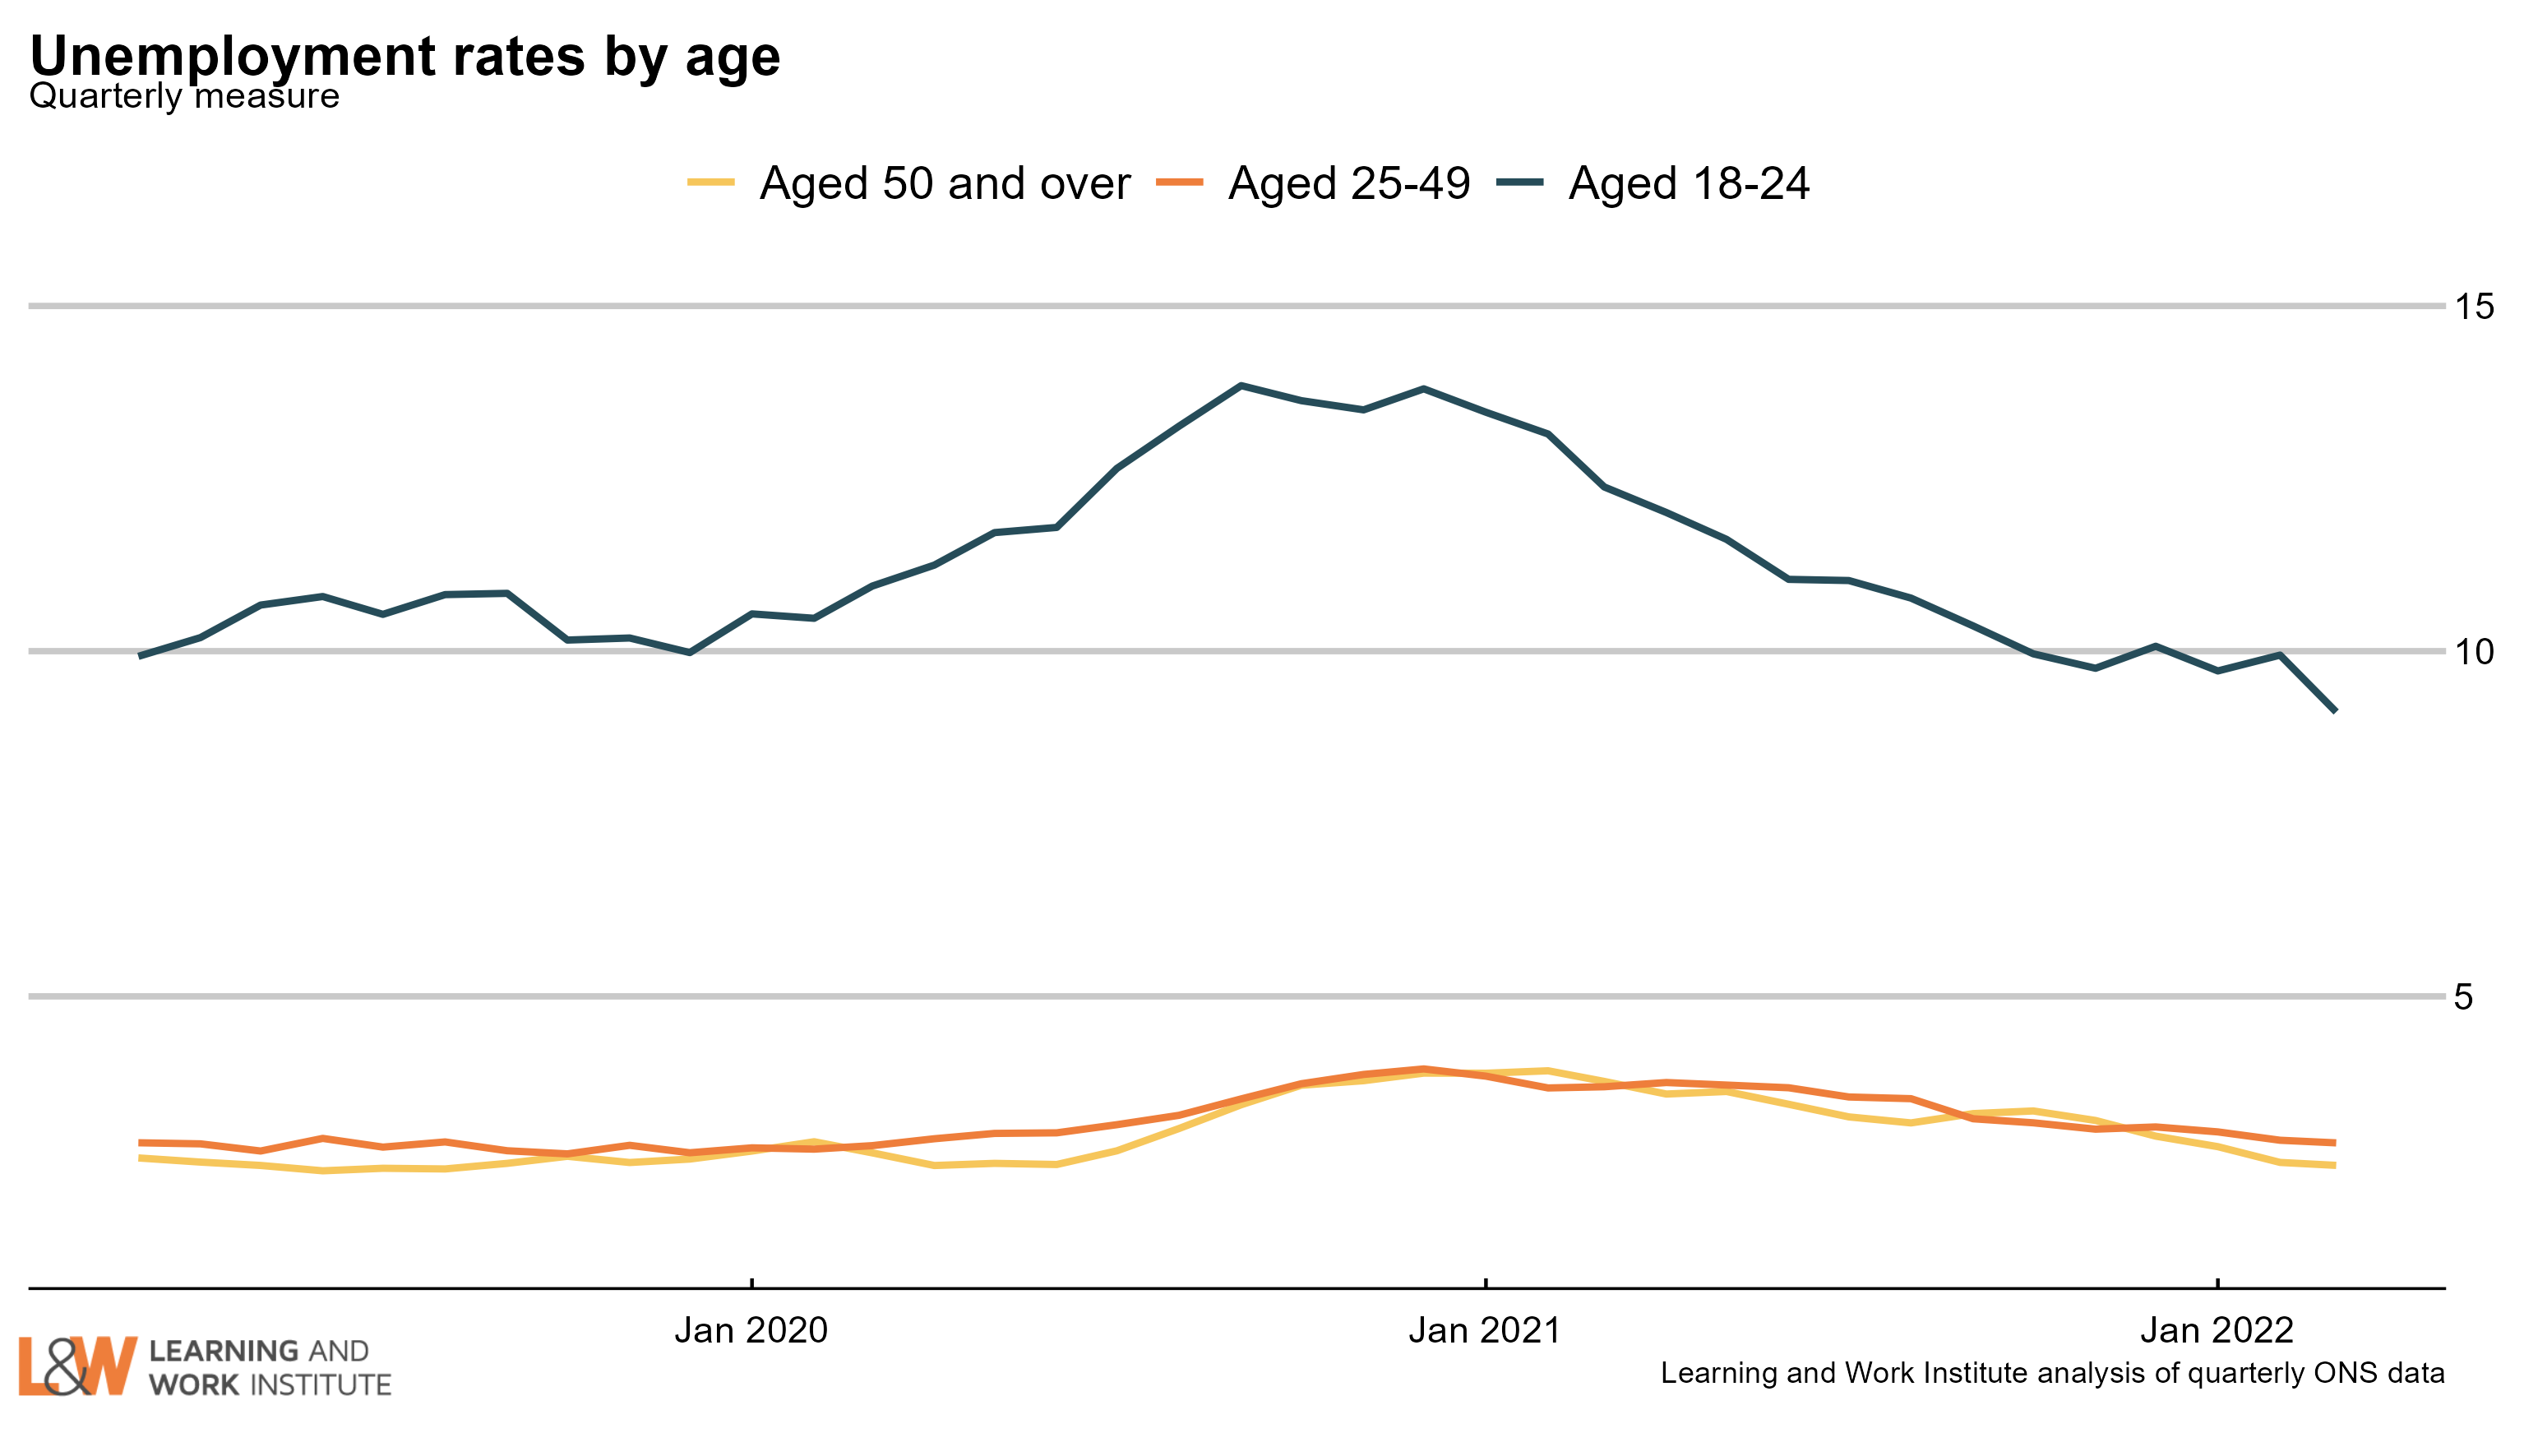 |
|
| Chart 8: Unemployment rate changes by age (counting February 2020 as 100) The 18 to 24 year old unemployment rate (including students) is 1.4 percentage points lower than in February 2020. The change is up 0.2 points for those aged 25 to 34. The change is zero for those aged 35 to 49. The change is down 0.3 points for those aged 50 to 64. The change is down 0.5 points for those aged over 65. 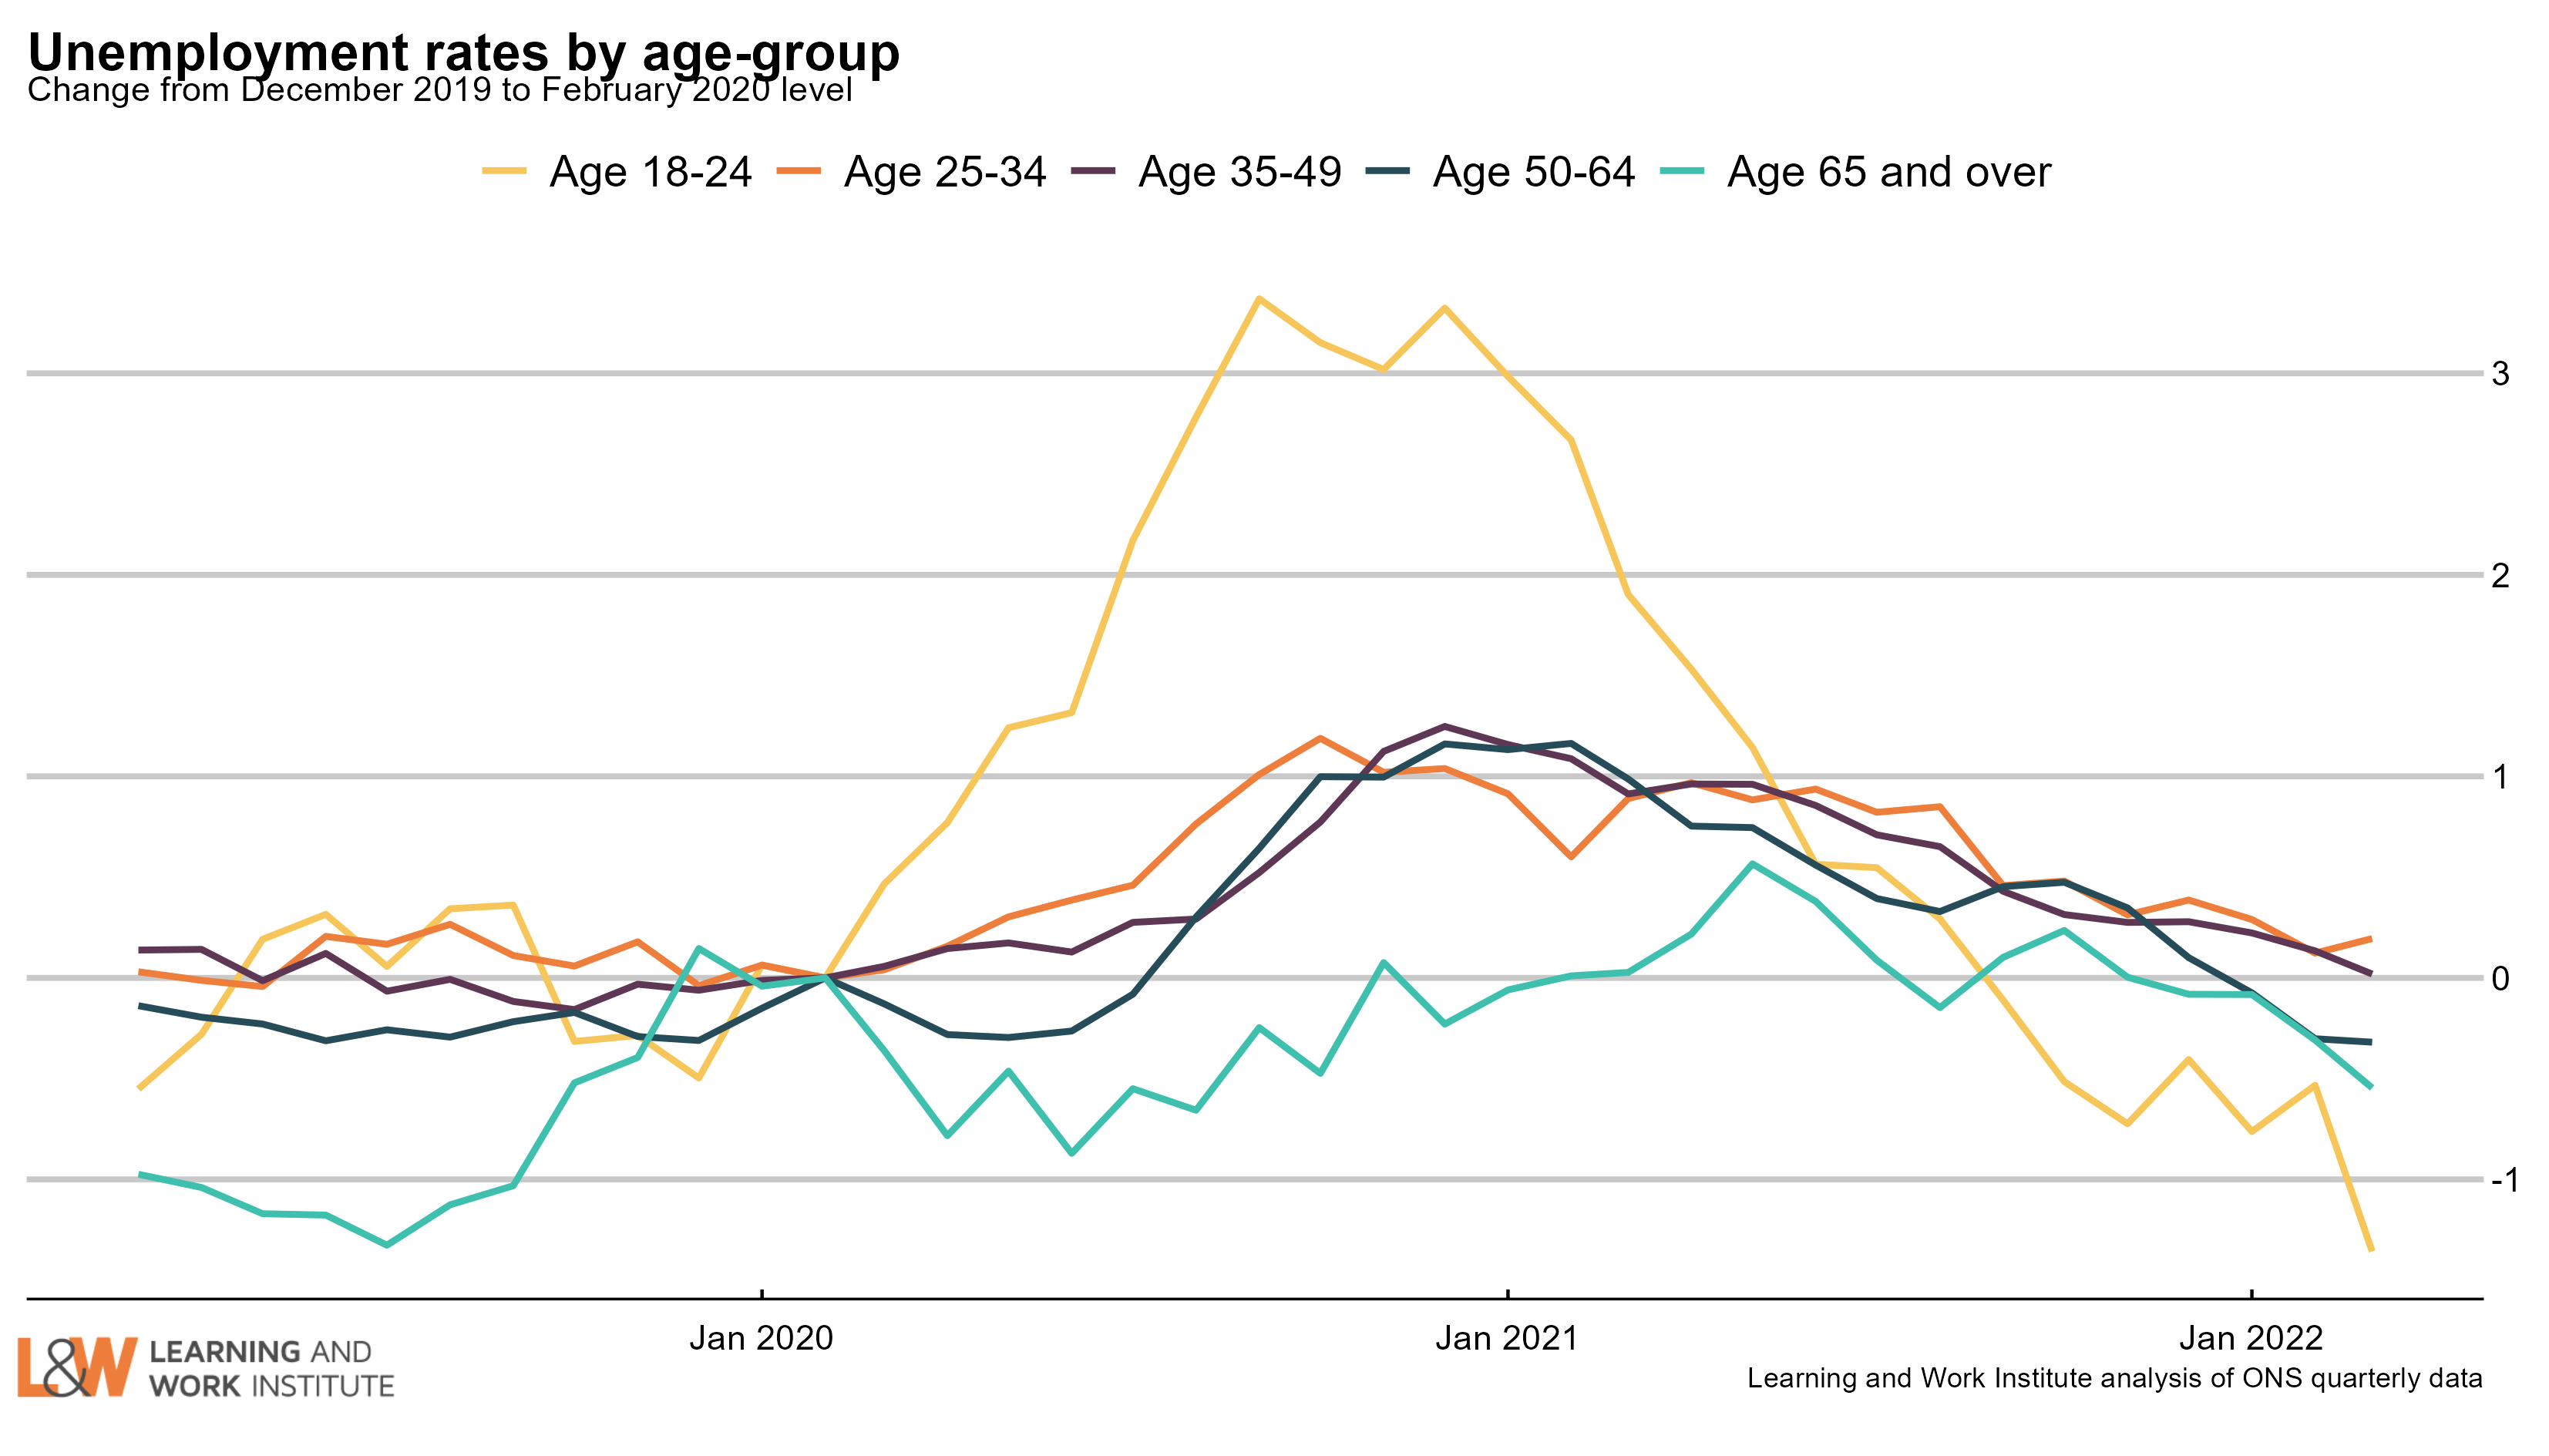 Chart 9: Vacancies – whole economy survey Headline vacancies this month increased by 7,000 to 1,295,000. The ONS' experimental single-month vacancy figures rose by 116,000 In the last quarter. The headline ONS vacancy figure is both seasonally adjusted and a three-month average. The chart shows both series. 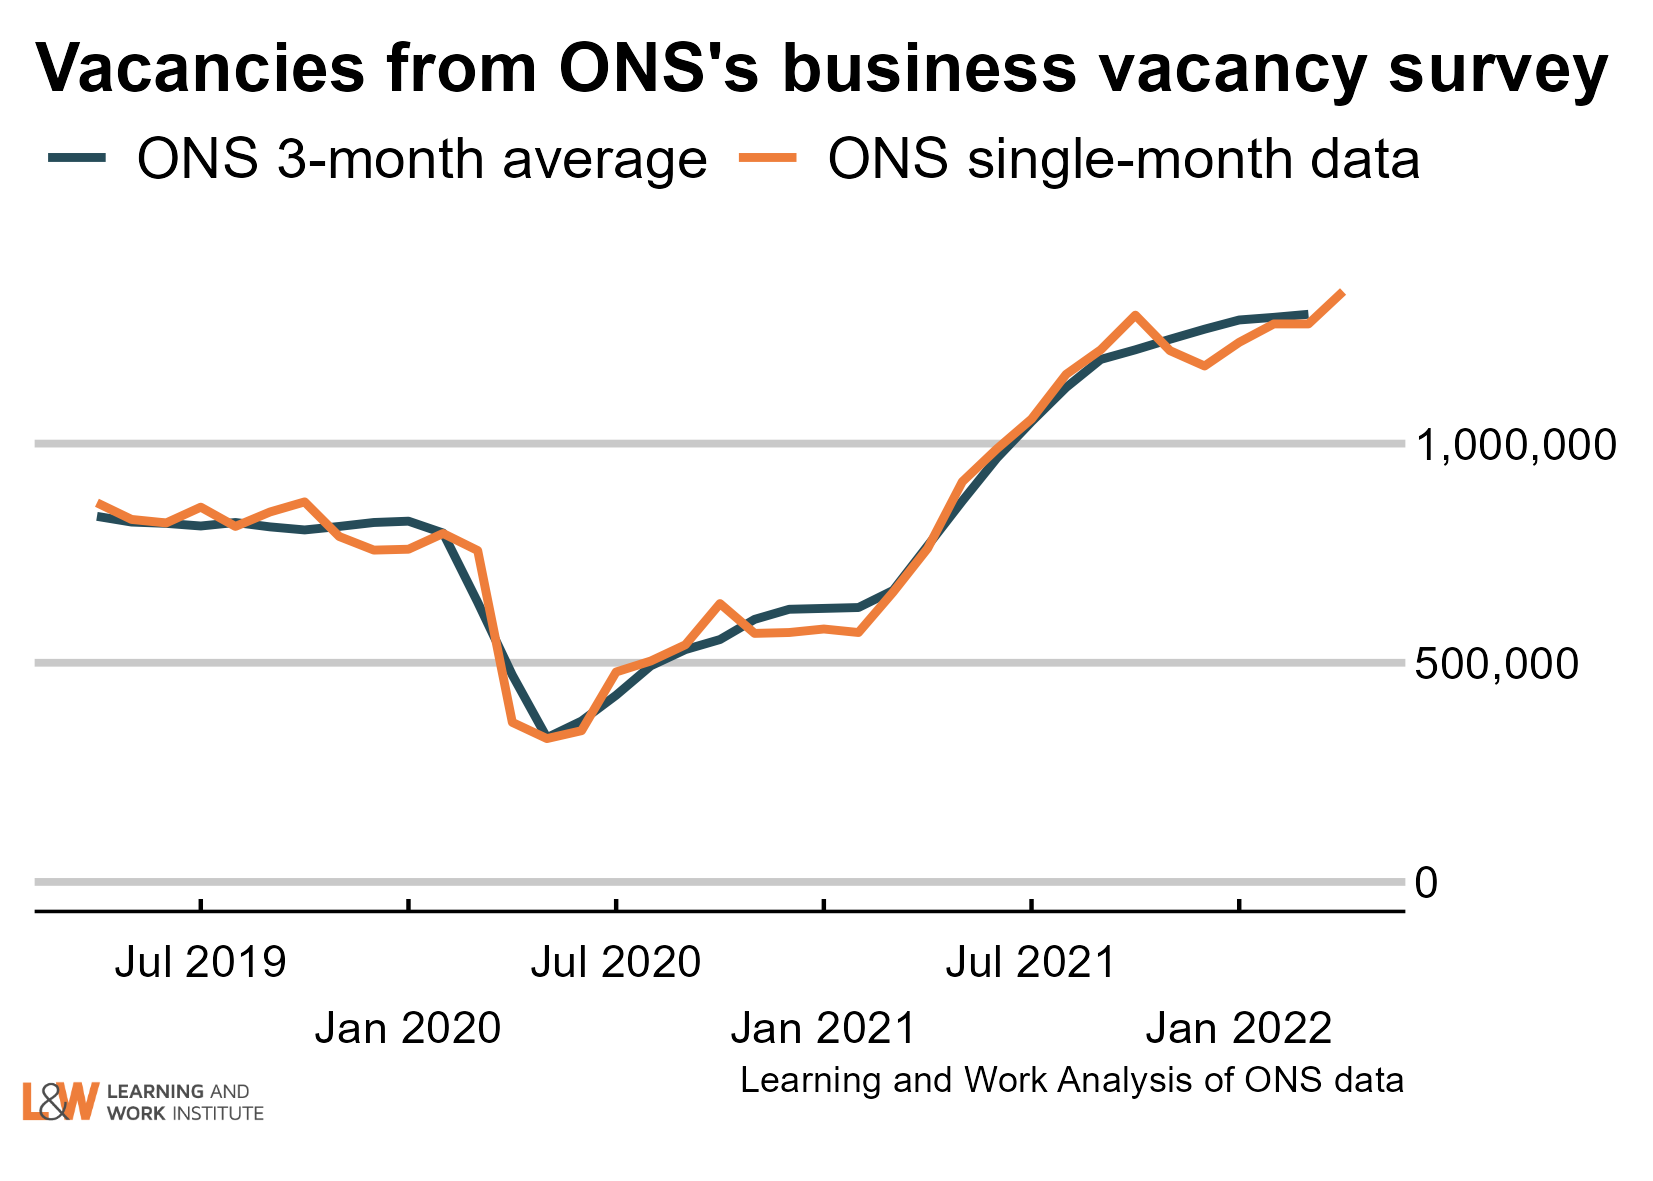 |
|
| Chart 10: Experimental single month vacancies – whole economy survey The Office for National Statistics experimental single month vacancy estimates include sectoral information. As these are not seasonally adjusted, it is better to look at annual changes. The numbers are thousands of vacancies, under each number, and on the right, the annual change in thousands of vacancies. 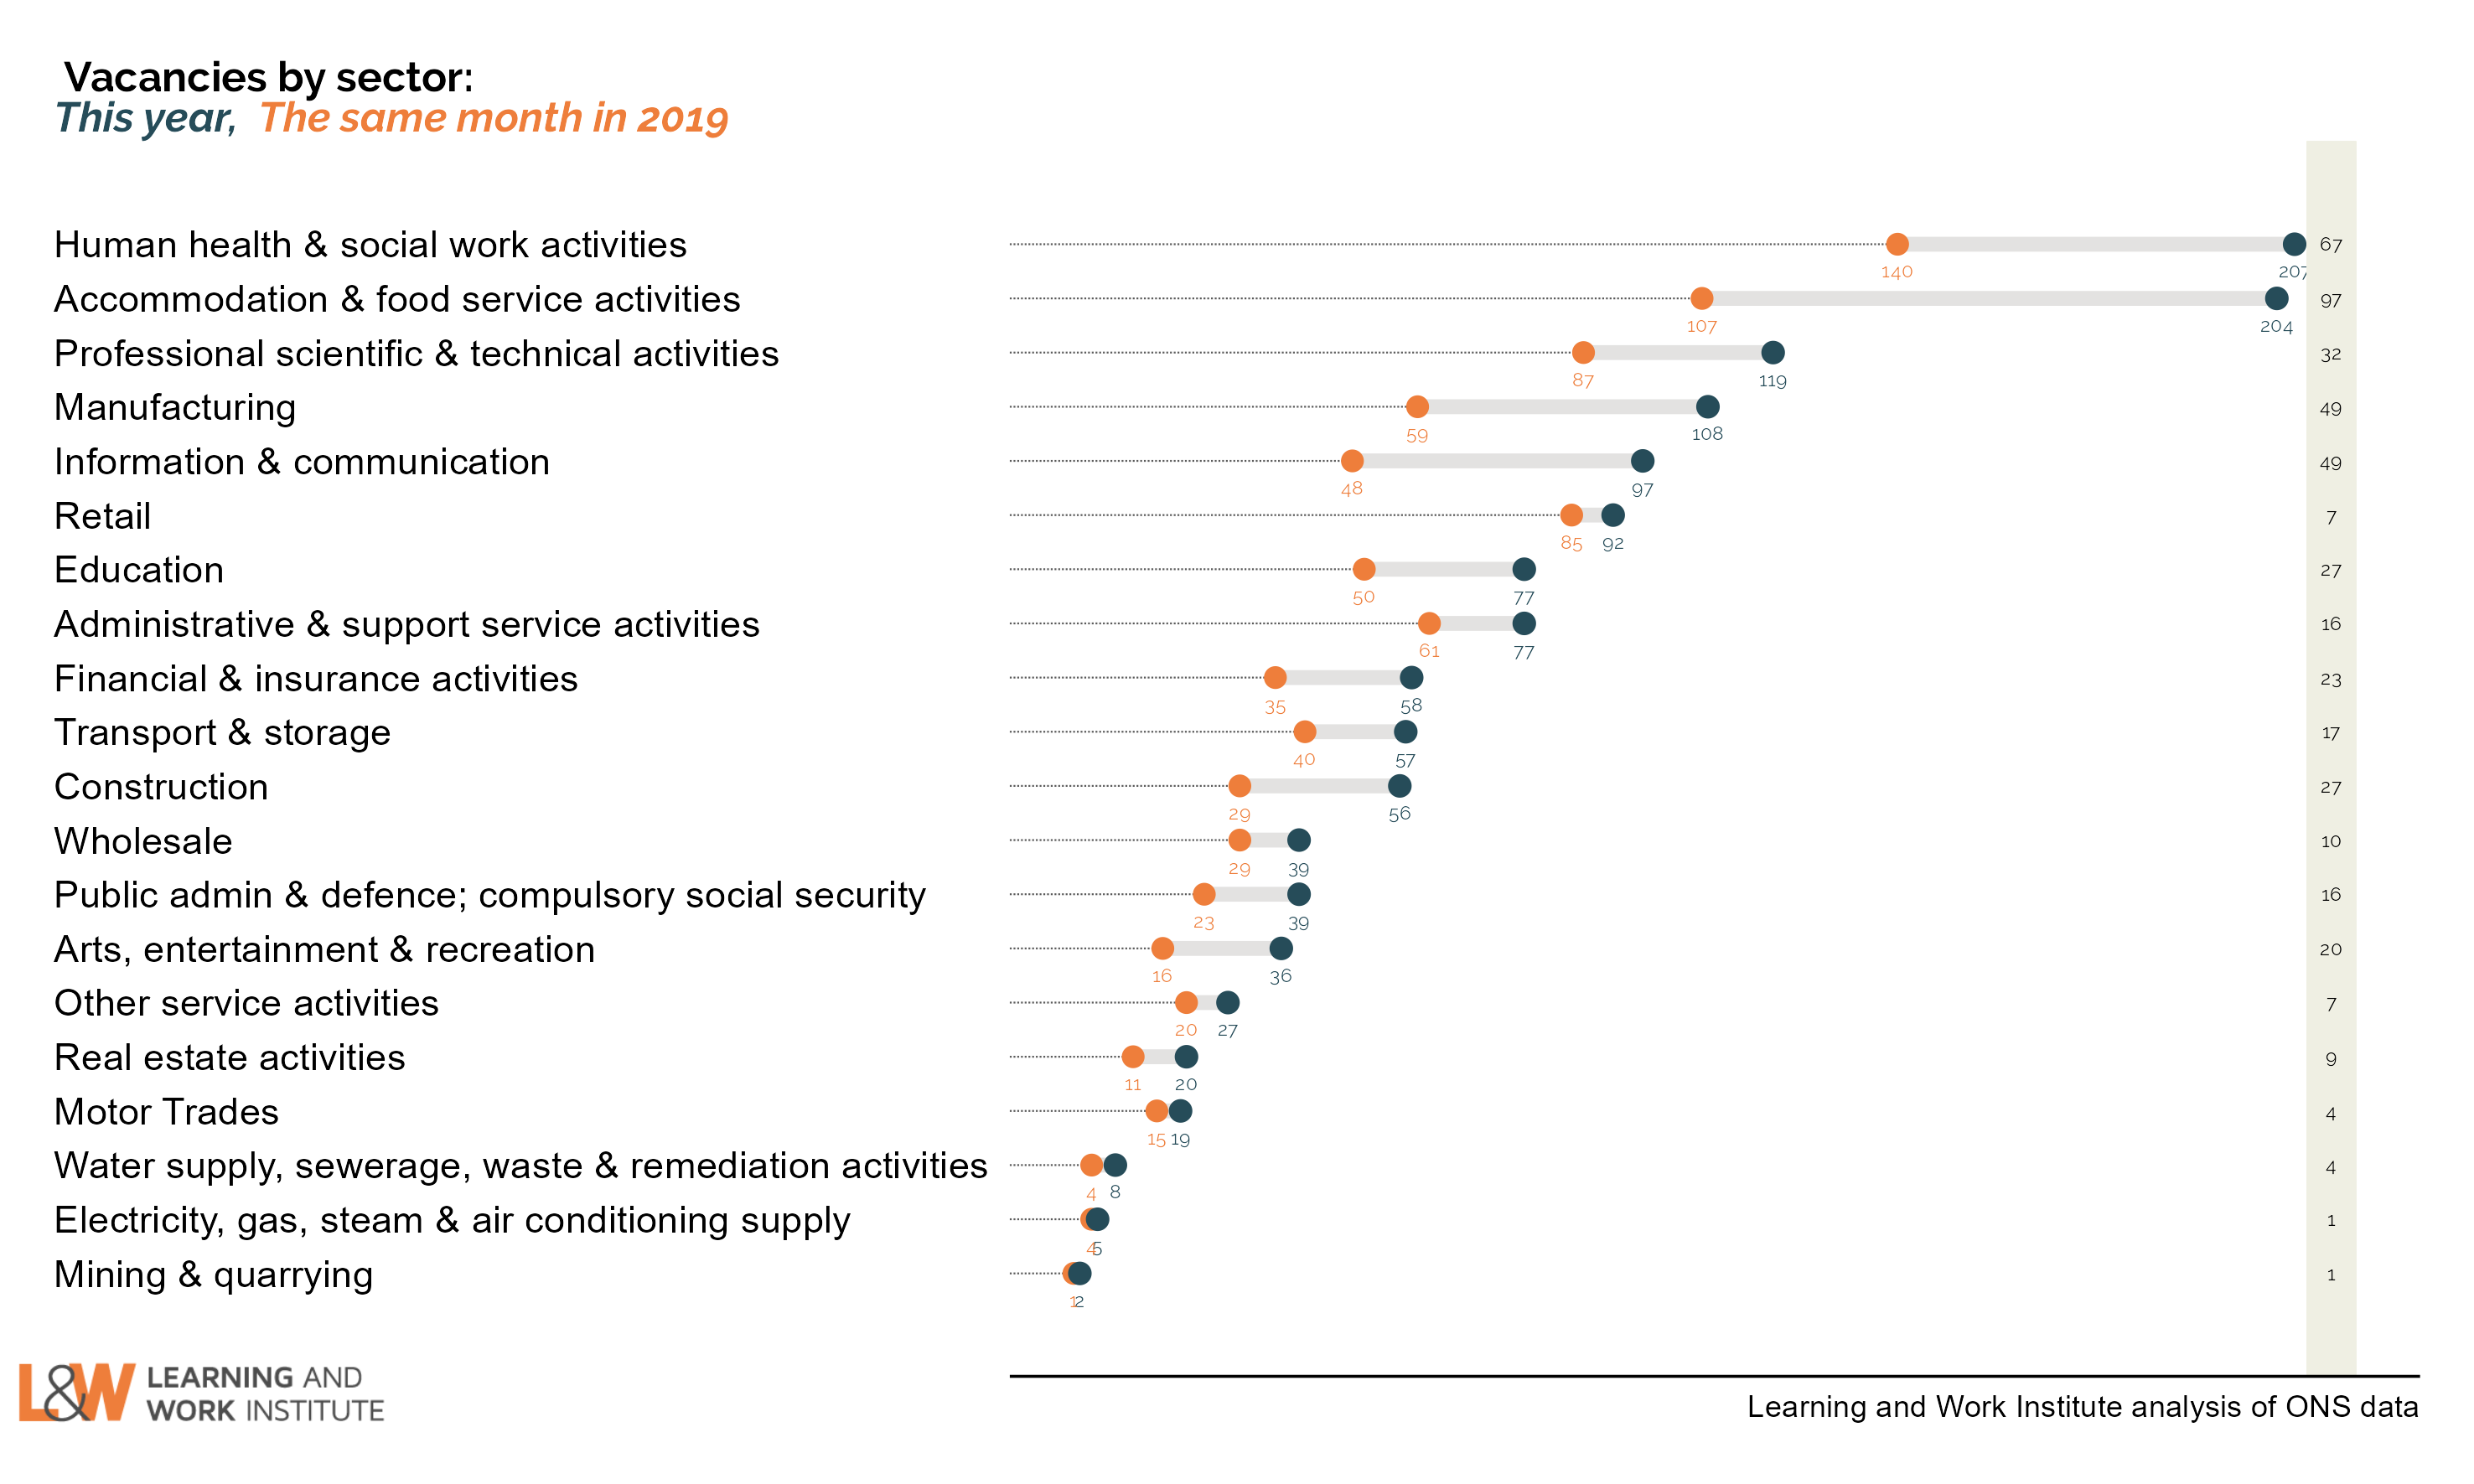 |
|
| Chart 11: Unemployed people per vacancy There are 1.0 unemployed people per vacancy. There are 31,000 more vacancies than the total of ILO unemployed (defined as both seeking work and available to start). 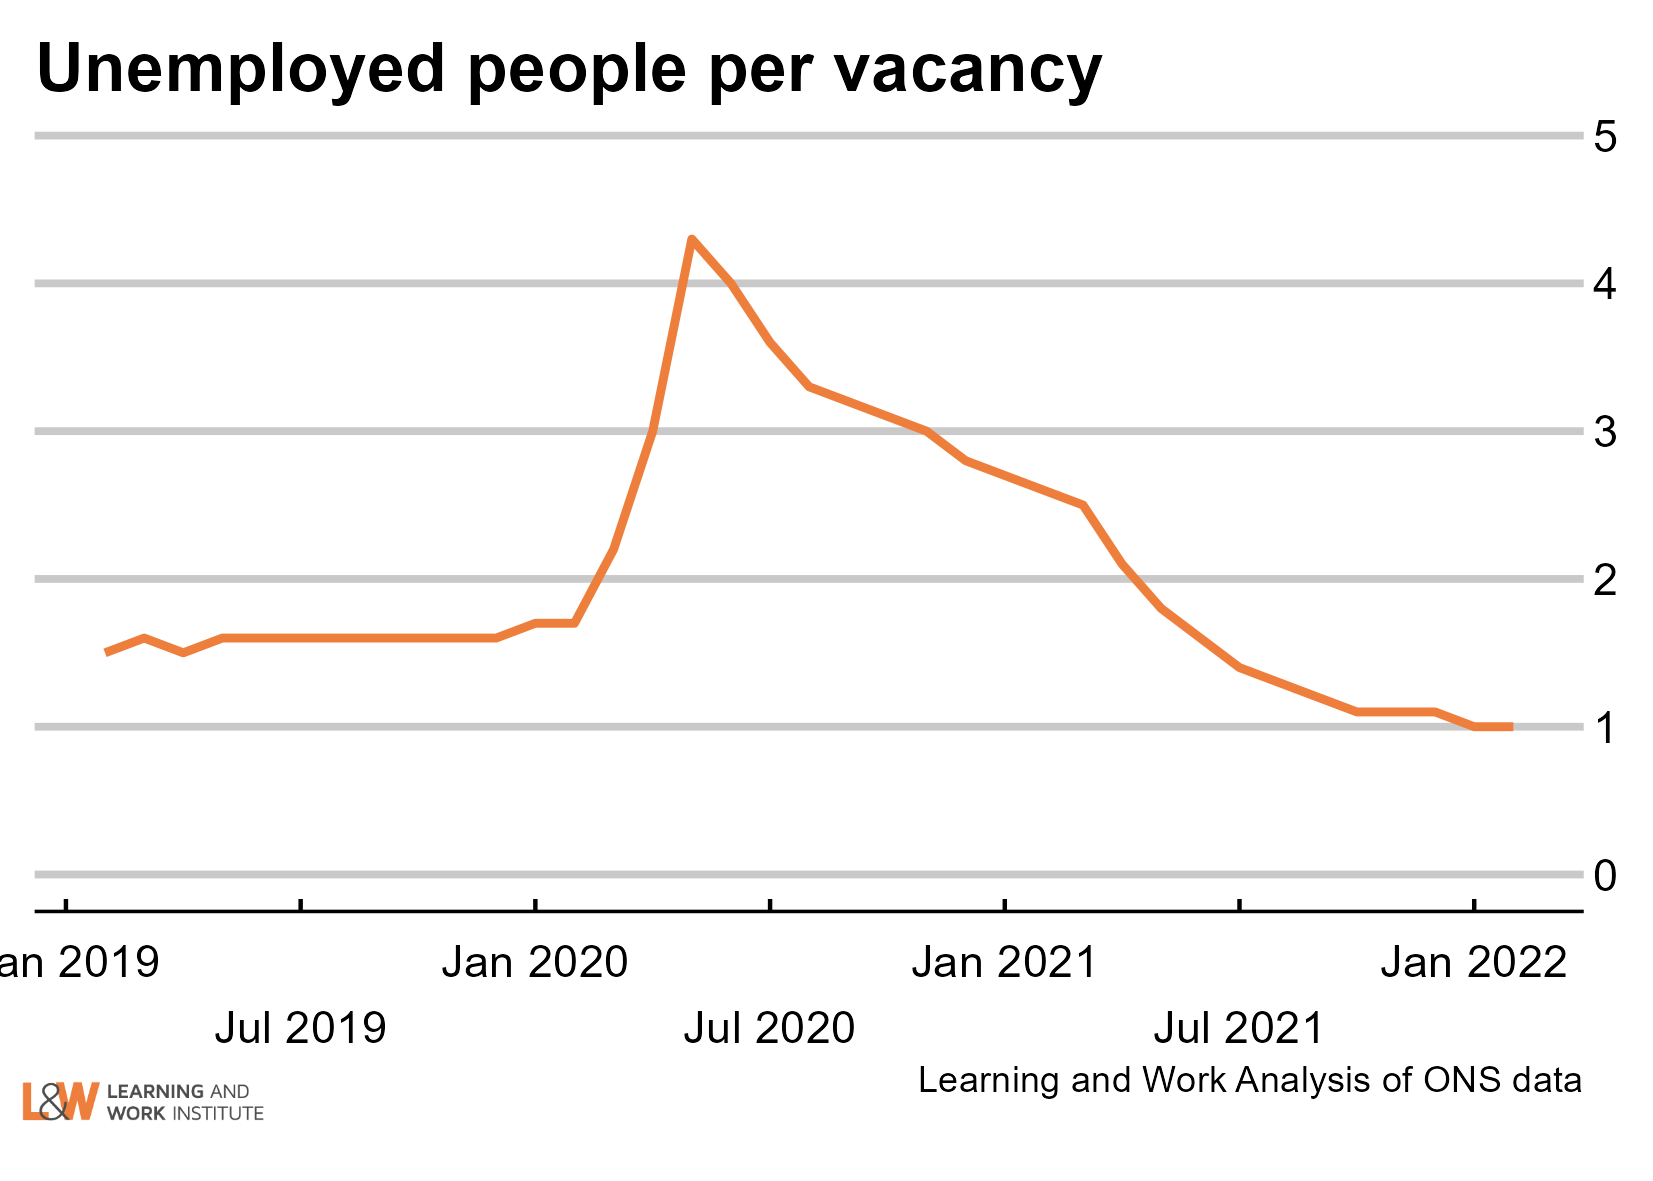 |
|
| Chart 12: Online vacancies to early May 2022 from Adzuna The online vacancies figures published on Thursday, May 12, 2022, covering the period up to Friday, May 6, 2022 are the week after the early May bank holiday. Overall online vacancies are 137% of Feb 2020. They are 7% down on their maximum. Compared with the same week in 2018, the overall vacancy level is up 10%. 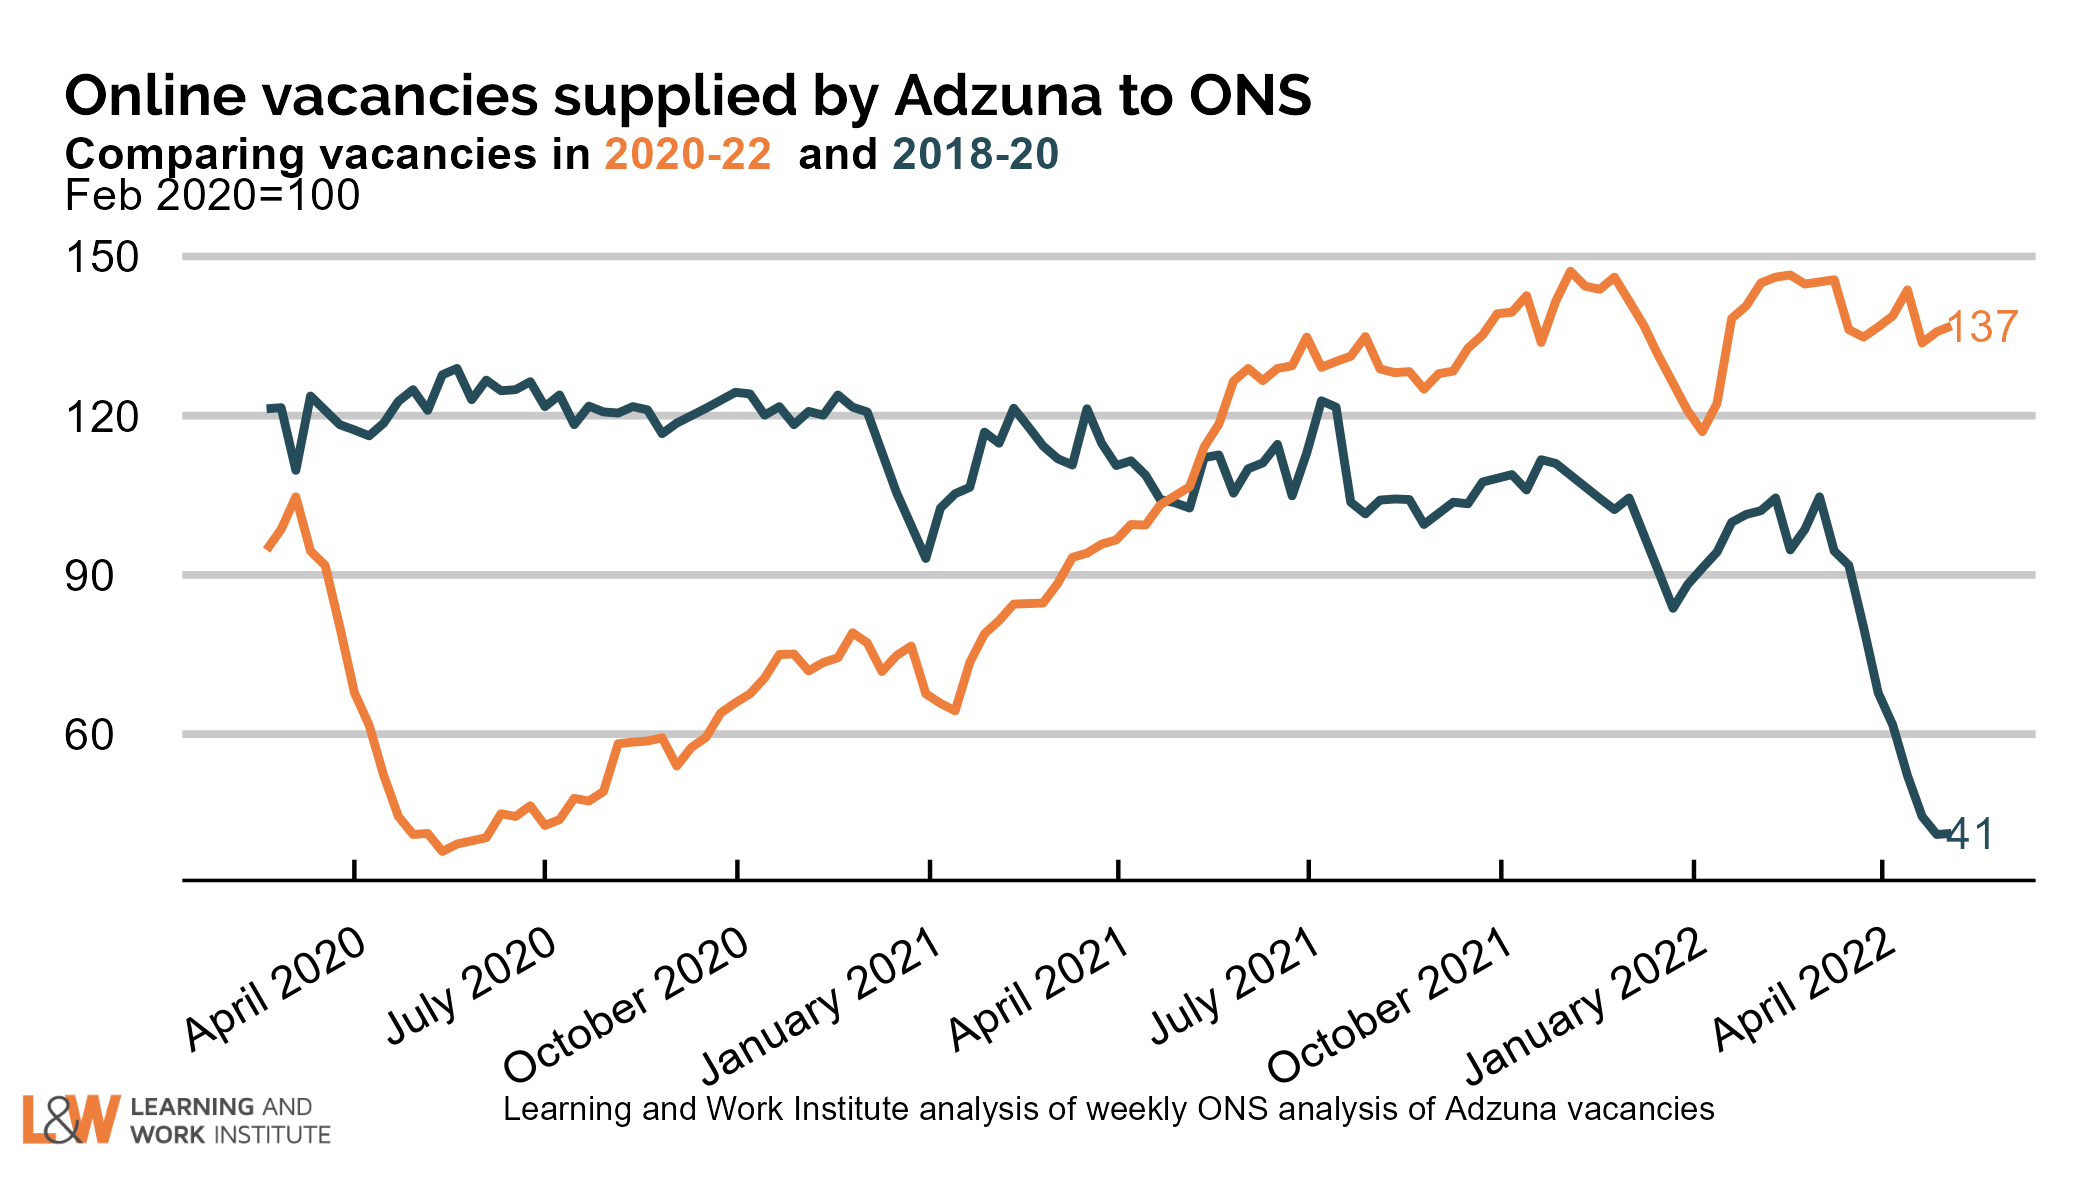 |
|
| Chart 13: UK employment Employment increased by 83,000 on the figure published last month, to 32,569,000. The chart shows both the official figures and the experimental monthly figures. The trend is likely to be upwards. 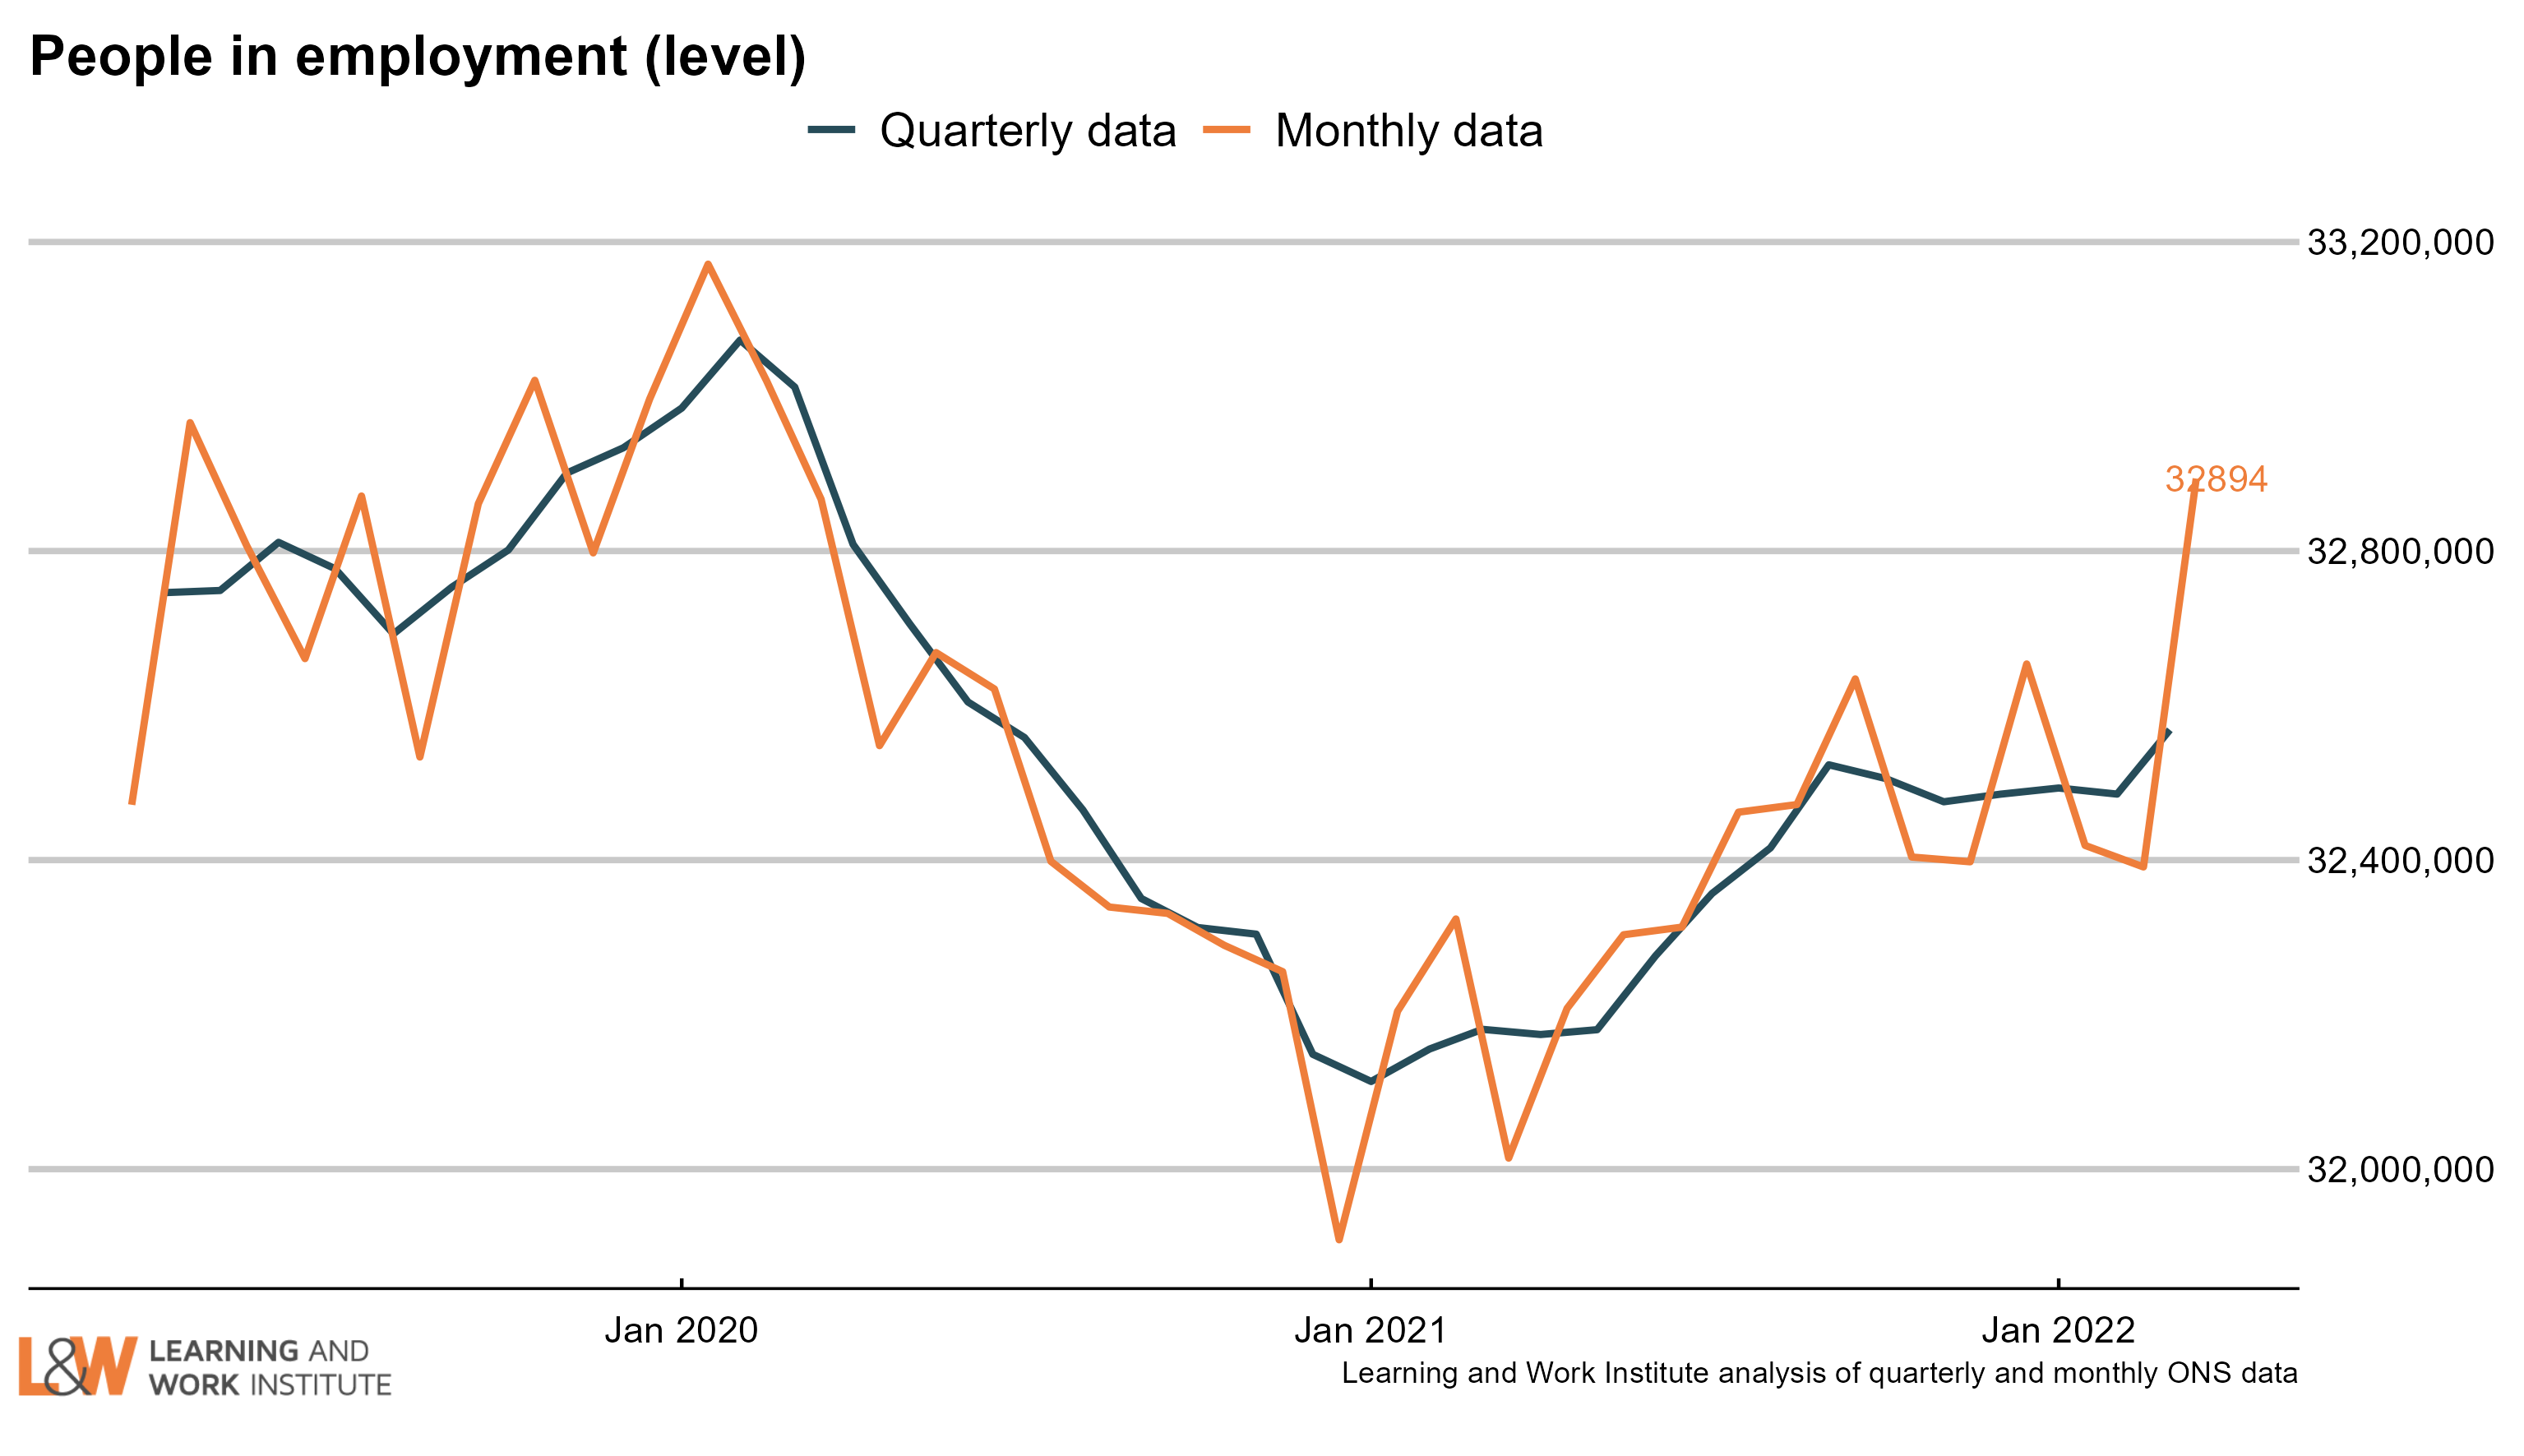 |
|
| Chart 14: Employment rate in the UK The employment rate rose by 0.1 percentage points over the quarter, to 75.7%. The chart shows both the official figures and the experimental monthly figures. The trend is likely to be upwards. 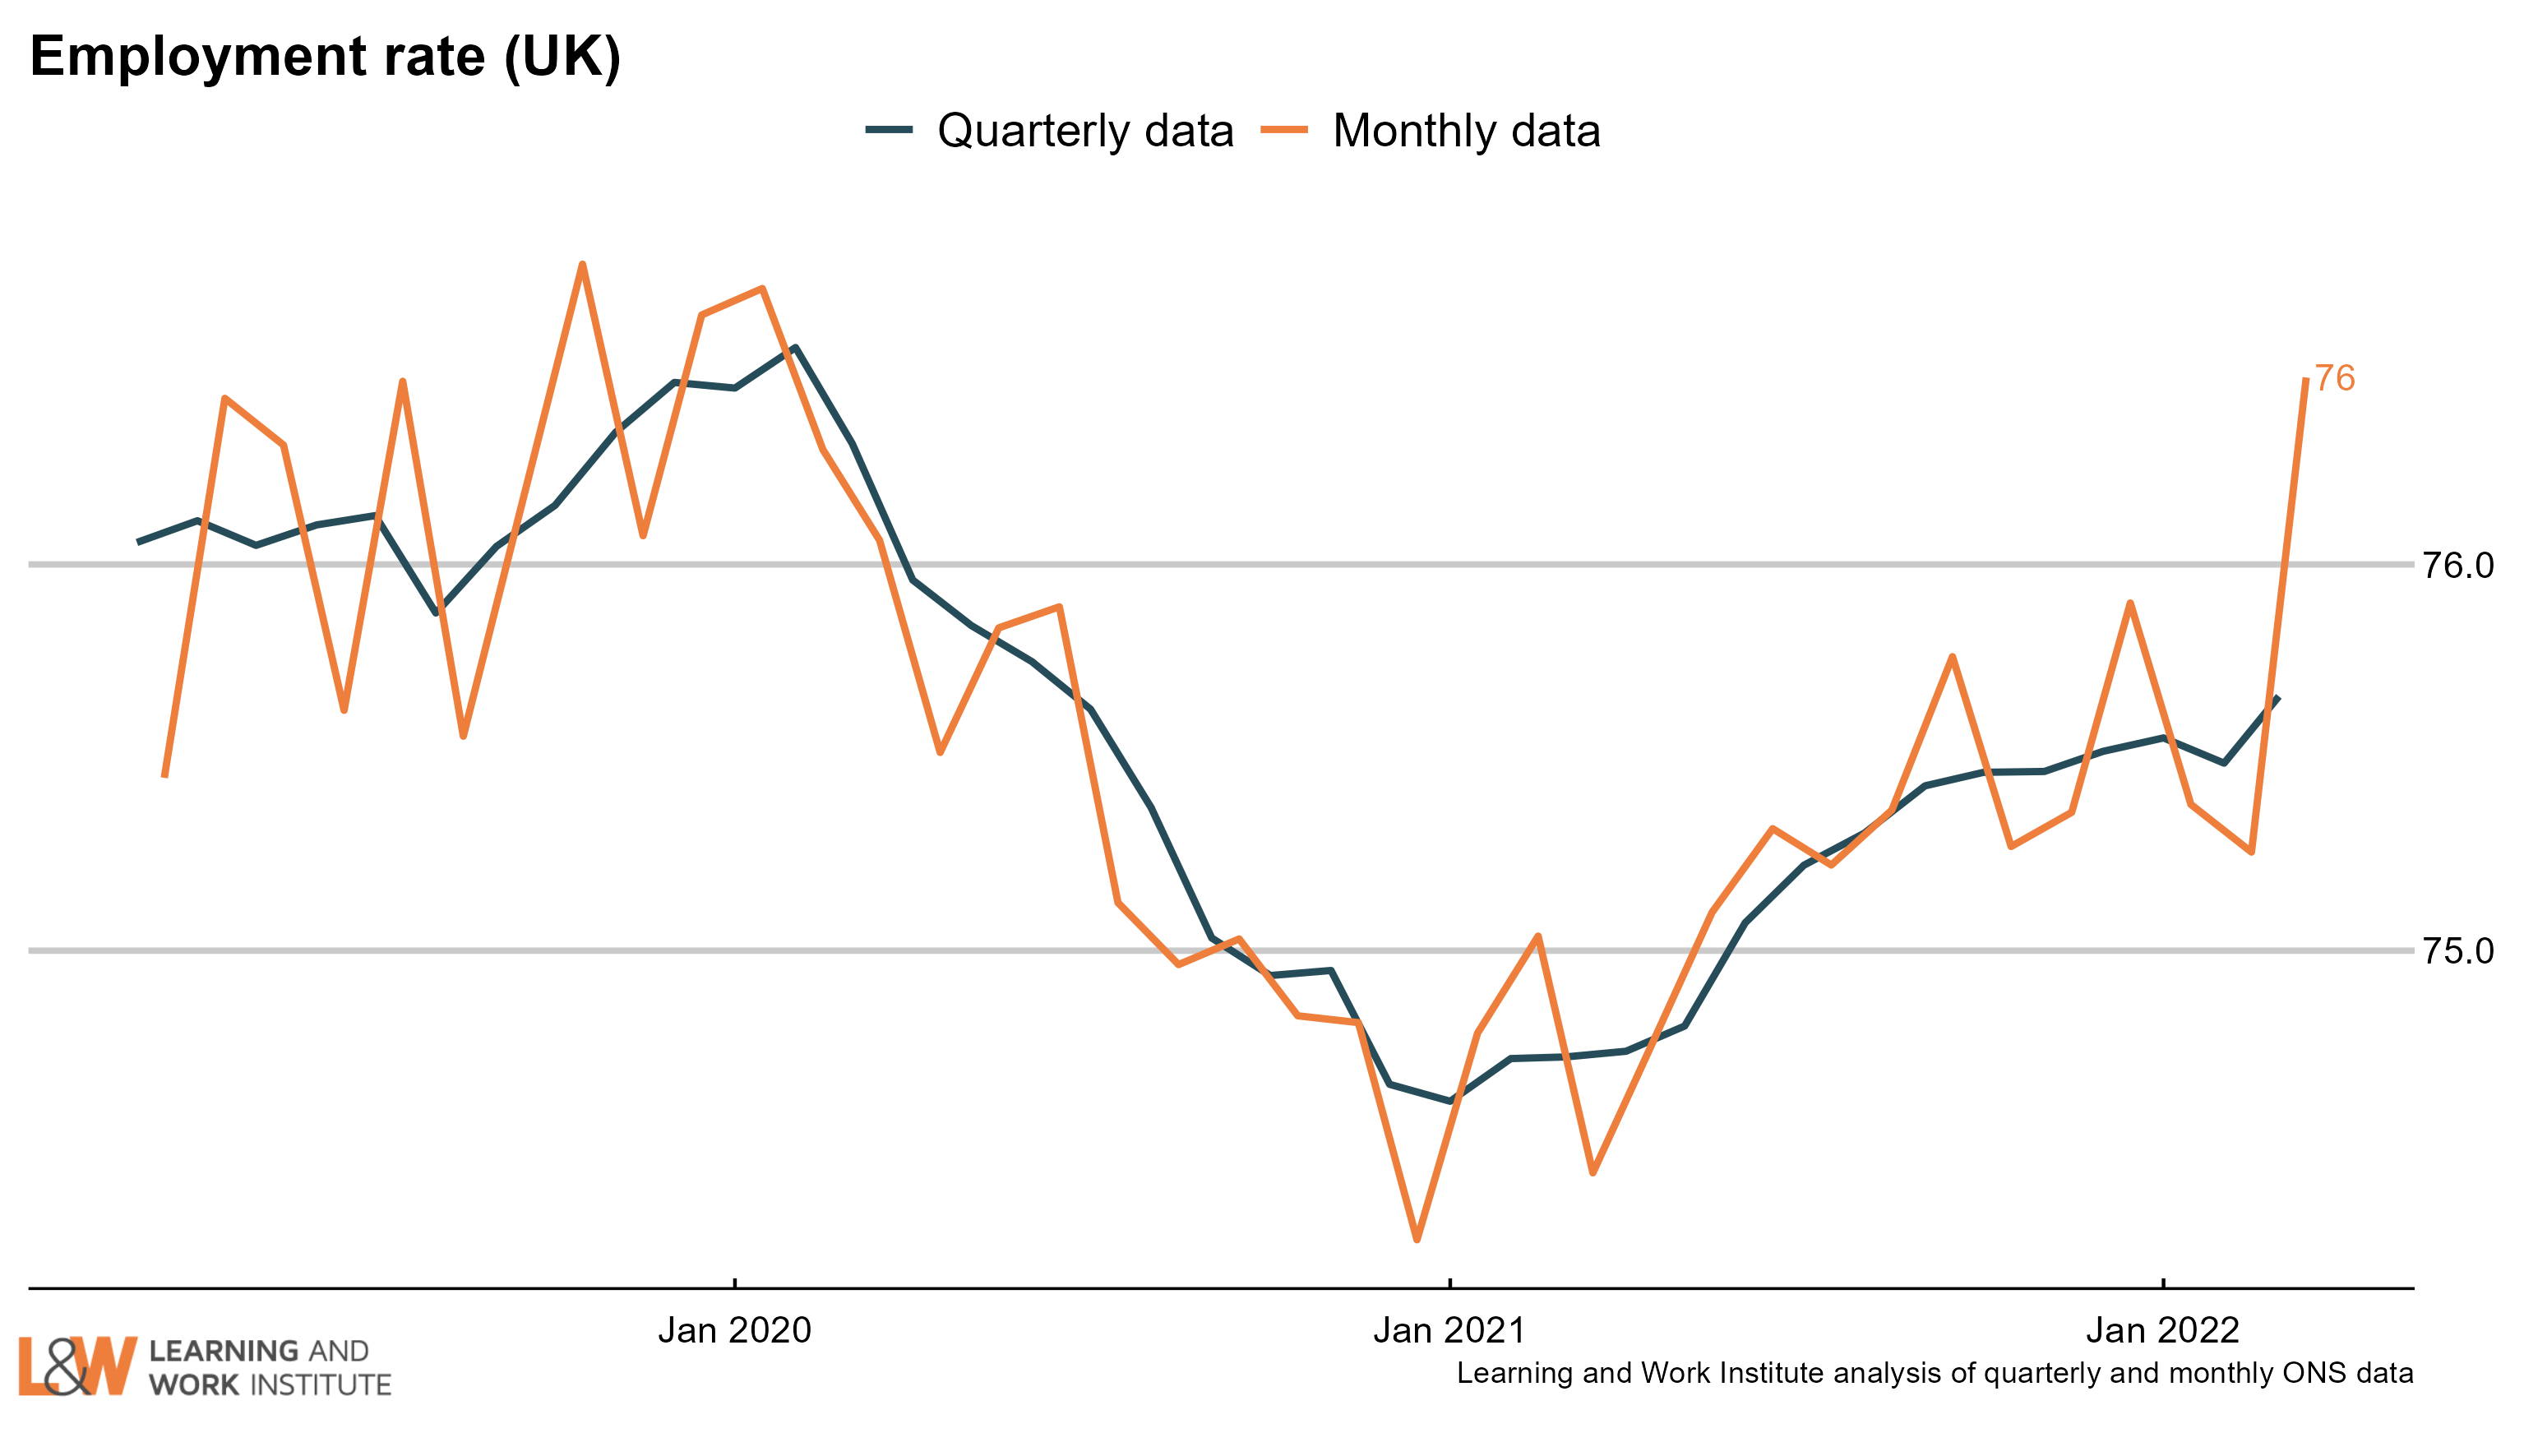 |
|
| Chart 15: Economic inactivity – the long-term sick or disabled The number of people who are economically inactive (that is, not working and not currently looking for work) who are long-term sick or disabled has risen 8.6% in the last nine months to more than 2.3 million working age people. 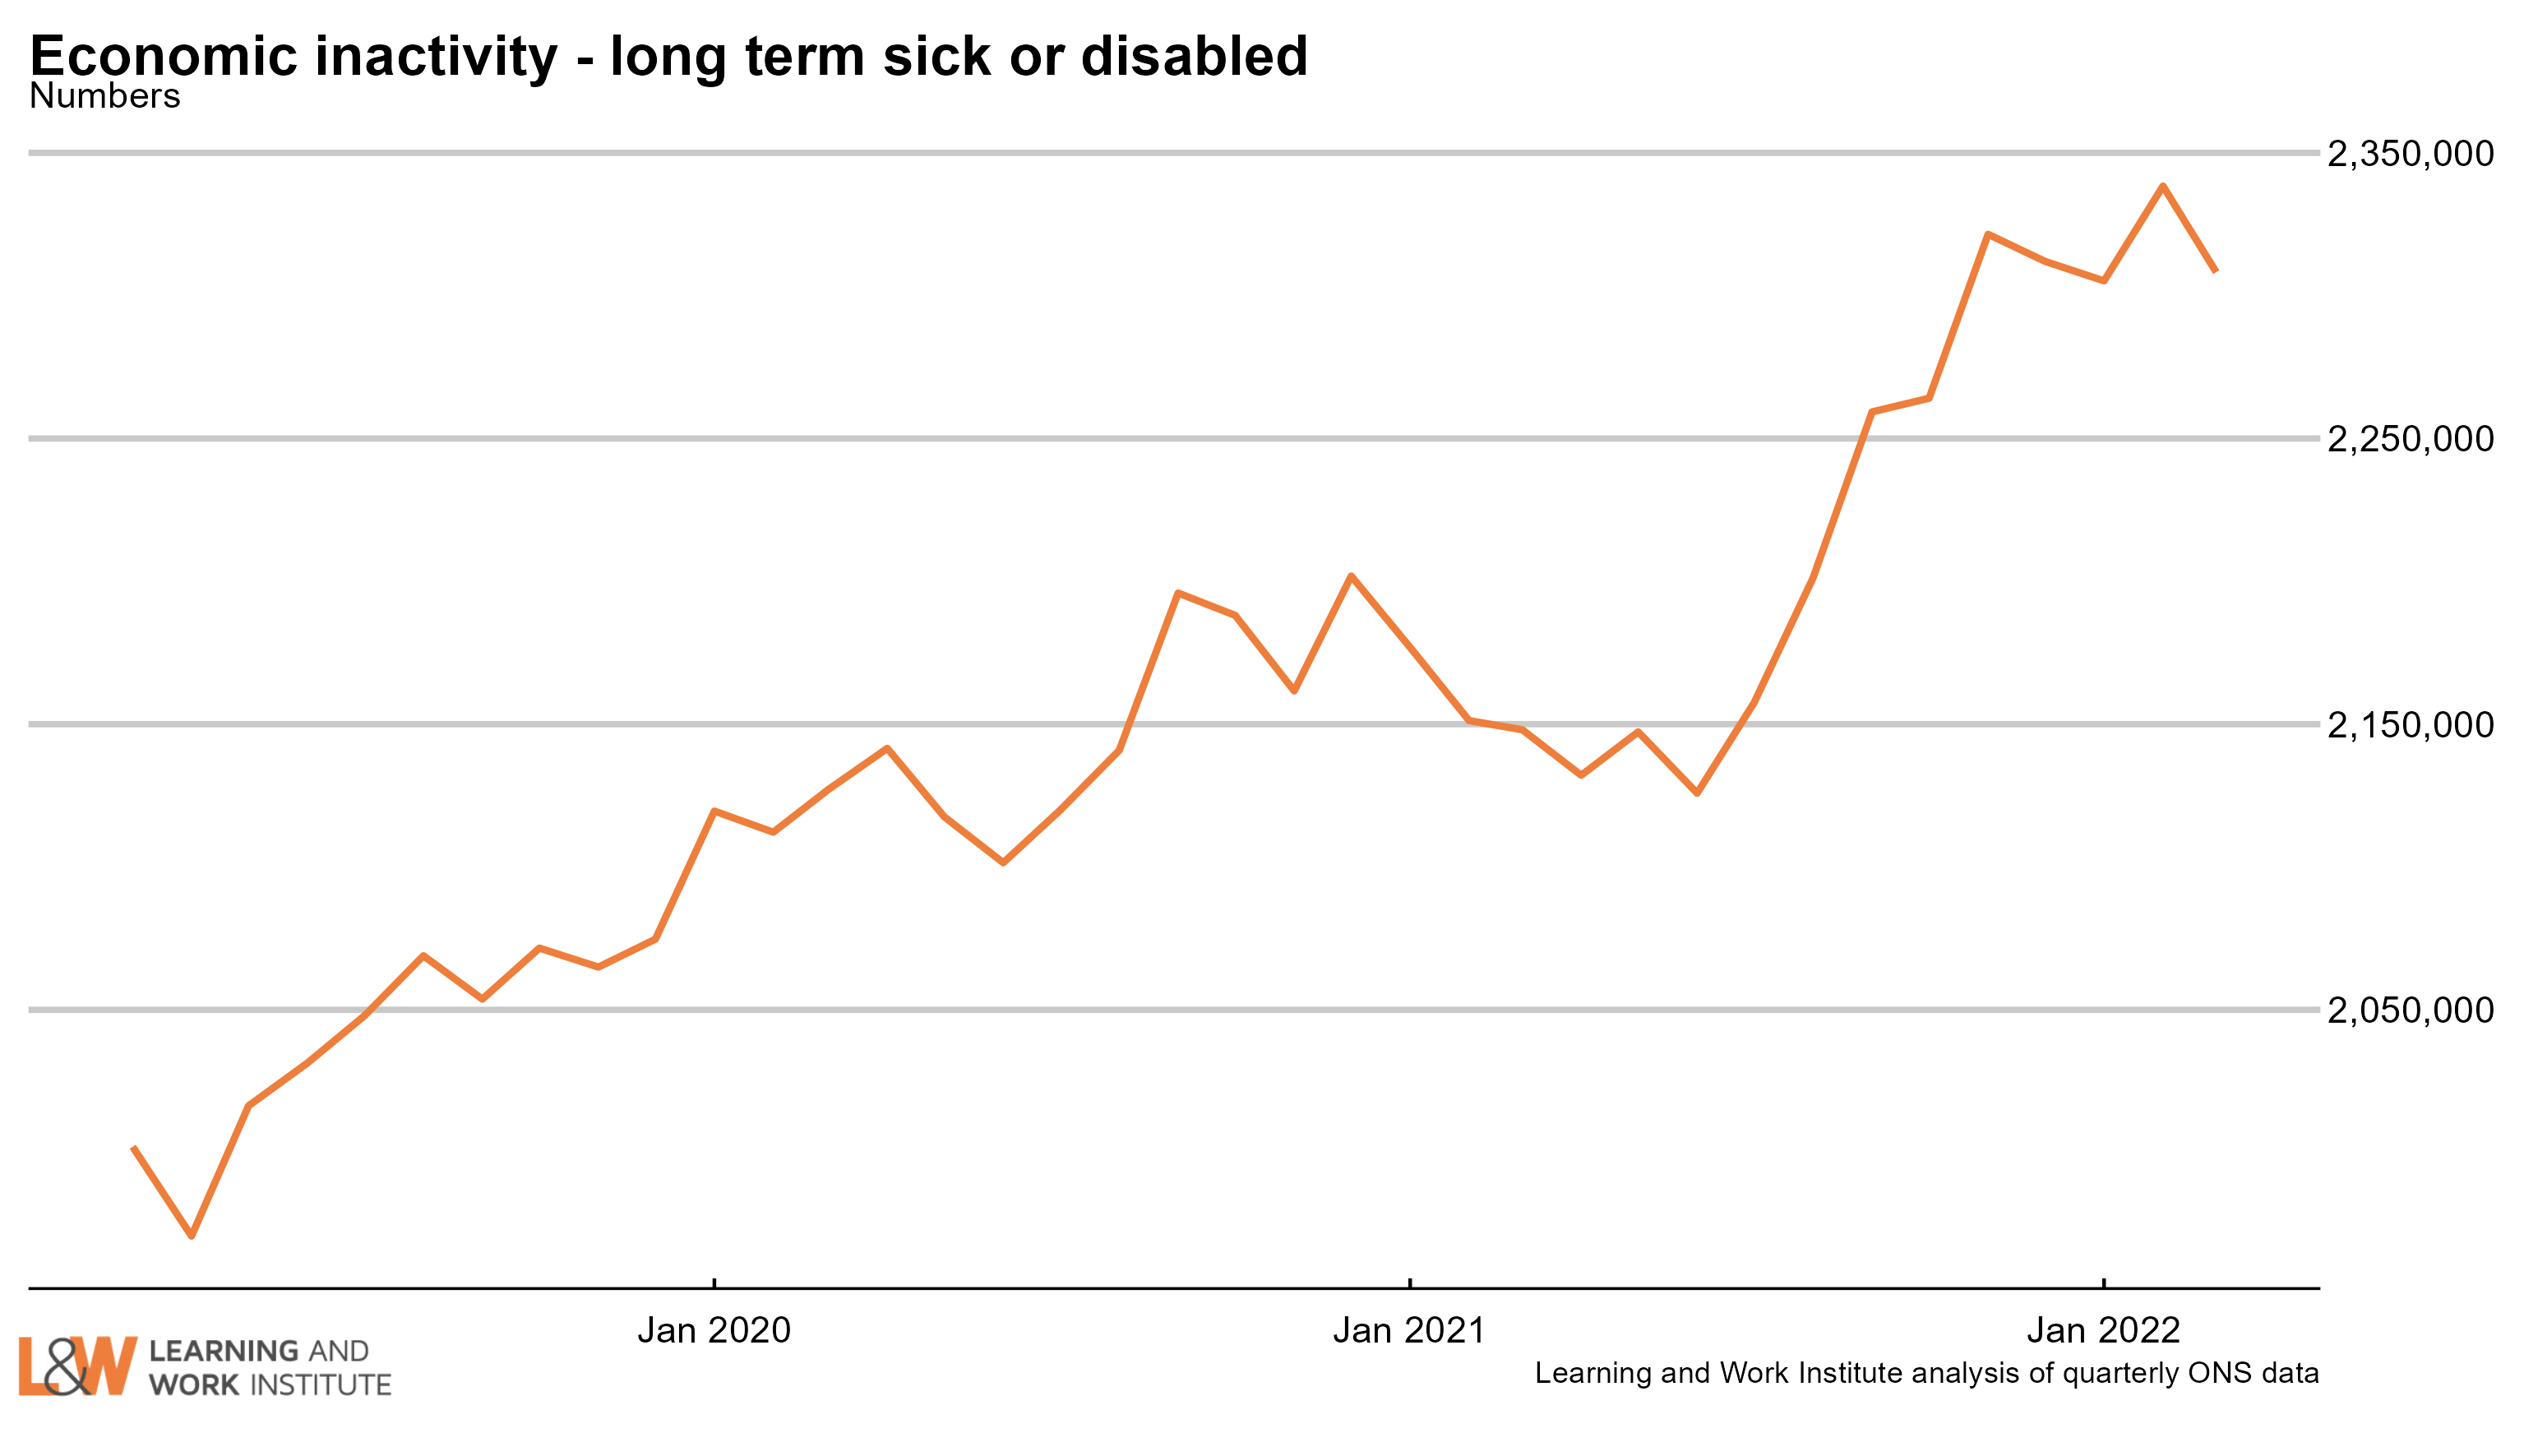 |
|
| Chart 16: Economic inactivity – people looking after family The survey figures showing those looking after family and not doing paid work or looking for paid work had been trending downwards but have been rising steadily since early 2021. 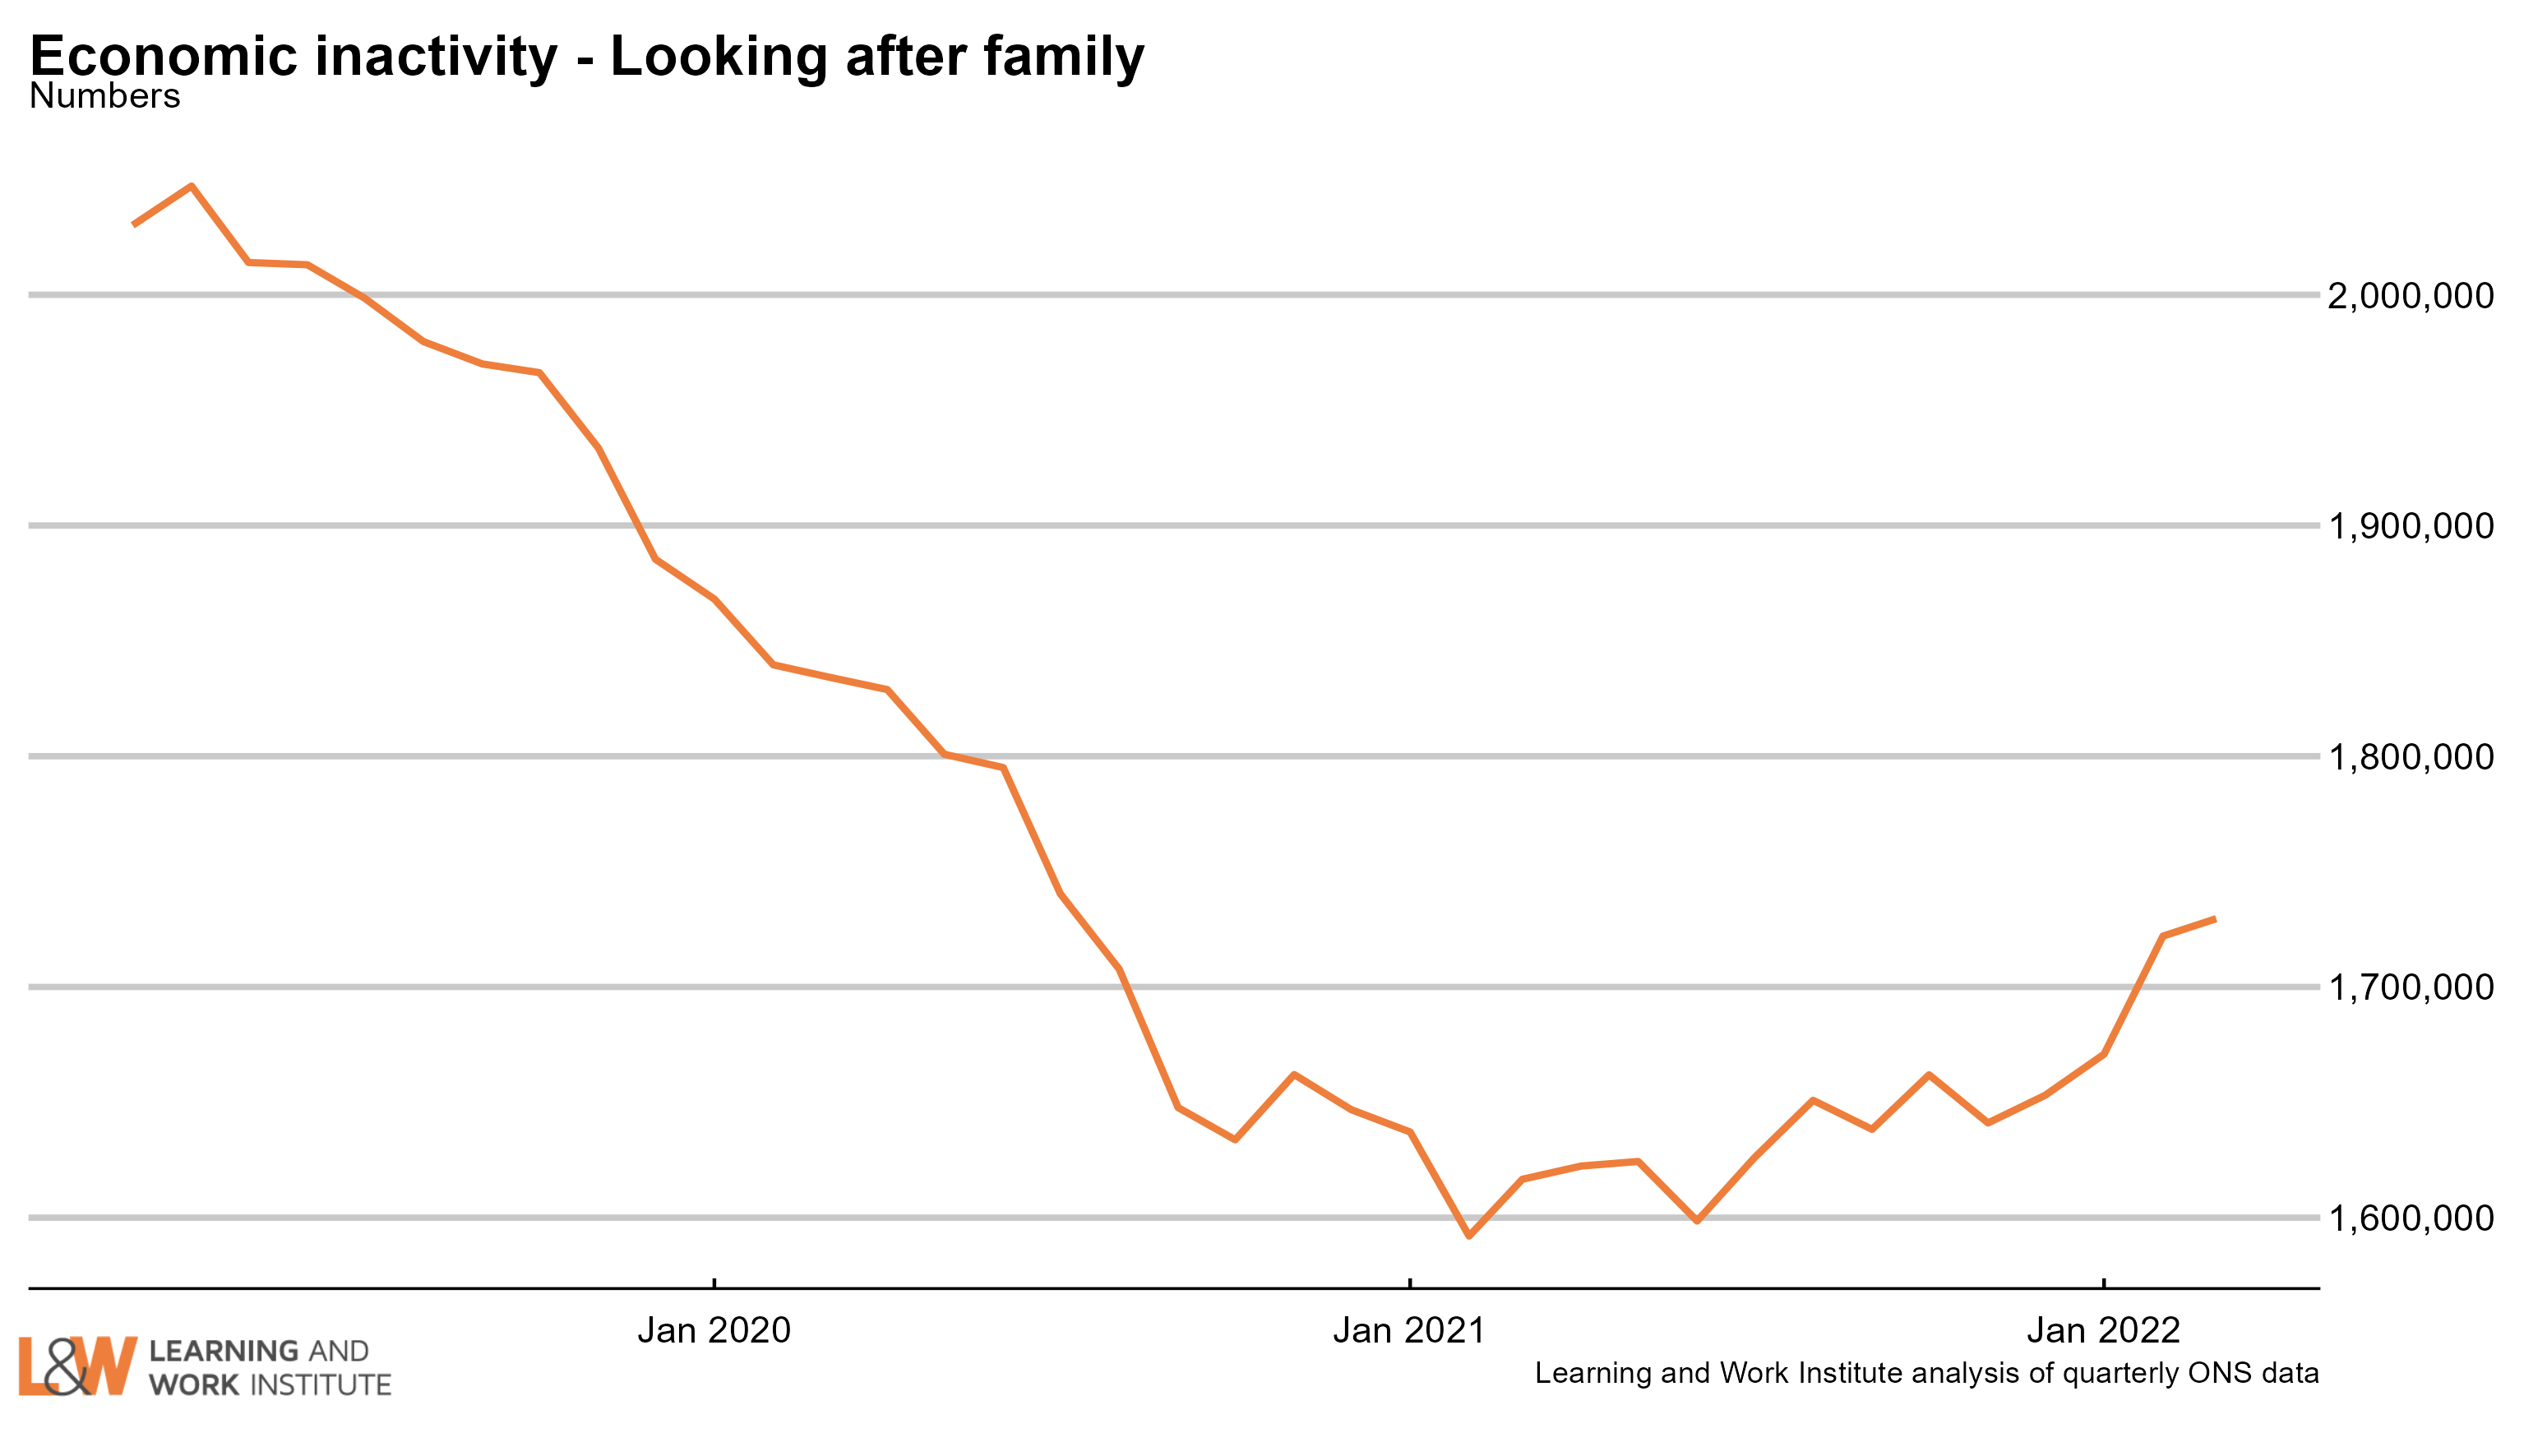 |
|
| Chart 17: Economic inactivity – other inactive In the Coronavirus period, people who were not working or looking for work due to Covid are included in this group. The number in this category increased sharply at the time, and has continued at a high level. A very high proportion of this group want to work. 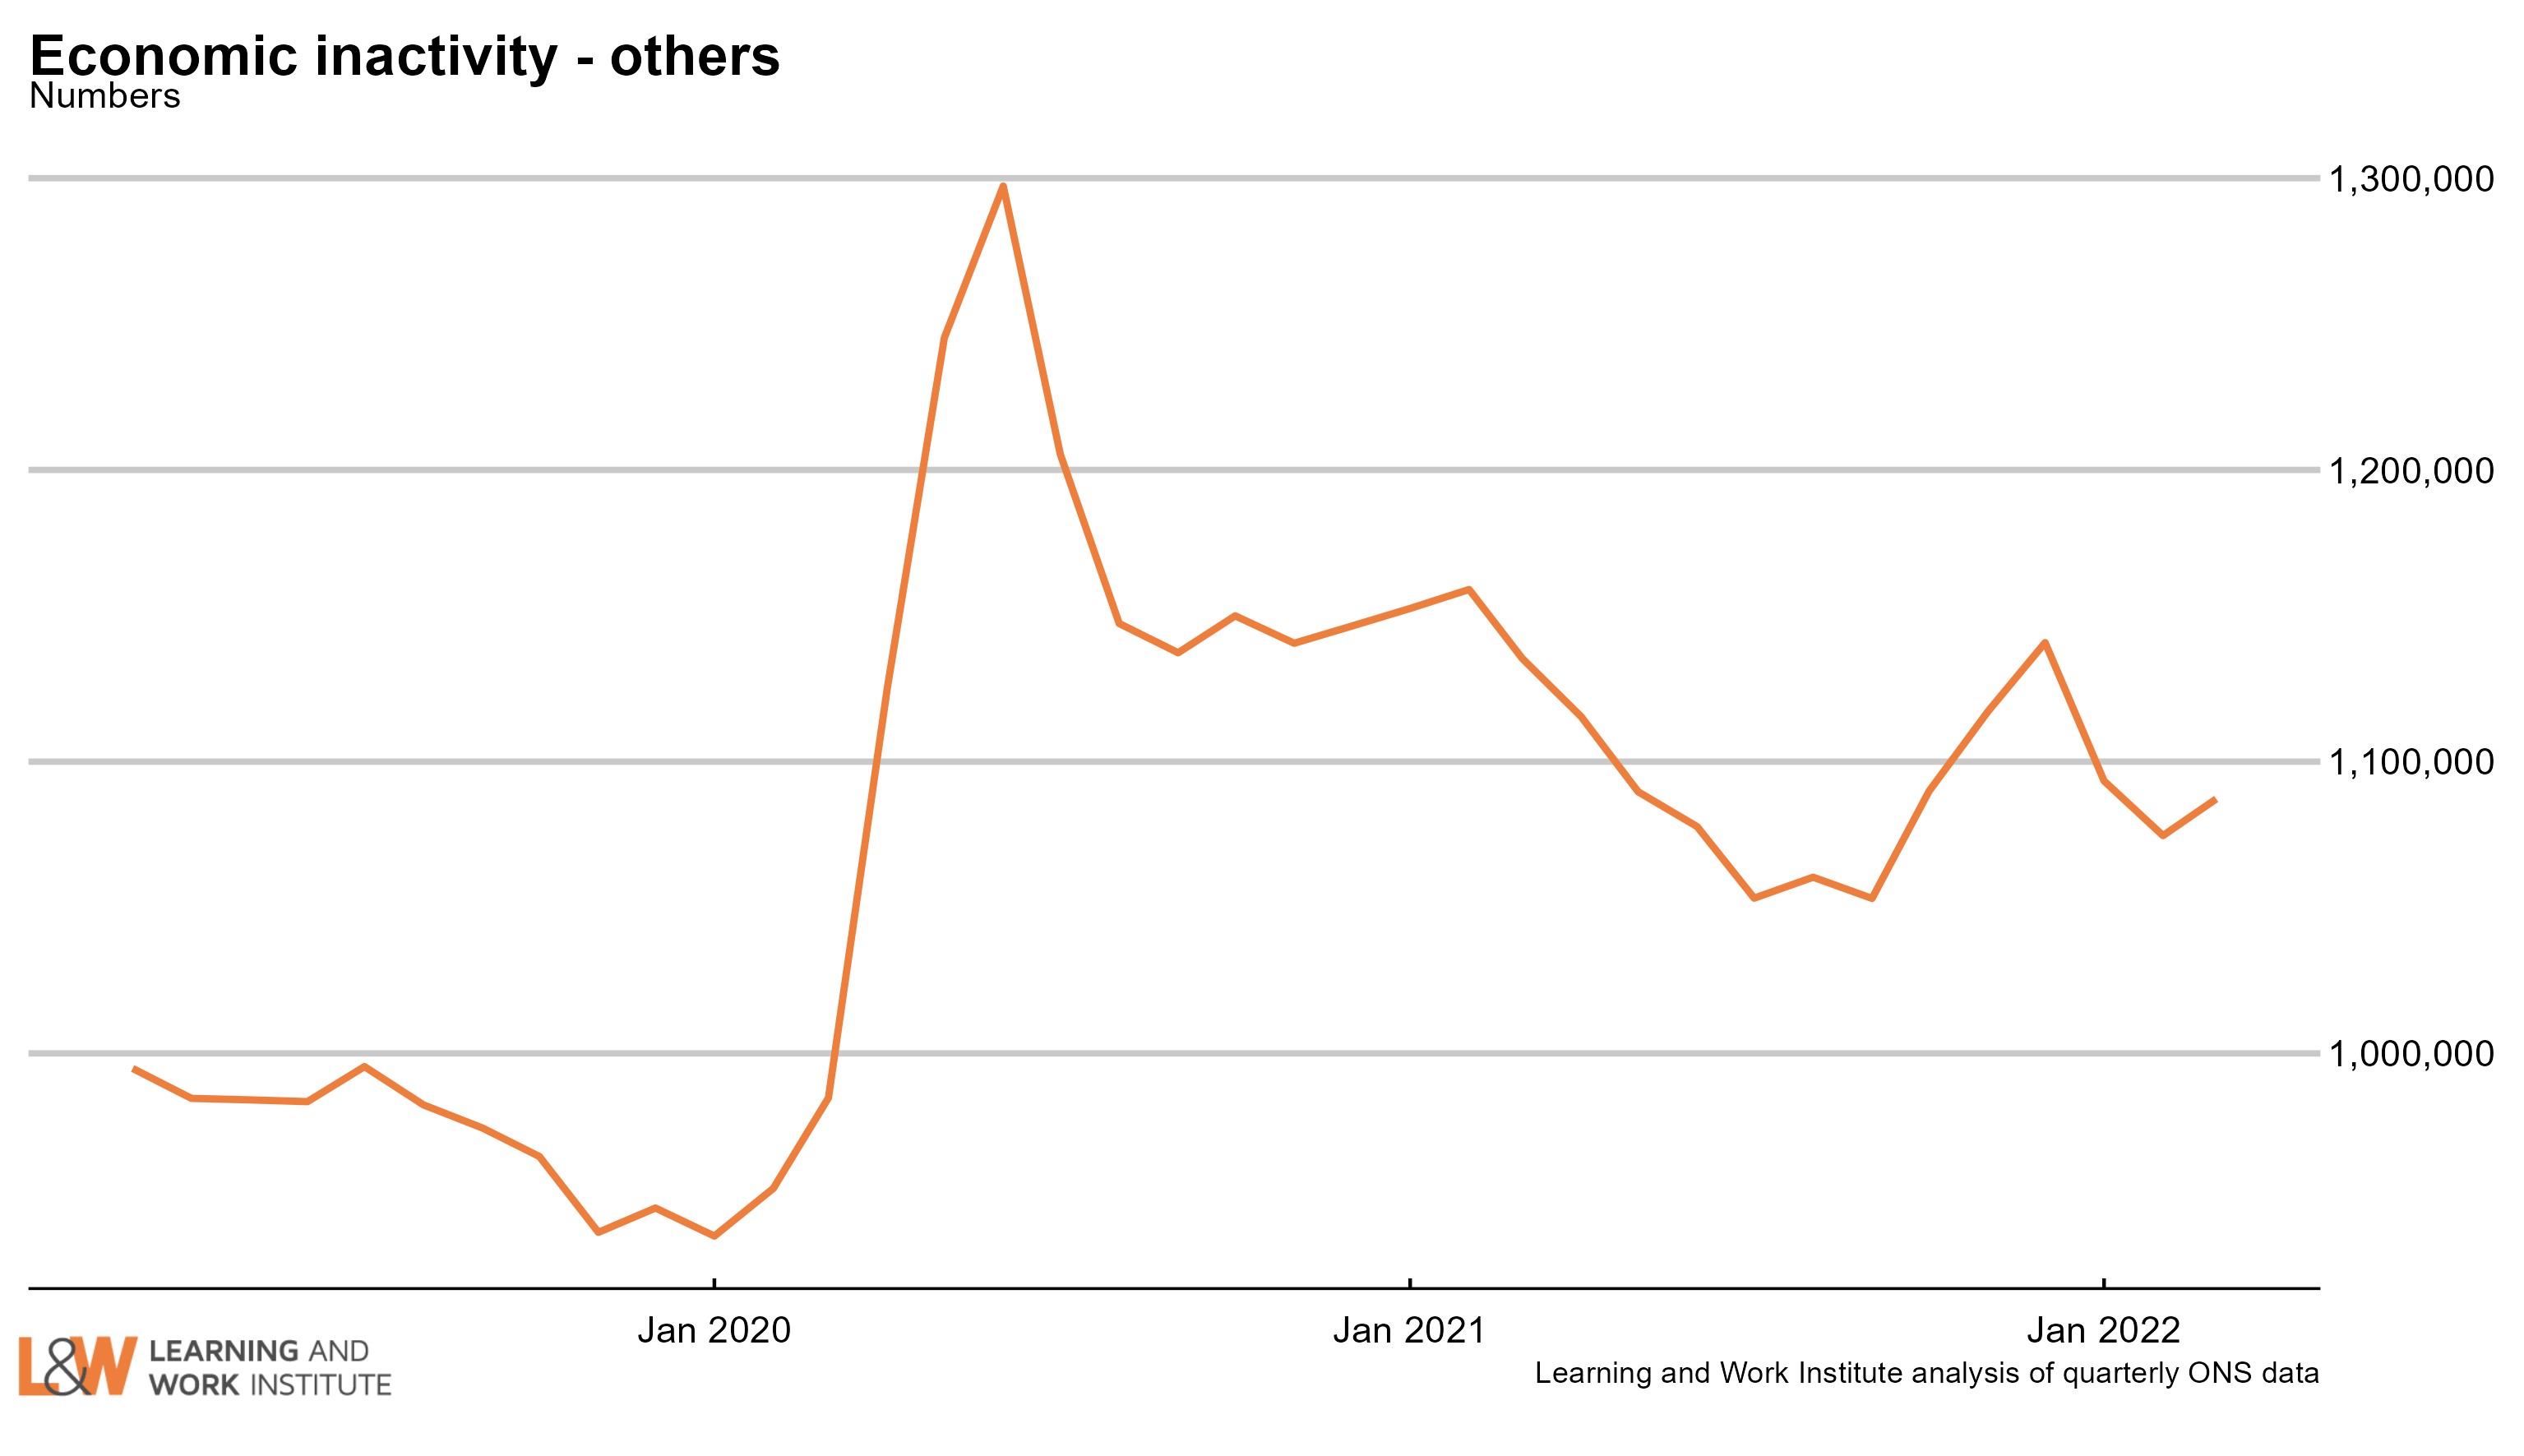 |
|
| Chart 18: Employment rate two-year change in regions – January to March 2022 Four regions showed a rise in the employment rate, compared with two years ago: the West Midlands, Scotland, London and Northern Ireland. The employment rate fell in eight regions, led by Wales and the North West. 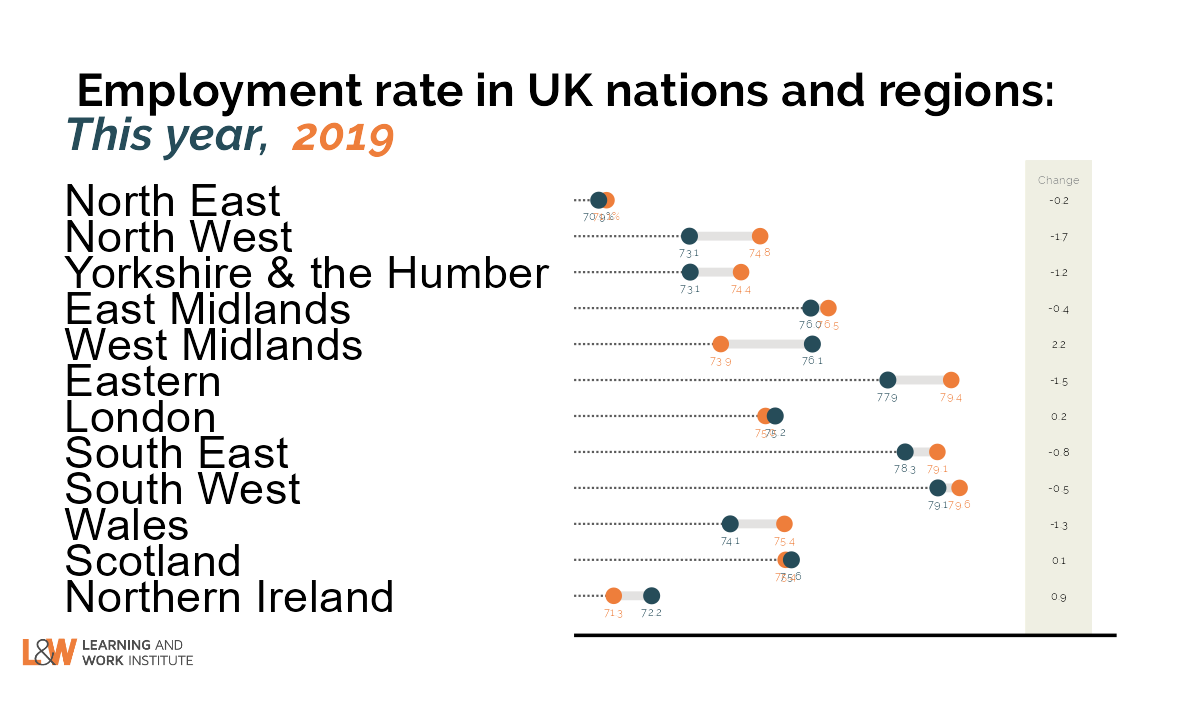 |
|
| Chart 19: Unemployment rate two-year change in regions – January to March 2022 Five regions which showed a rise in the unemployment rate, compared to two years ago, led by the North West and the South West. The unemployment rate fell in seven regions, led by the East Midlands and Wales. 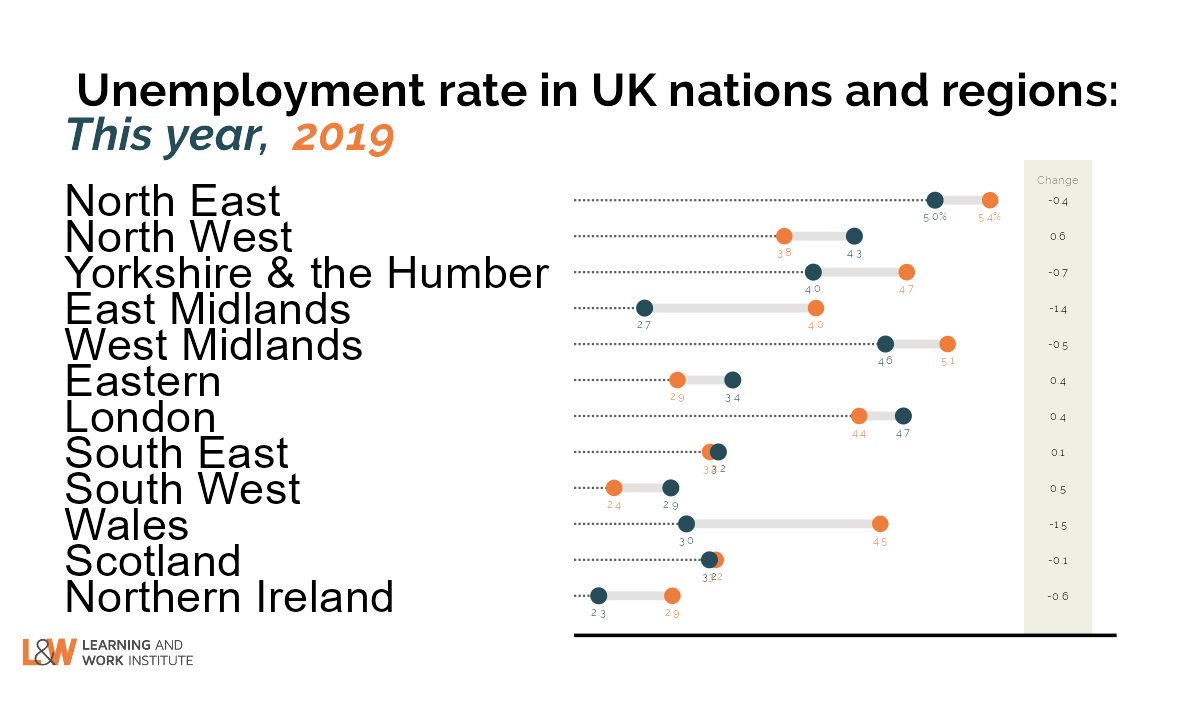 |
|
| Chart 20: Inactivity rate two-year change in regions – January to March 2022 Eight regions showed a rise in the inactivity rate, compared with two years ago, led by Wales and Yorkshire and the Humber. The inactivity rate fell in four regions, led by the West Midlands and London. 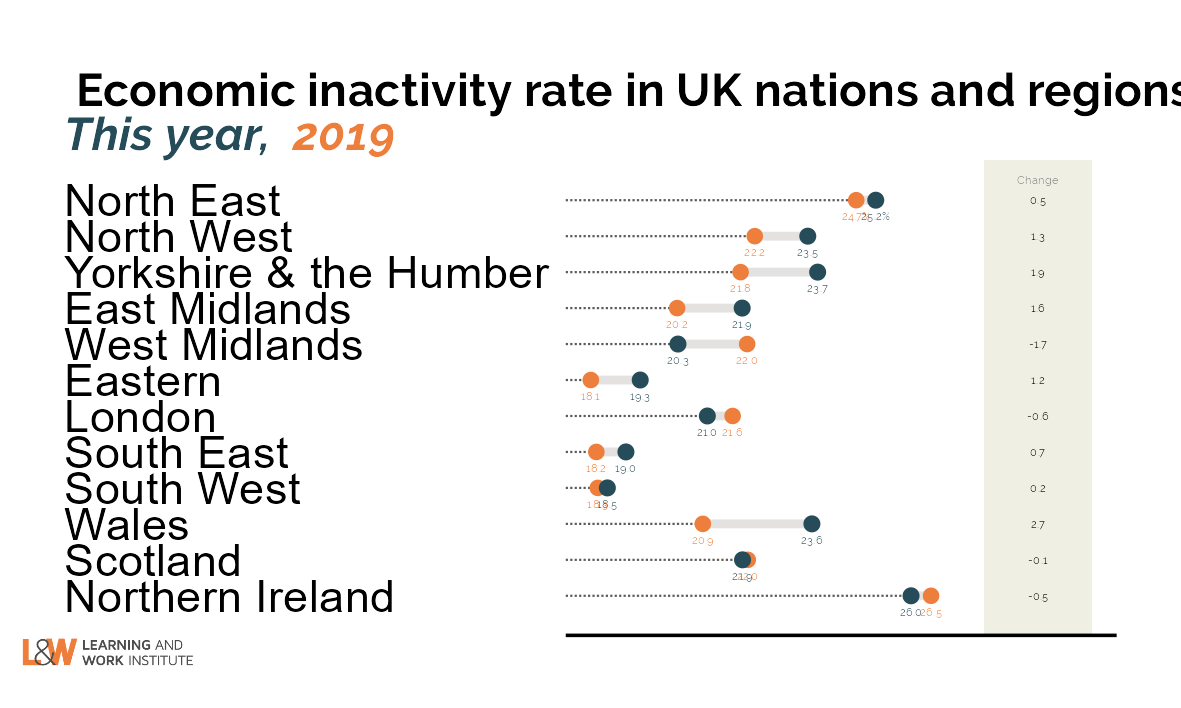 |
|
|
This newsletter is produced by Learning and Work Institute and keeps readers up to date on a wide range of learning and work issues. |
|
 |
|