 |
|
Making learning and work count
Labour market LIVE from Learning and Work Institute
16 November 2021
- Unemployment is 1,448,000, down by 62,000 from last month’s published figure (quarterly headline is down by 152,000). The unemployment rate is 4.3%, down by 0.2 percentage points on last month and has fallen by 0.5 percentage points on last quarter.
- The ONS figure for claimant unemployed is 2,063,100, down by 14,900 on last month, and the claimant rate is 5.1%.
- The number of workless young people (not in employment, full-time education or training) is 881,000, up by 27,000 on the quarter, representing 13.0% of the youth population and has risen by 0.4 percentage points.
- Youth unemployment (including students) is 475,000, down by 54,000 on the quarter.
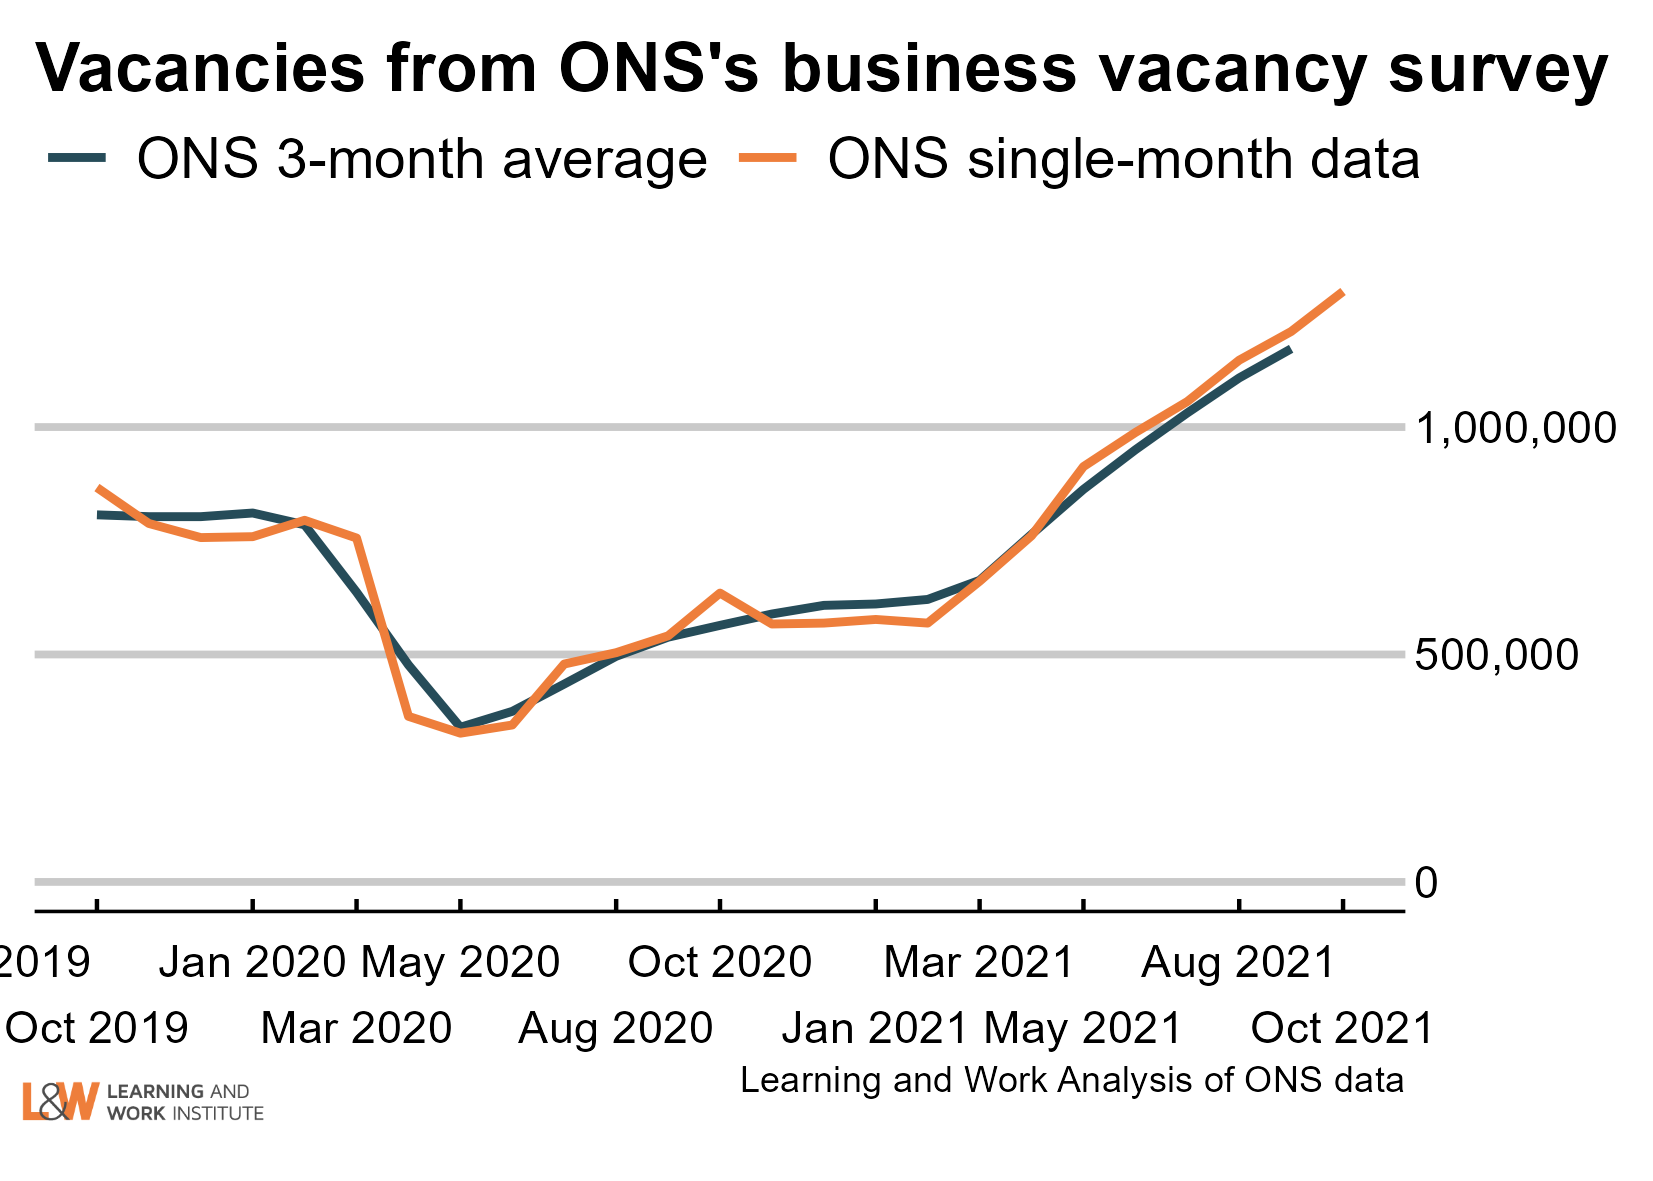
- Vacancies in Aug-Oct 2021 rose 64,000 (in the ONS official series) to 1,172,000 after recovering strongly from the low point of 340,000 in April to June 2020. Single-month estimates for October rose to 1,298,000.
- There are now 1.3 unemployed people per vacancy.
- The employment rate is 75.4% and (has risen by 0.1 percentage points on last month’s published figure and rose by 0.4 percentage points in the preferred quarterly measure).
Learning and Work Institute comment
The labour market figures published on 16 November indicate a continuing strong improvement in the labour market. Today's numbers largely relate to periods before the Coronavirus Job Retention Scheme finished at the end of September.
Duncan Melville, Chief Economist at Learning and Work Institute, commented:
‘The labour market continues to recover from the impacts of the pandemic, which is easing but is not yet over. Today’s headline Labour Force Survey (LFS) numbers show an increase in employment of 247,000 in the three months to July to September 2021 - a very large quarterly increase by historic standards. The timelier HMRC employee payroll numbers show an increase of 160,000 in the month to October, the first month since
the Coronavirus Job Retention Scheme finished. This compares with an average monthly increase of just 31,000 in the five years prior to the pandemic.
There are good prospects for continuing employment growth. Vacancy levels have continued to grow strongly to close to 1.2 million in August to October. Data on job adverts from Adzuna and job postings from Indeed indicate that vacancy levels continued to increase into early November. In part these very high vacancy levels reflect employers’ difficulties in finding staff across a range of sectors and occupations. These labour shortages across a range of sectors and occupations are already thought to be a factor behind the lower than expected numbers for UK economic growth in July to September which the Office for National Statistics (ONS) released last week.
Given strongly rising employment it is not a surprise that unemployment has fallen substantially: down by 152,000. This quarterly fall in
unemployment was the largest in nearly seven and a half years. More worryingly, inactivity amongst people of working age rose very slightly in the quarter. Over the course of the pandemic rising worklessness has been reflected much more in higher inactivity than higher unemployment.
There are still close to 2.1 million people on the claimant count, more than 800,000 above pre-pandemic levels and around 600,000 above the official LFS measure of unemployment, having been below this measure pre-pandemic. This may indicate that substantial numbers of people are receiving unemployment-related benefits, but who are not either looking for work or available to start work. This raises concerns about the effectiveness with which employment support is assisting people to enter work.
Most of the data released today pertain to dates prior to end of the Coronavirus Job Retention Scheme (CJRS) at the end of September. There were around 1.1m people who were
still furloughed when the CJRS ended. The questions are how many of these people have returned to work in their existing jobs from which they were furloughed, how many have found new jobs, how many have become unemployed, and how many have left the labour market (economic inactivity). The ONS’ Business Insights and Conditions Survey (BICS) found that in late October 2021, 87 percent of formerly furloughed employees had returned to work. Similarly, a survey by the Resolution Foundation suggested that 88 percent of employees who were furloughed in September were working October, with 3.4 percent unemployed and 8.5 per cent having left the labour market and become economically inactive. Applying these percentages to the 1.1 million who were furloughed at the end of September would translate into a rise in unemployment of around just 39,000, alongside a rather larger increase in inactivity of 97,000 in the first half of October. Generally, the rise in worklessness
since the start of the pandemic has been reflected more in increased inactivity (up 364,000) than higher unemployment (up 84,000).
This also suggests that around one million formerly furloughed workers were in employment in the first half of October. The number of employees who left payrolls in October (offset by large inflows onto payrolls) was about 100,000 higher than the figures seen in recent months which suggests that some formerly furloughed workers did not reattach to their ‘old’ jobs but instead moved into new jobs in October.
The available numbers for October also suggest that the end of the CJRS did not see a substantial negative impact on the labour market. The claimant count continued to fall, albeit by less than has been seen in recent months, and the HMRC numbers for payrolled employees rose by 160,000 - a similar increase to those seen in previous months. Thus, these numbers show little sign of a significant adverse impact from
the ending of the CJRS.
Even so there are many people out of work who could and would like to work. Given what has happened to inactivity and unemployment since the start of the pandemic policy needs to focus more widely than just on unemployment, and must also address the rise in economic inactivity. Those who have left the labour market need support to encourage them to return to looking for work through policies which are effective at helping people into work. ’
Paul Bivand, Associate Director for Statistics and Analysis at Learning and Work Institute, said:
"The claimant count remains well above the official survey measure of unemployment, and fell less this month than in previous months. The figures include the first two weeks after the end of the furlough scheme. Separate figures from the Department for Work and Pensions show no increase in new Universal Credit claims in the two weeks after the end
of the furlough scheme. It remains possible that DWP had recorded claims from people who later received furlough, but then froze the claims. We will see later if benefit spending goes up as DWP pays people income rather than furlough."
Employment has risen by 247,000 between April to June 2021 and July to September 2021. In the last 12 months employment is up by 173,000.
Unemployment is down by 152,000 between April to June 2021 and July to September 2021. and the unemployment rate reduced by 0.5 percentage points to 4.3% in the quarter.
Economic inactivity rose by 6,000 between April to June 2021 and July to September 2021. and the inactivity rate was stable at 21.1% in the quarter.
The national claimant count fell by 14,900.
Youth unemployment has fallen by 54,000. There are 475,000 unemployed young people, and 300,000 (4.4% of the youth population) who are unemployed and not in full-time education.
Self-employment is down by 751,000 since the pandemic started. The number of employees rose by 255,000 over the same period. Involuntary part-time employment is up by 113,00 since the pandemic started to 1.0 million, 12.6% of all part-time workers. Involuntary temporary employment is up 119,000 since the pandemic started to 29.9% of all temporary workers.
|
 |
Chart 1: UK unemployment (ILO)
The latest unemployment rate fell by 0.2 percentage points to 4.3% compared to last month's figures. The experimental weekly statistics show further falls, with the latest figure at 3.5%. 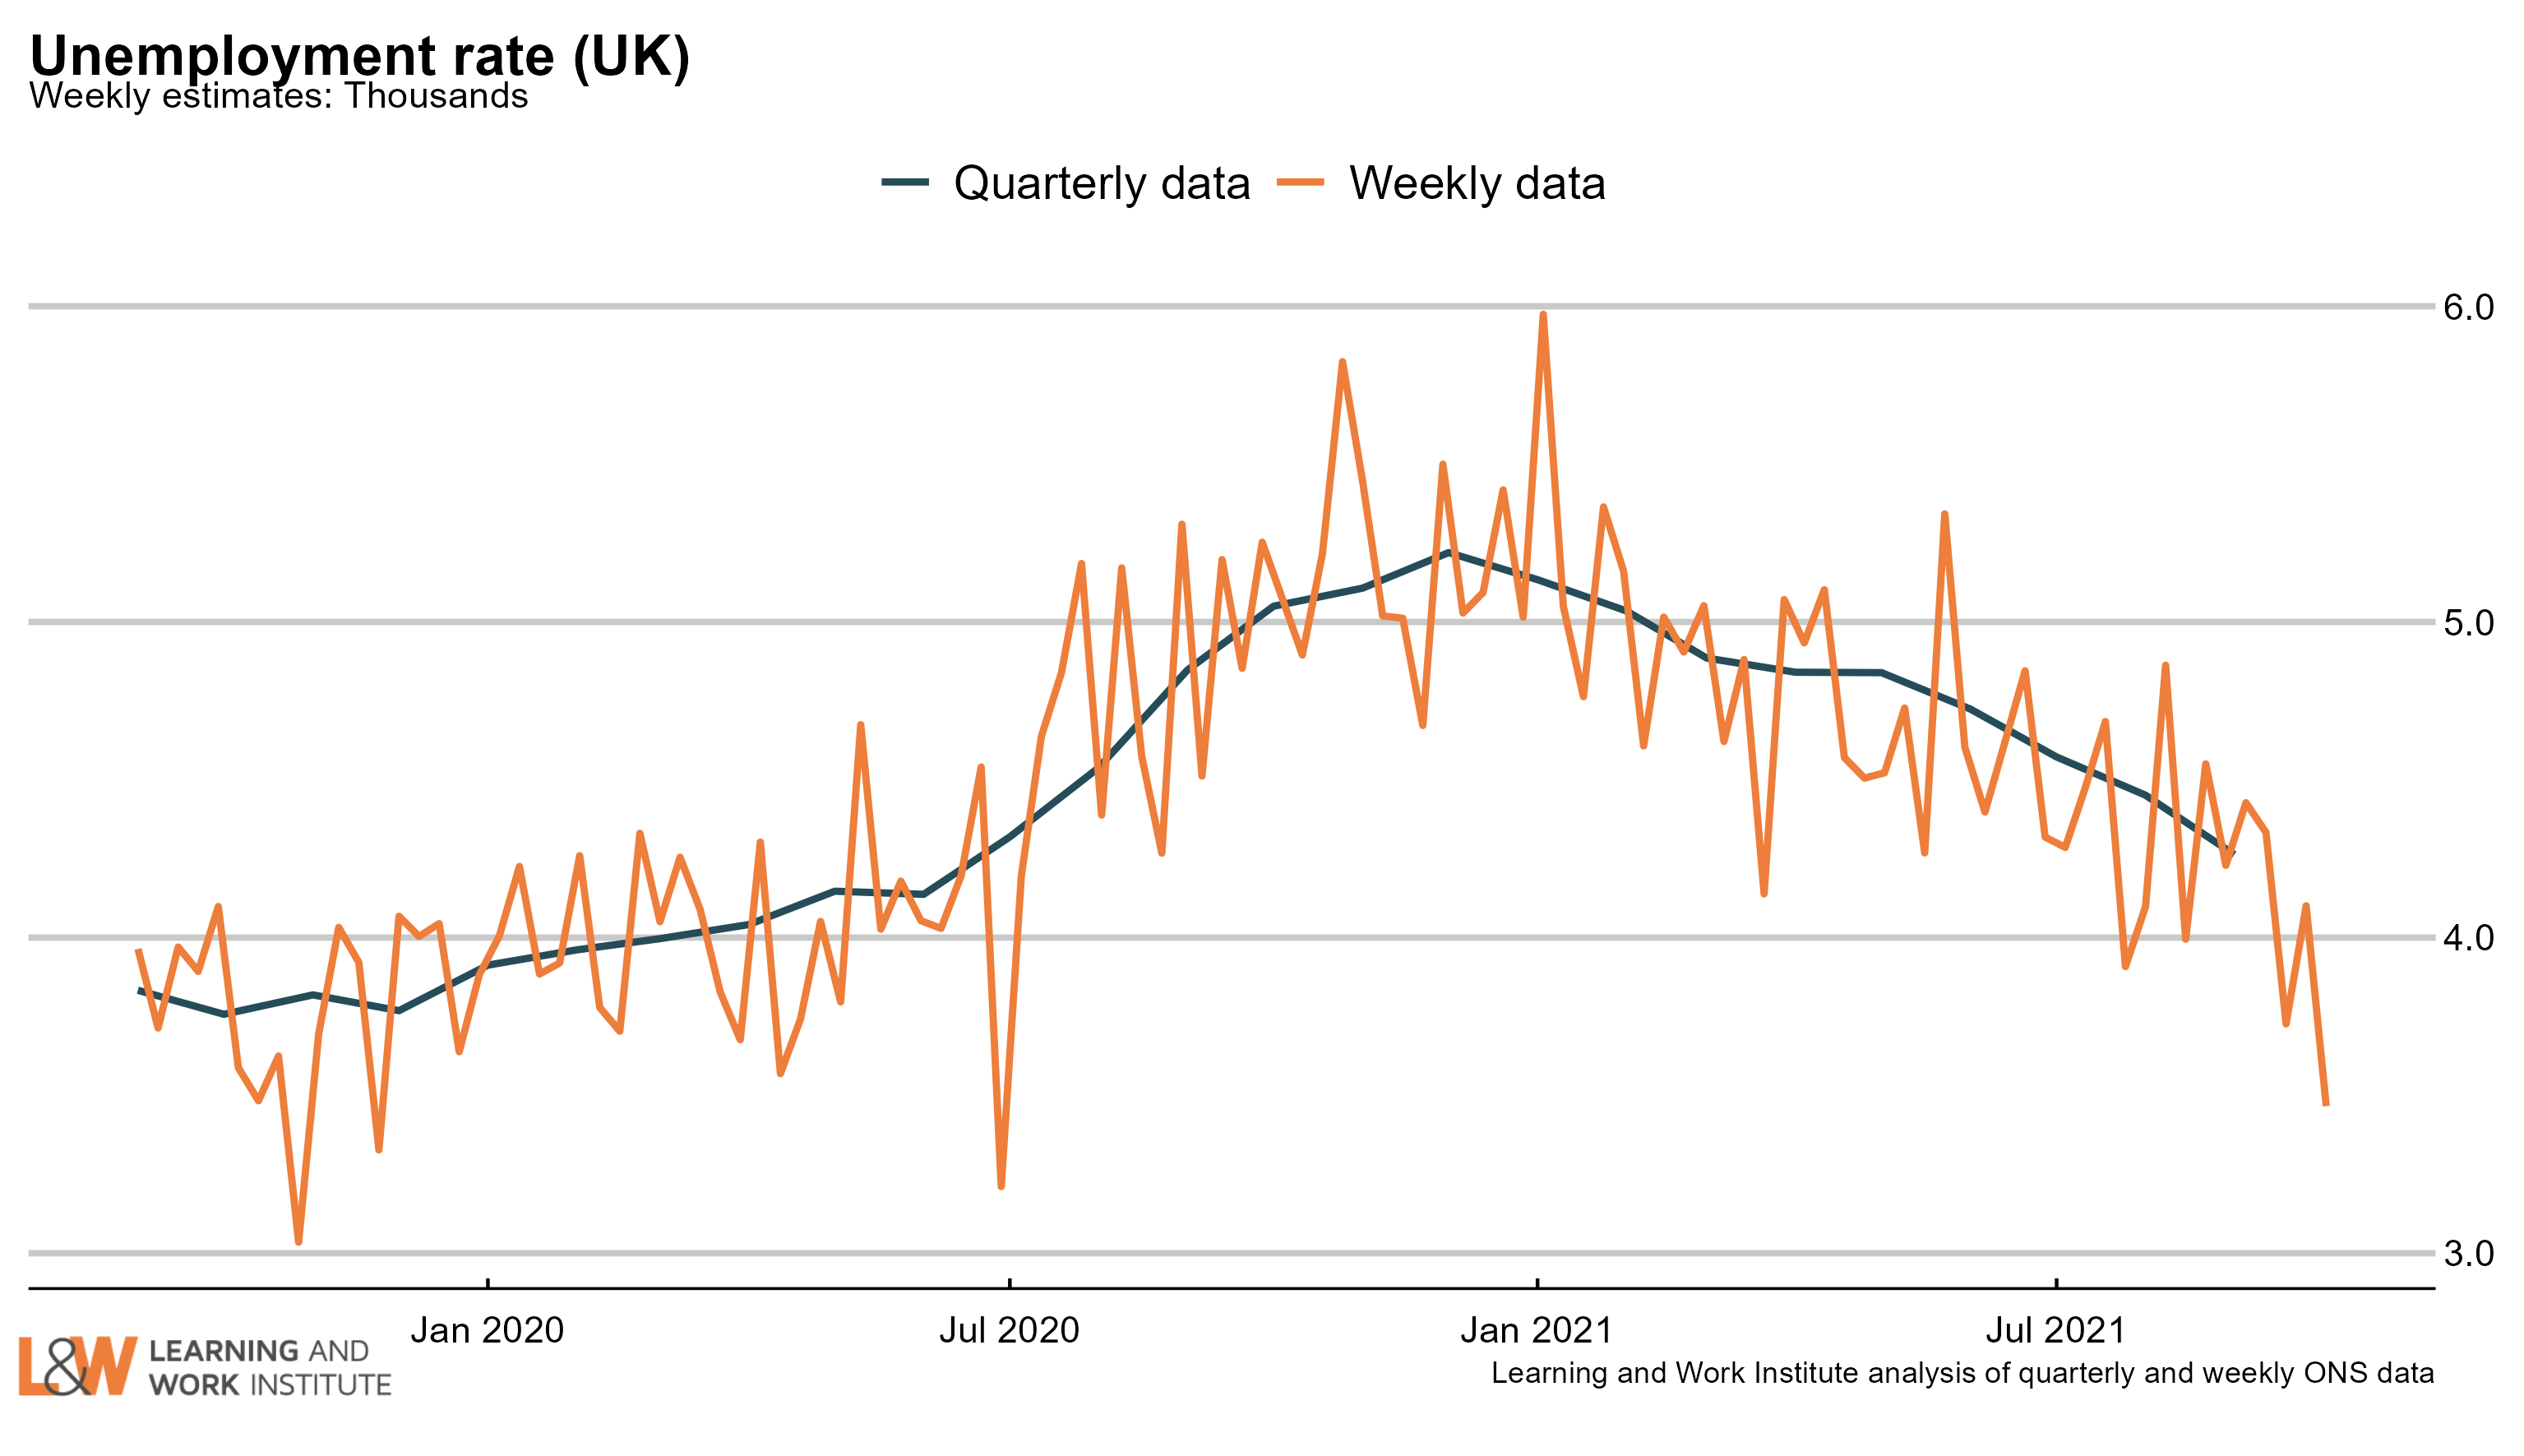 |
|
Chart 2: The claimant count and UK unemployment compared
The number of unemployed people who are claiming unemployment-related benefits is now 614,900 higher than the number of unemployed in the official measure. This difference is highly unusual - due to differences in defining unemployment the official measure is normally higher than the claimant measure. 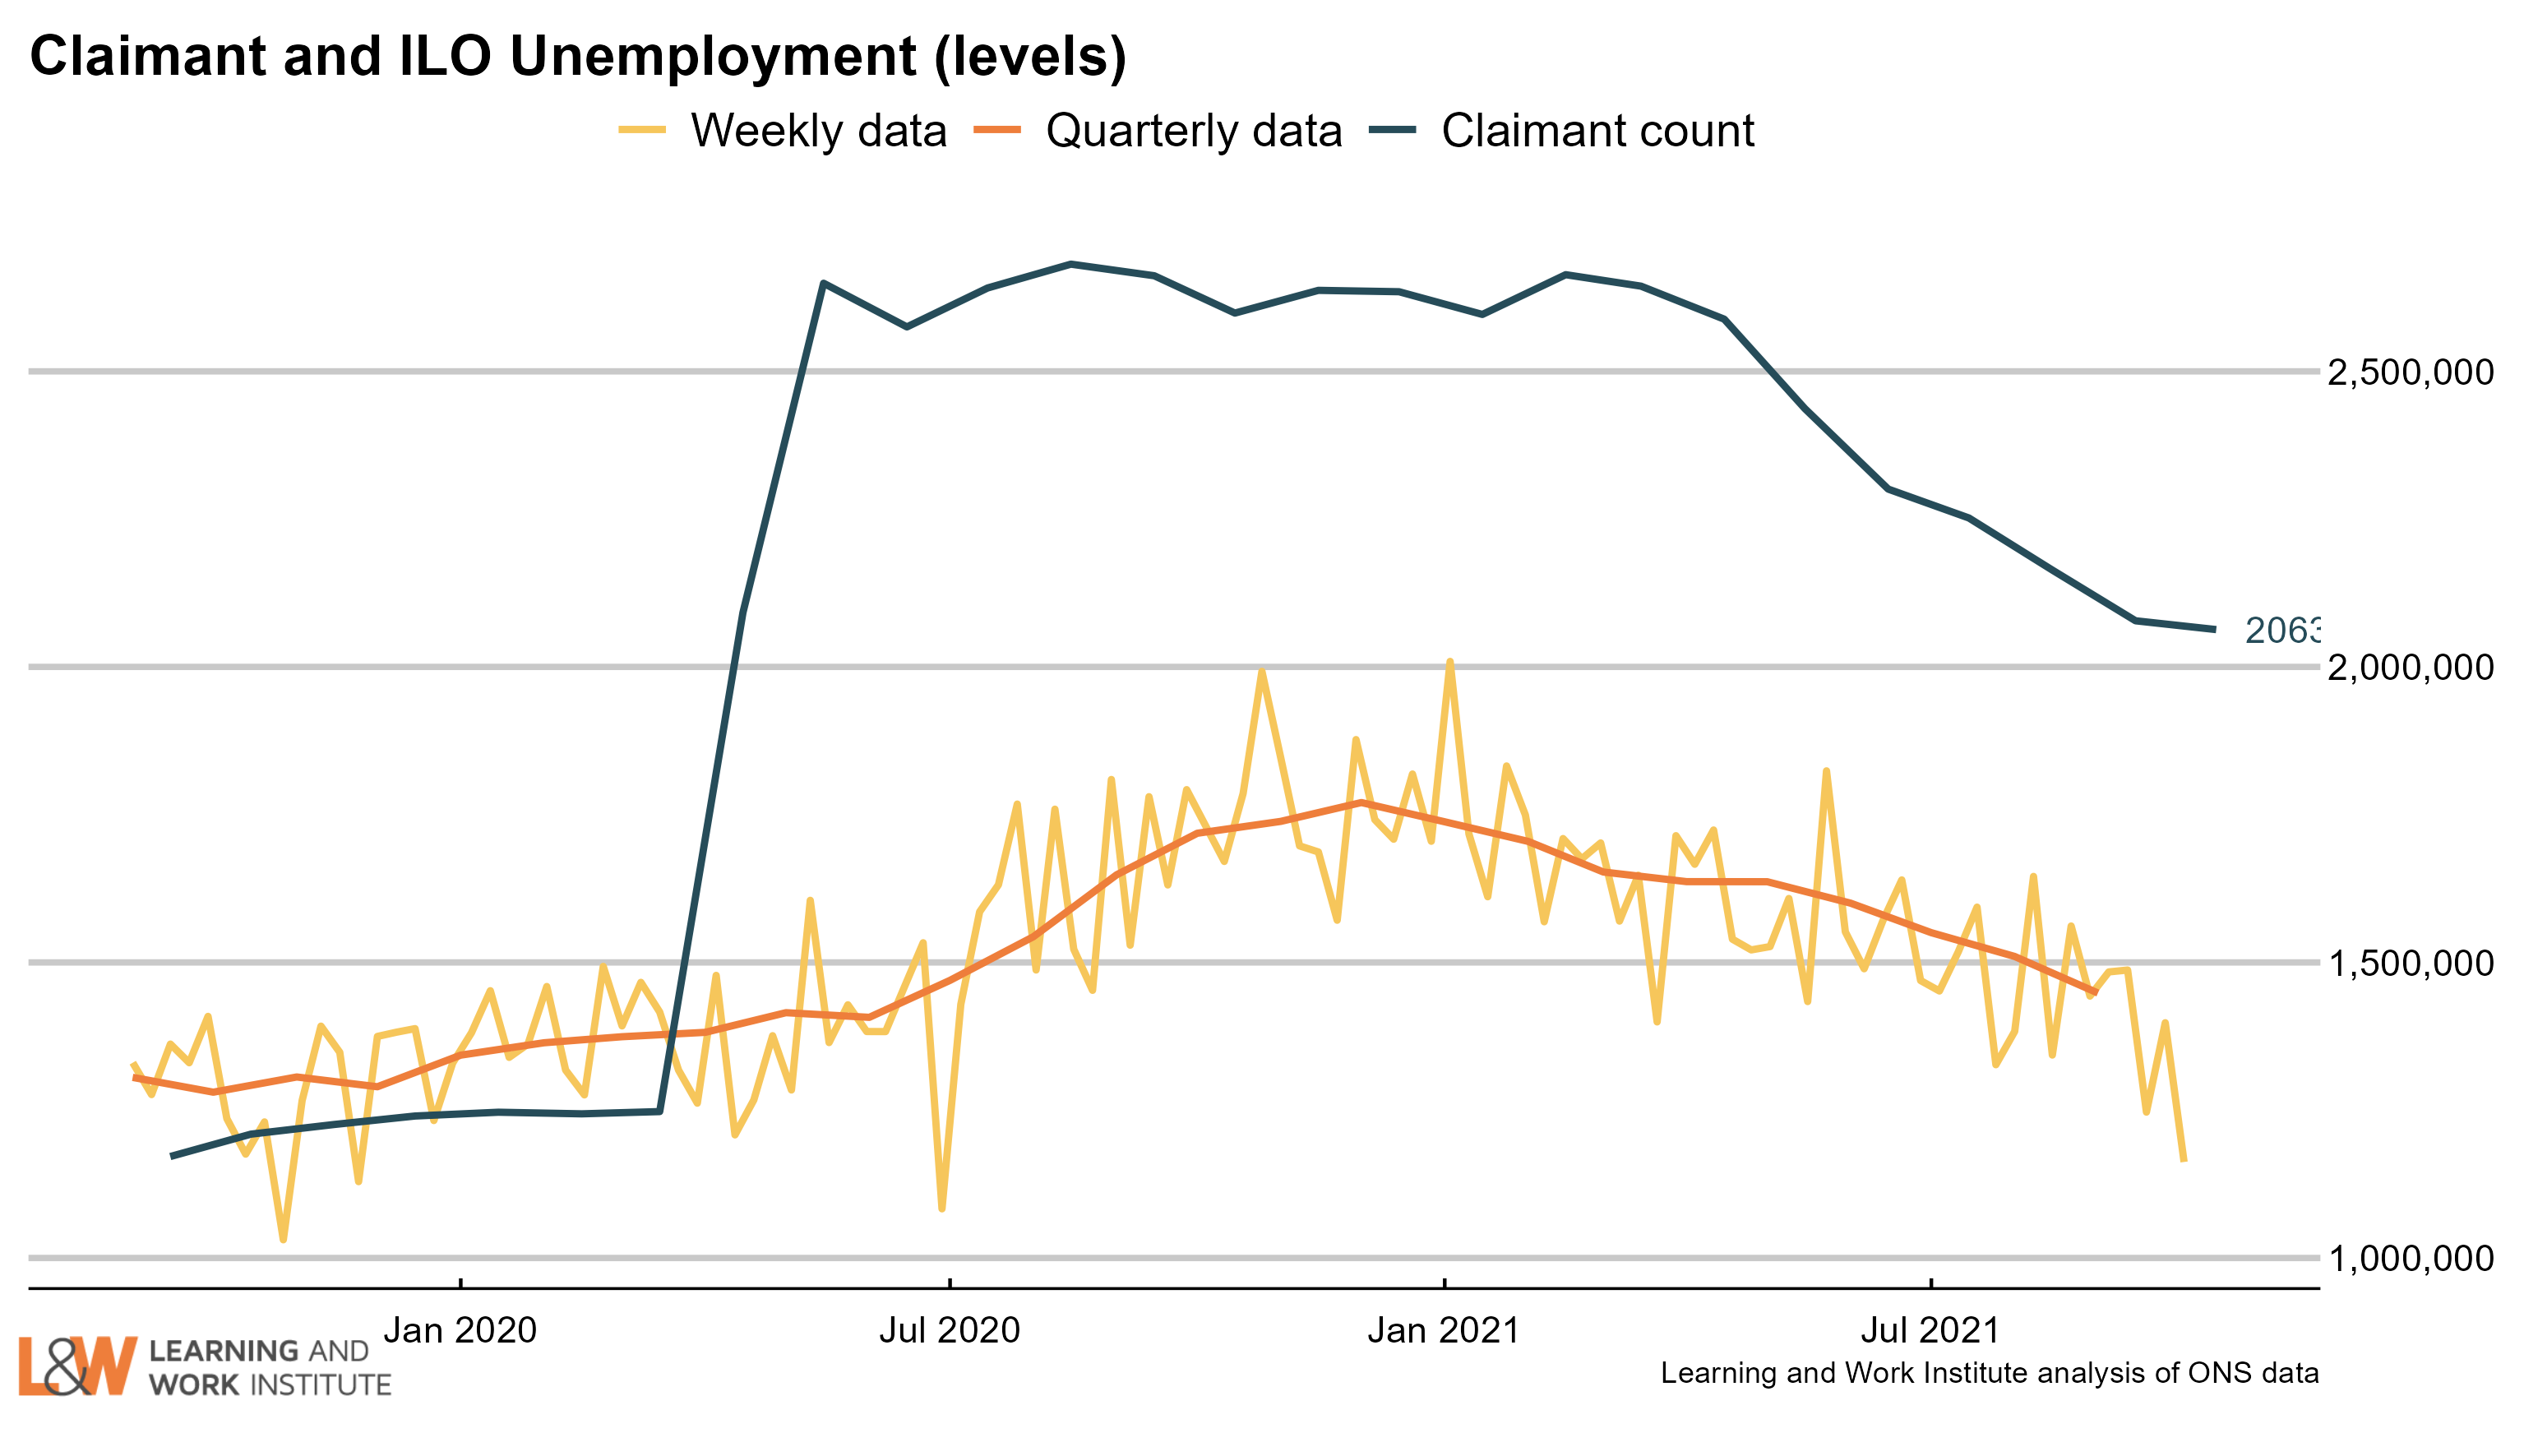 |
|
Chart 3: Youth unemployment
The number of unemployed young people fell by 23,000 since last month’s figures, to 475,000.
Meanwhile, the number of young Universal Credit or Jobseeker’s Allowance claimants is down 10,500 from last month, to 349,600. 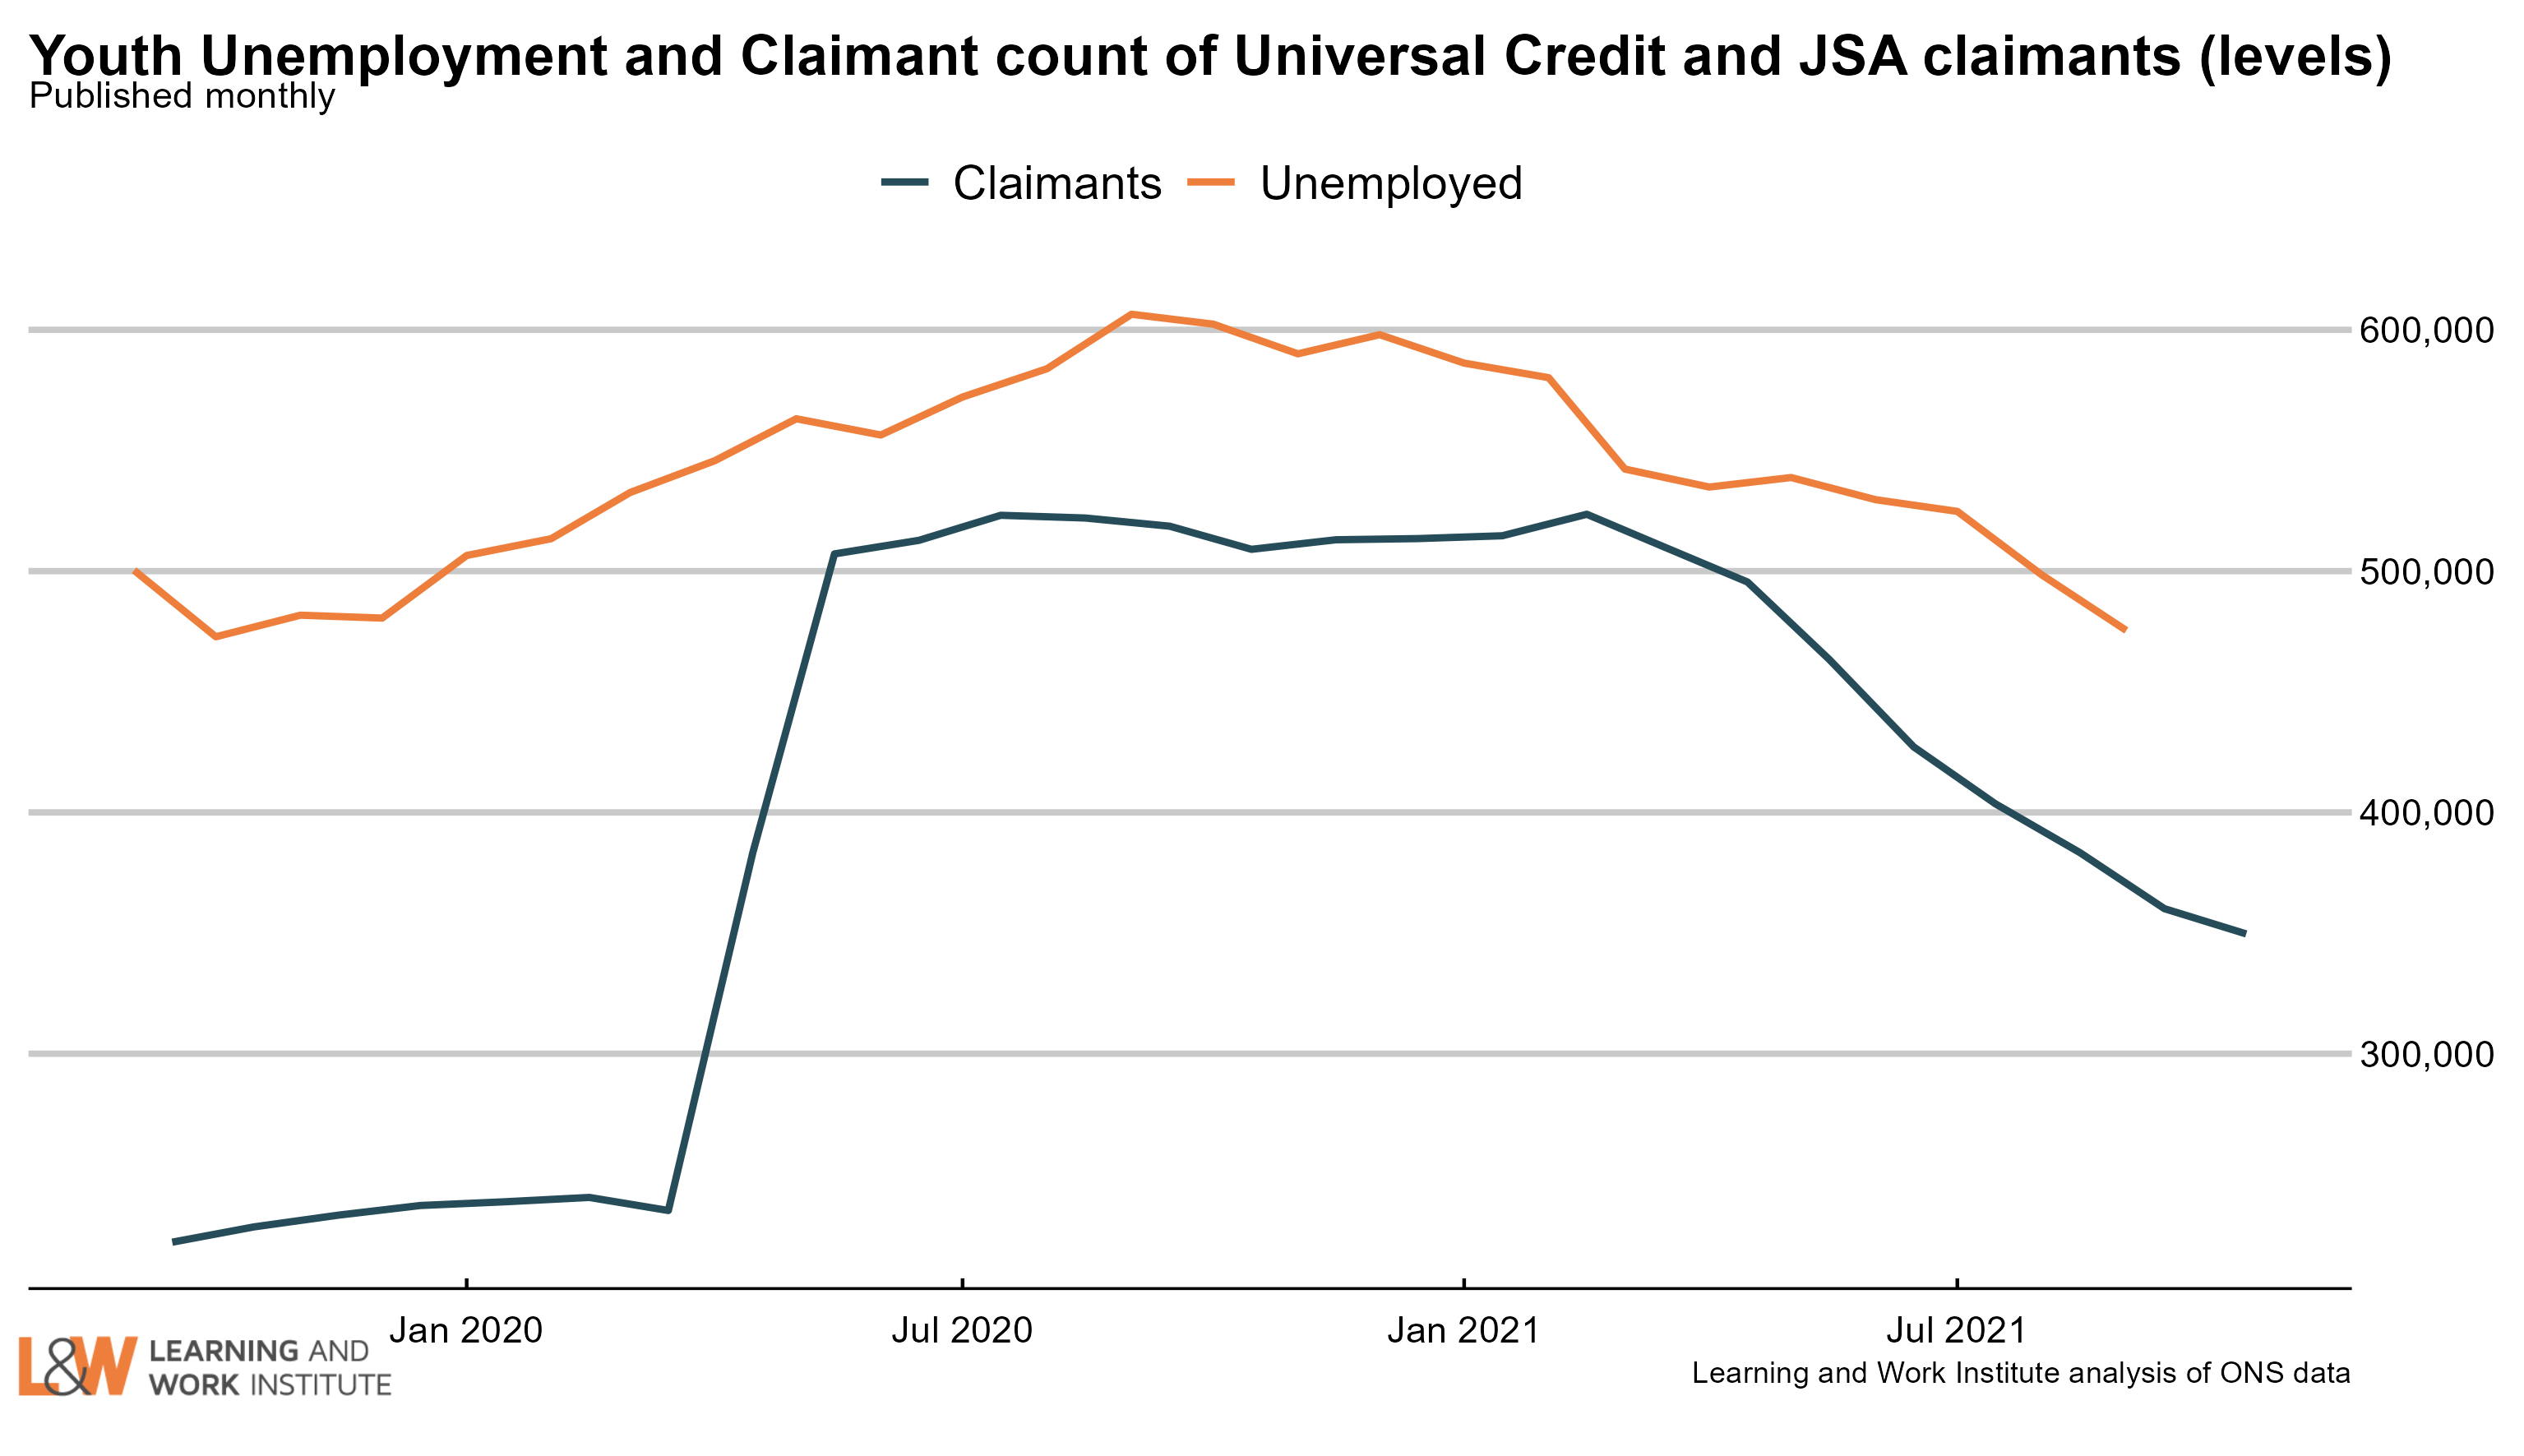 |
|
Chart 4: Young people not in employment, full-time education or training
The number of out of work young people who are not in full-time education (881,000) rose by 29,000 or 3.4% in the last quarter. The rise was among the inactive, with the number of unemployed young people not in full-time education or training falling. 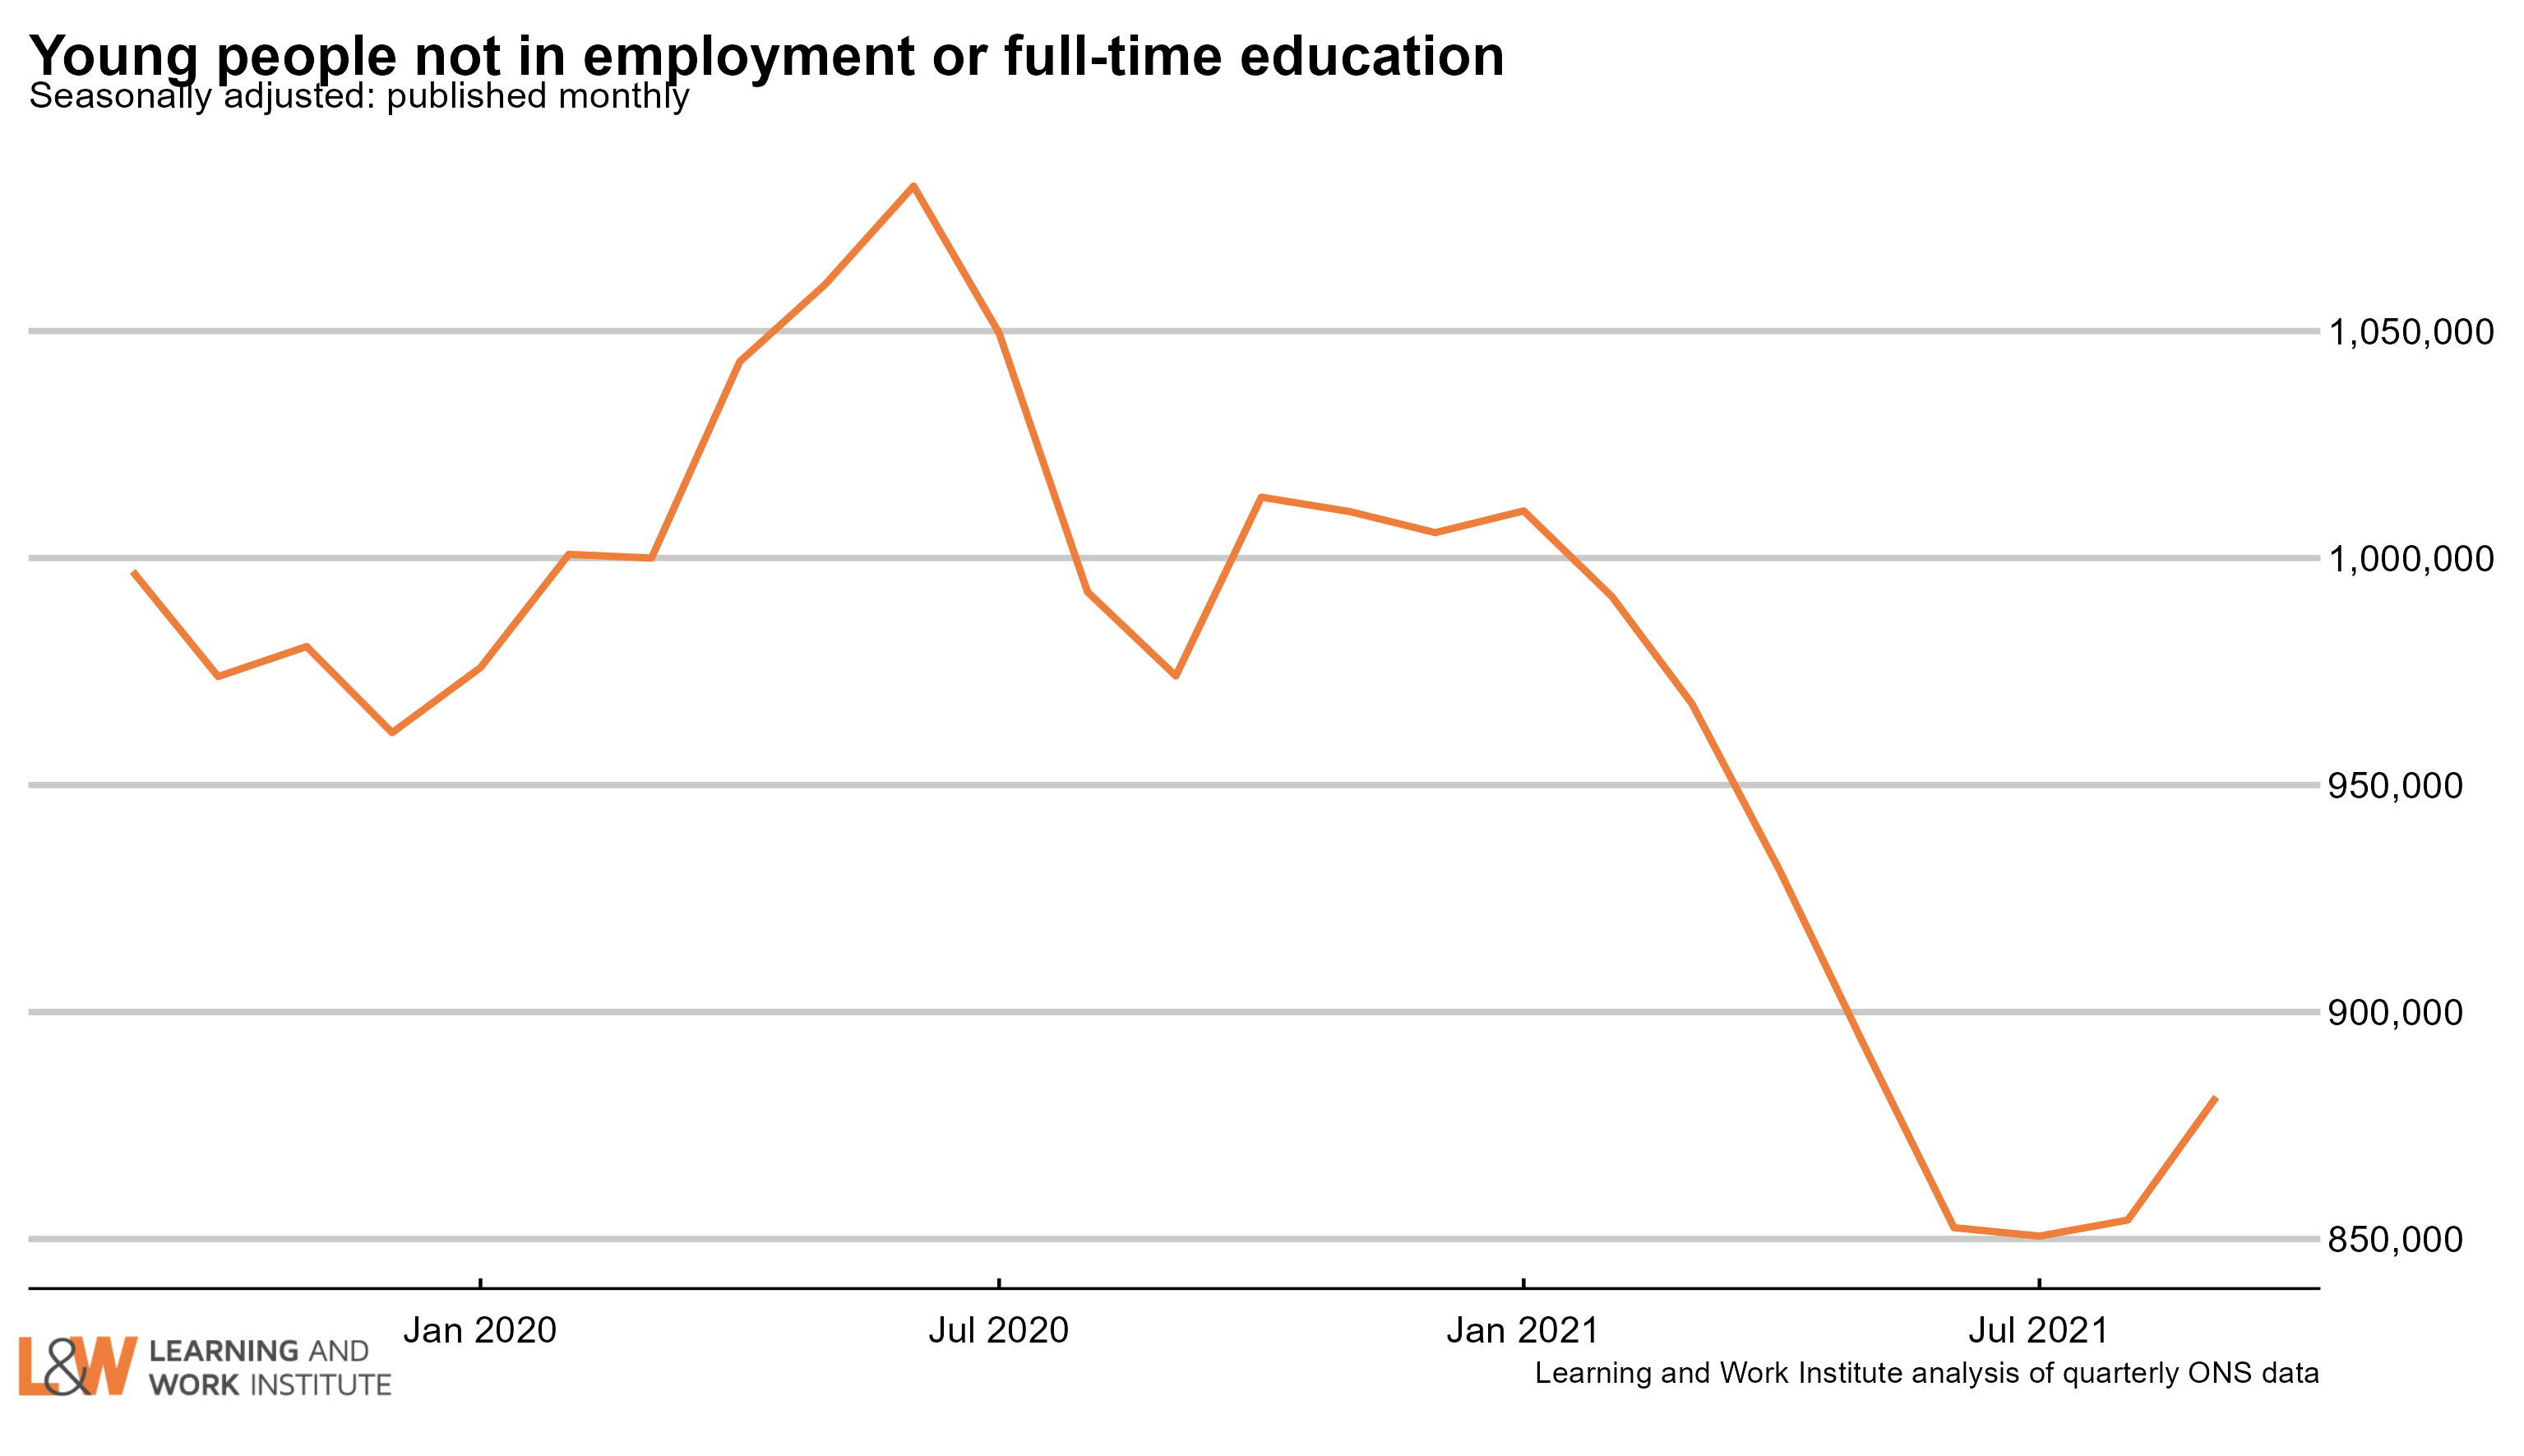 |
|
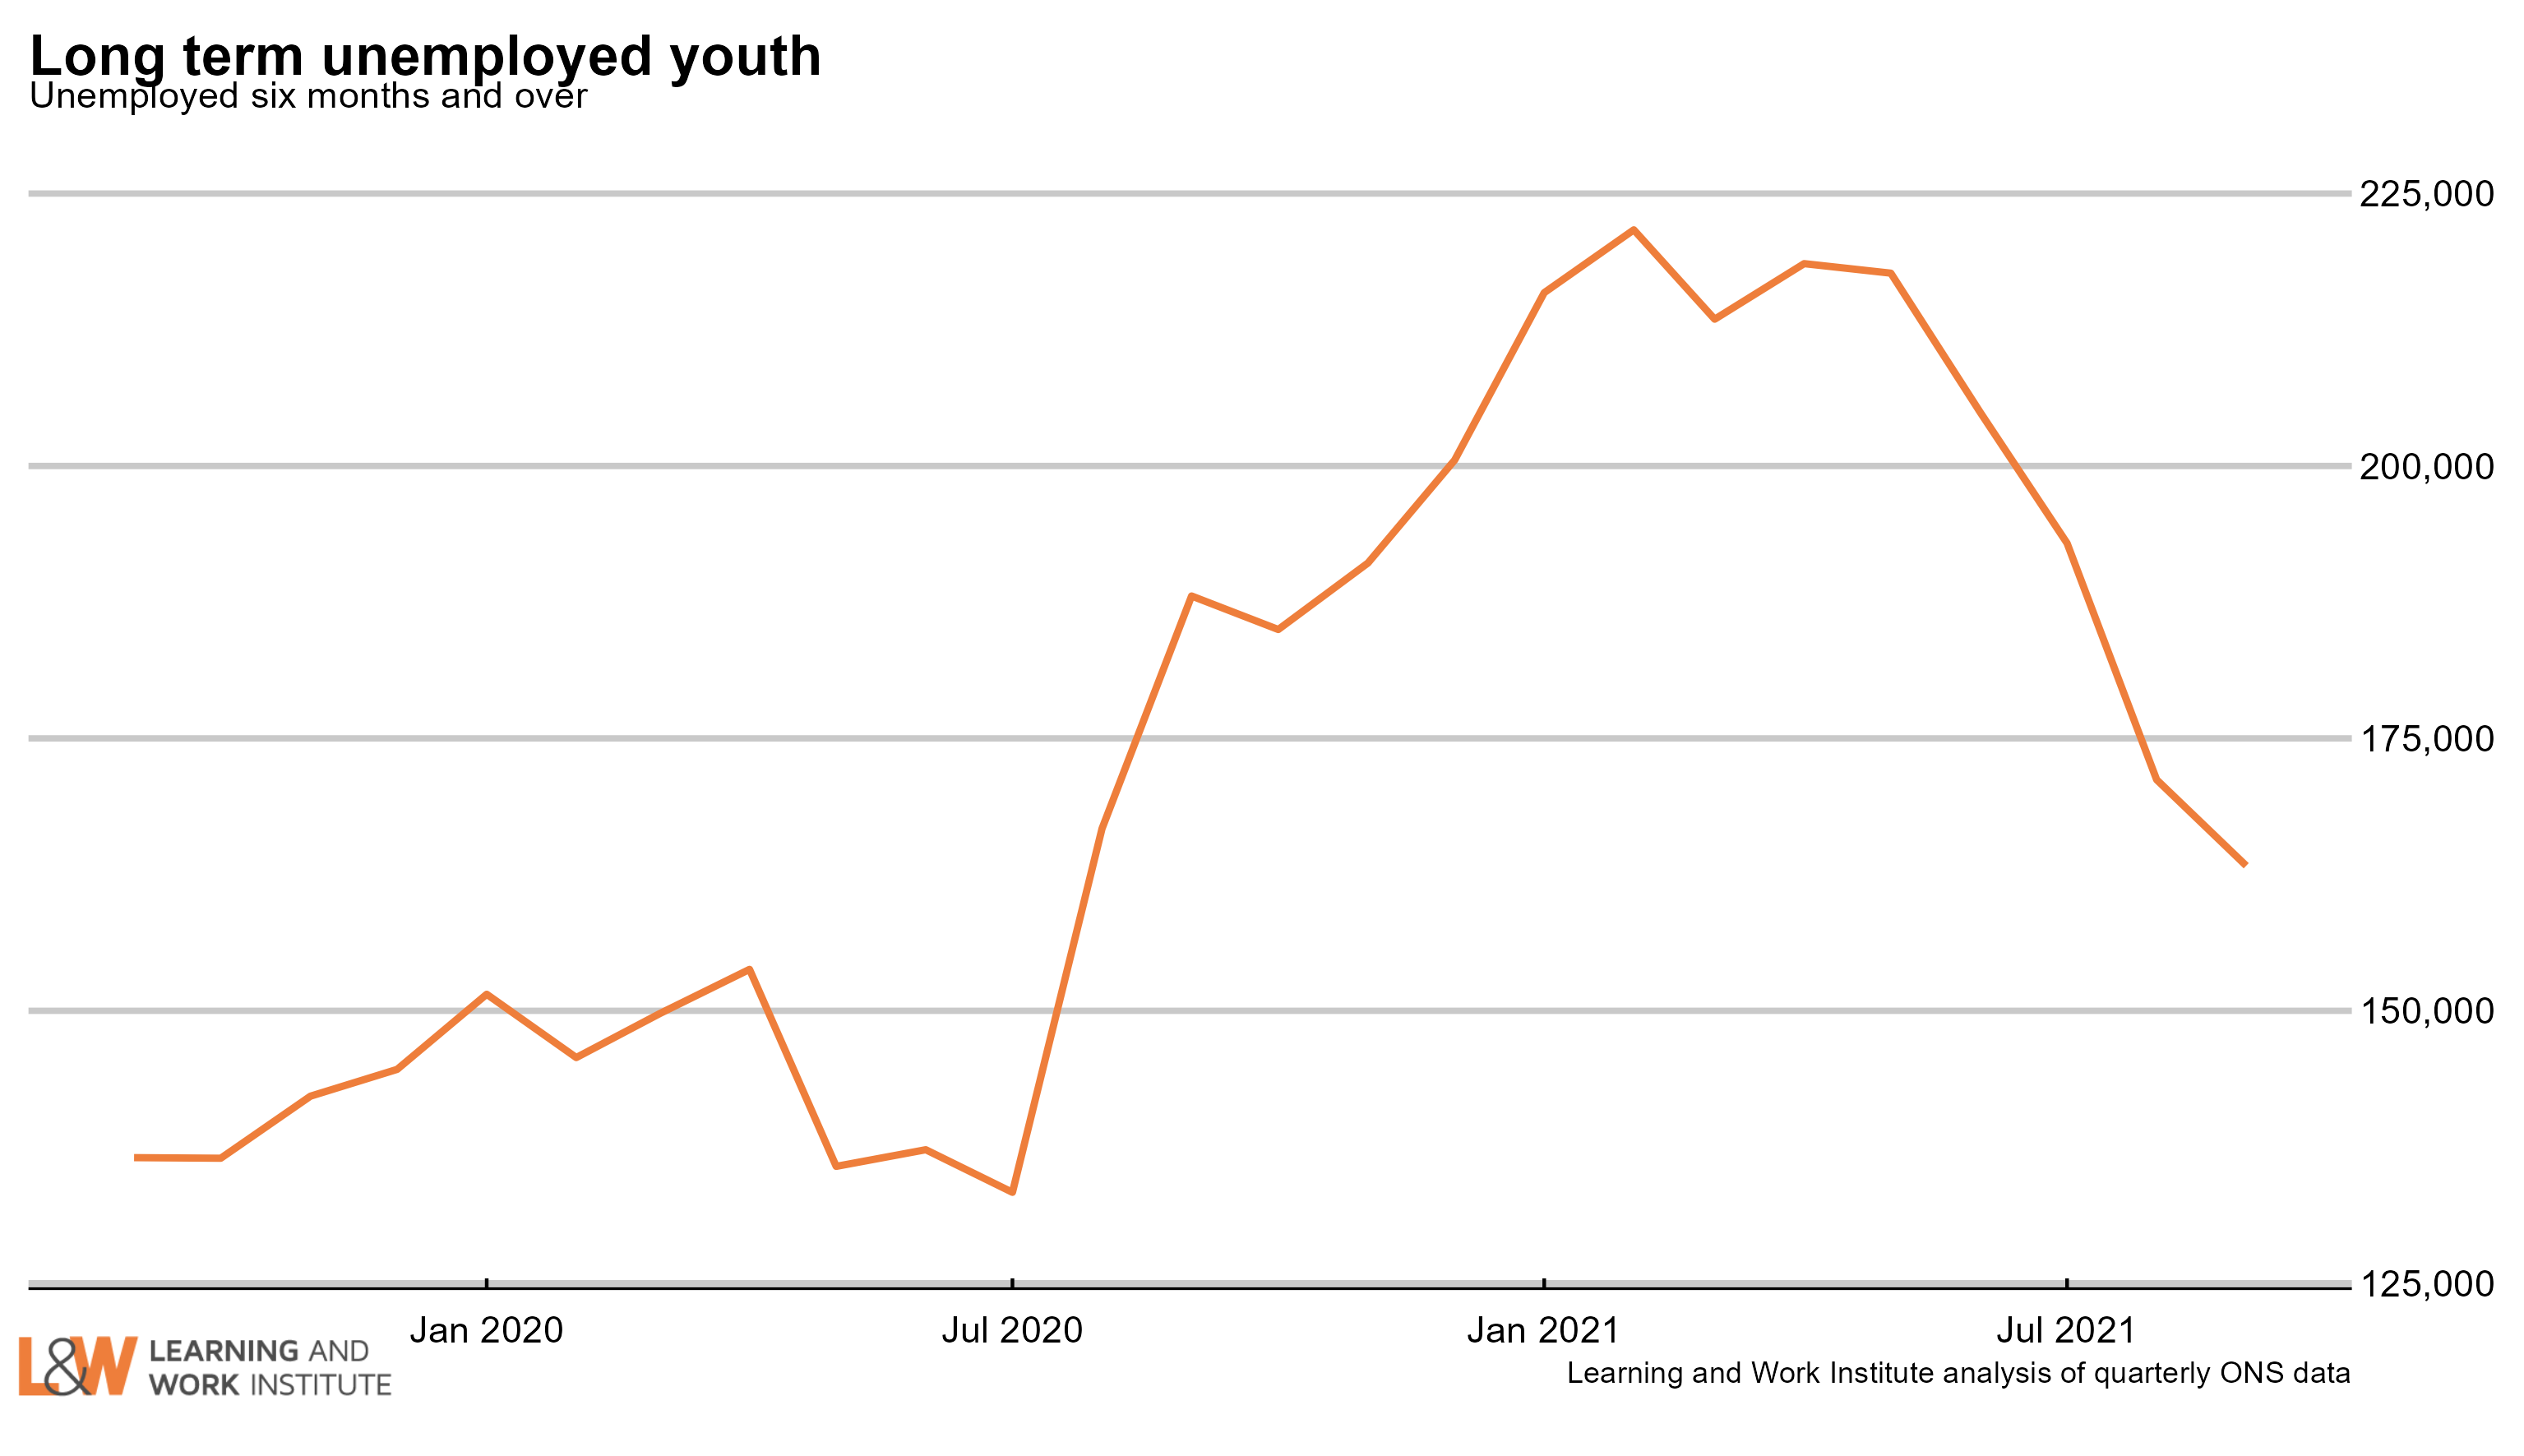
Chart 5: Youth long-term unemployment (six months and over, 16-24)
Youth long-term unemployment (which can include students) has fallen by 42,000 over the last quarter and is now 163,000.
 |
|
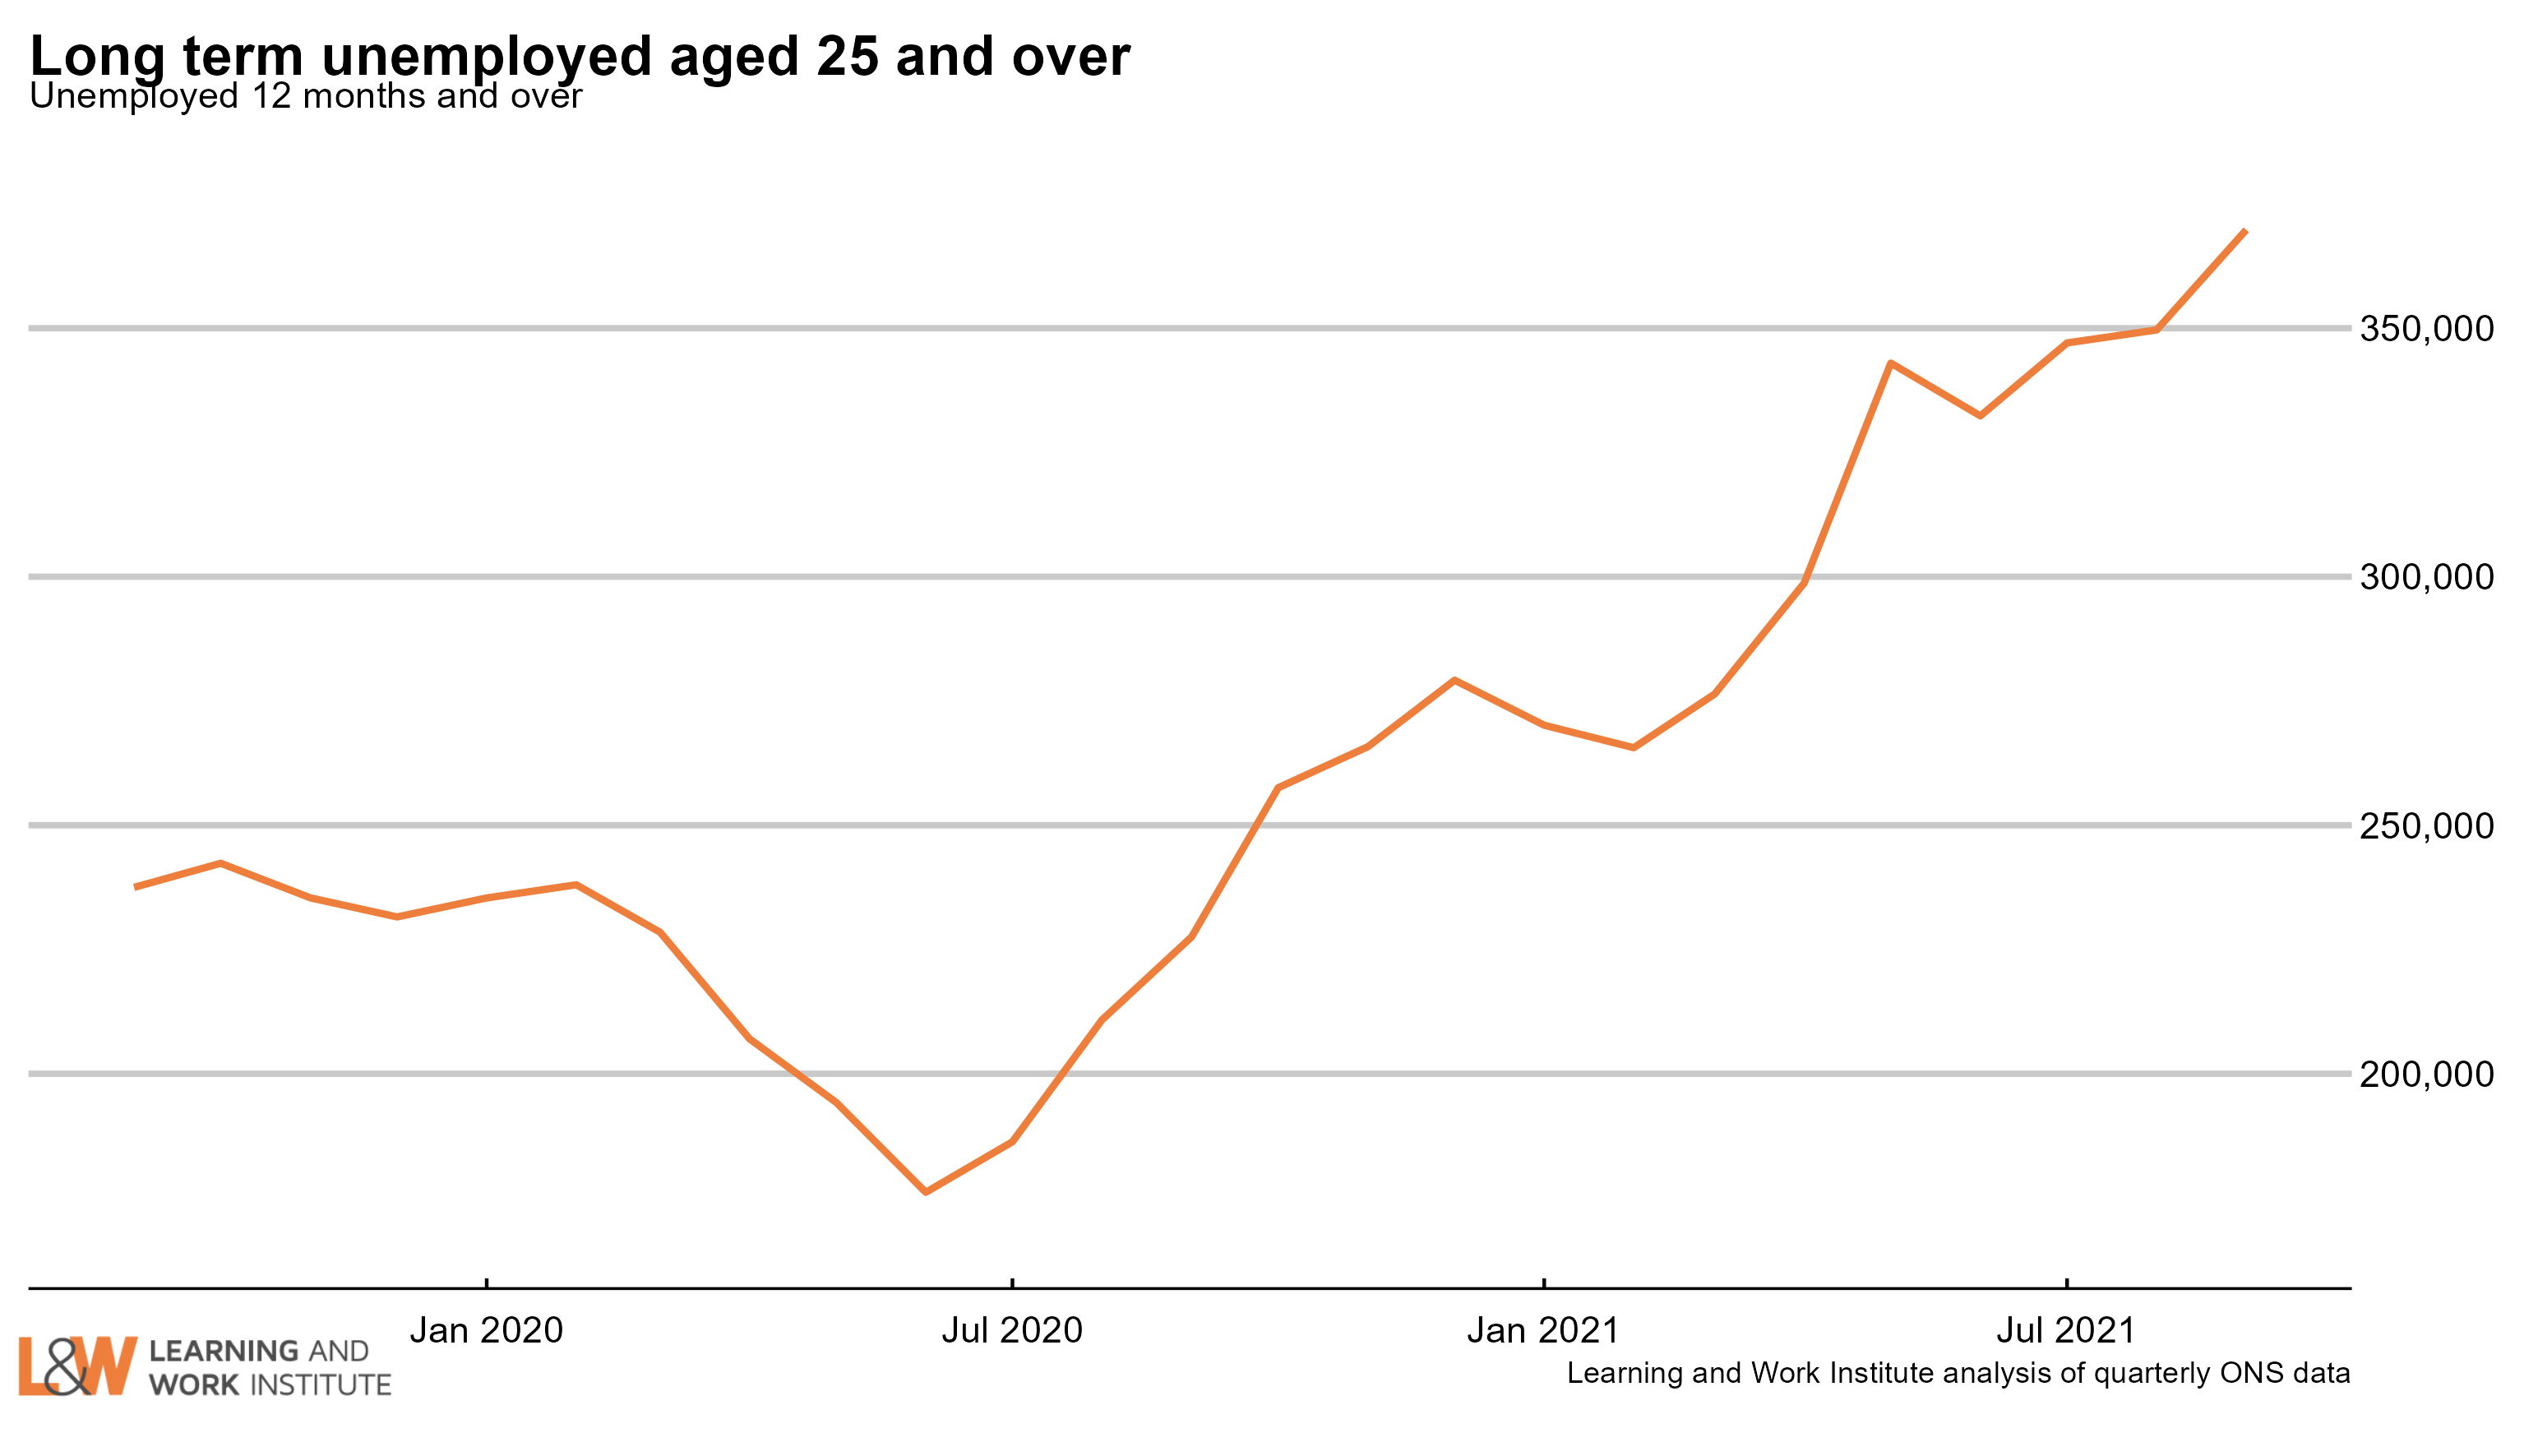
Chart 6: Adult long-term unemployment (12 months and over, 25+)
Adult long-term unemployment on the survey measure is now 370,000. This is the highest level since 2015.
 |
|
Chart 7: Unemployment rates by age
The 18 to 24 year old unemployment rate (including students) is 10.4% of the economically active – excluding one million economically inactive students from the calculation. The rate for those aged 25 to 49 is 3.2%. For those aged 50 and over it is 3.3%. The quarterly change is down 0.7 percentage points for 18 to 24 year olds, down 0.4 points for 25 to 49 year olds, and down 0.1 points for the over-50s. 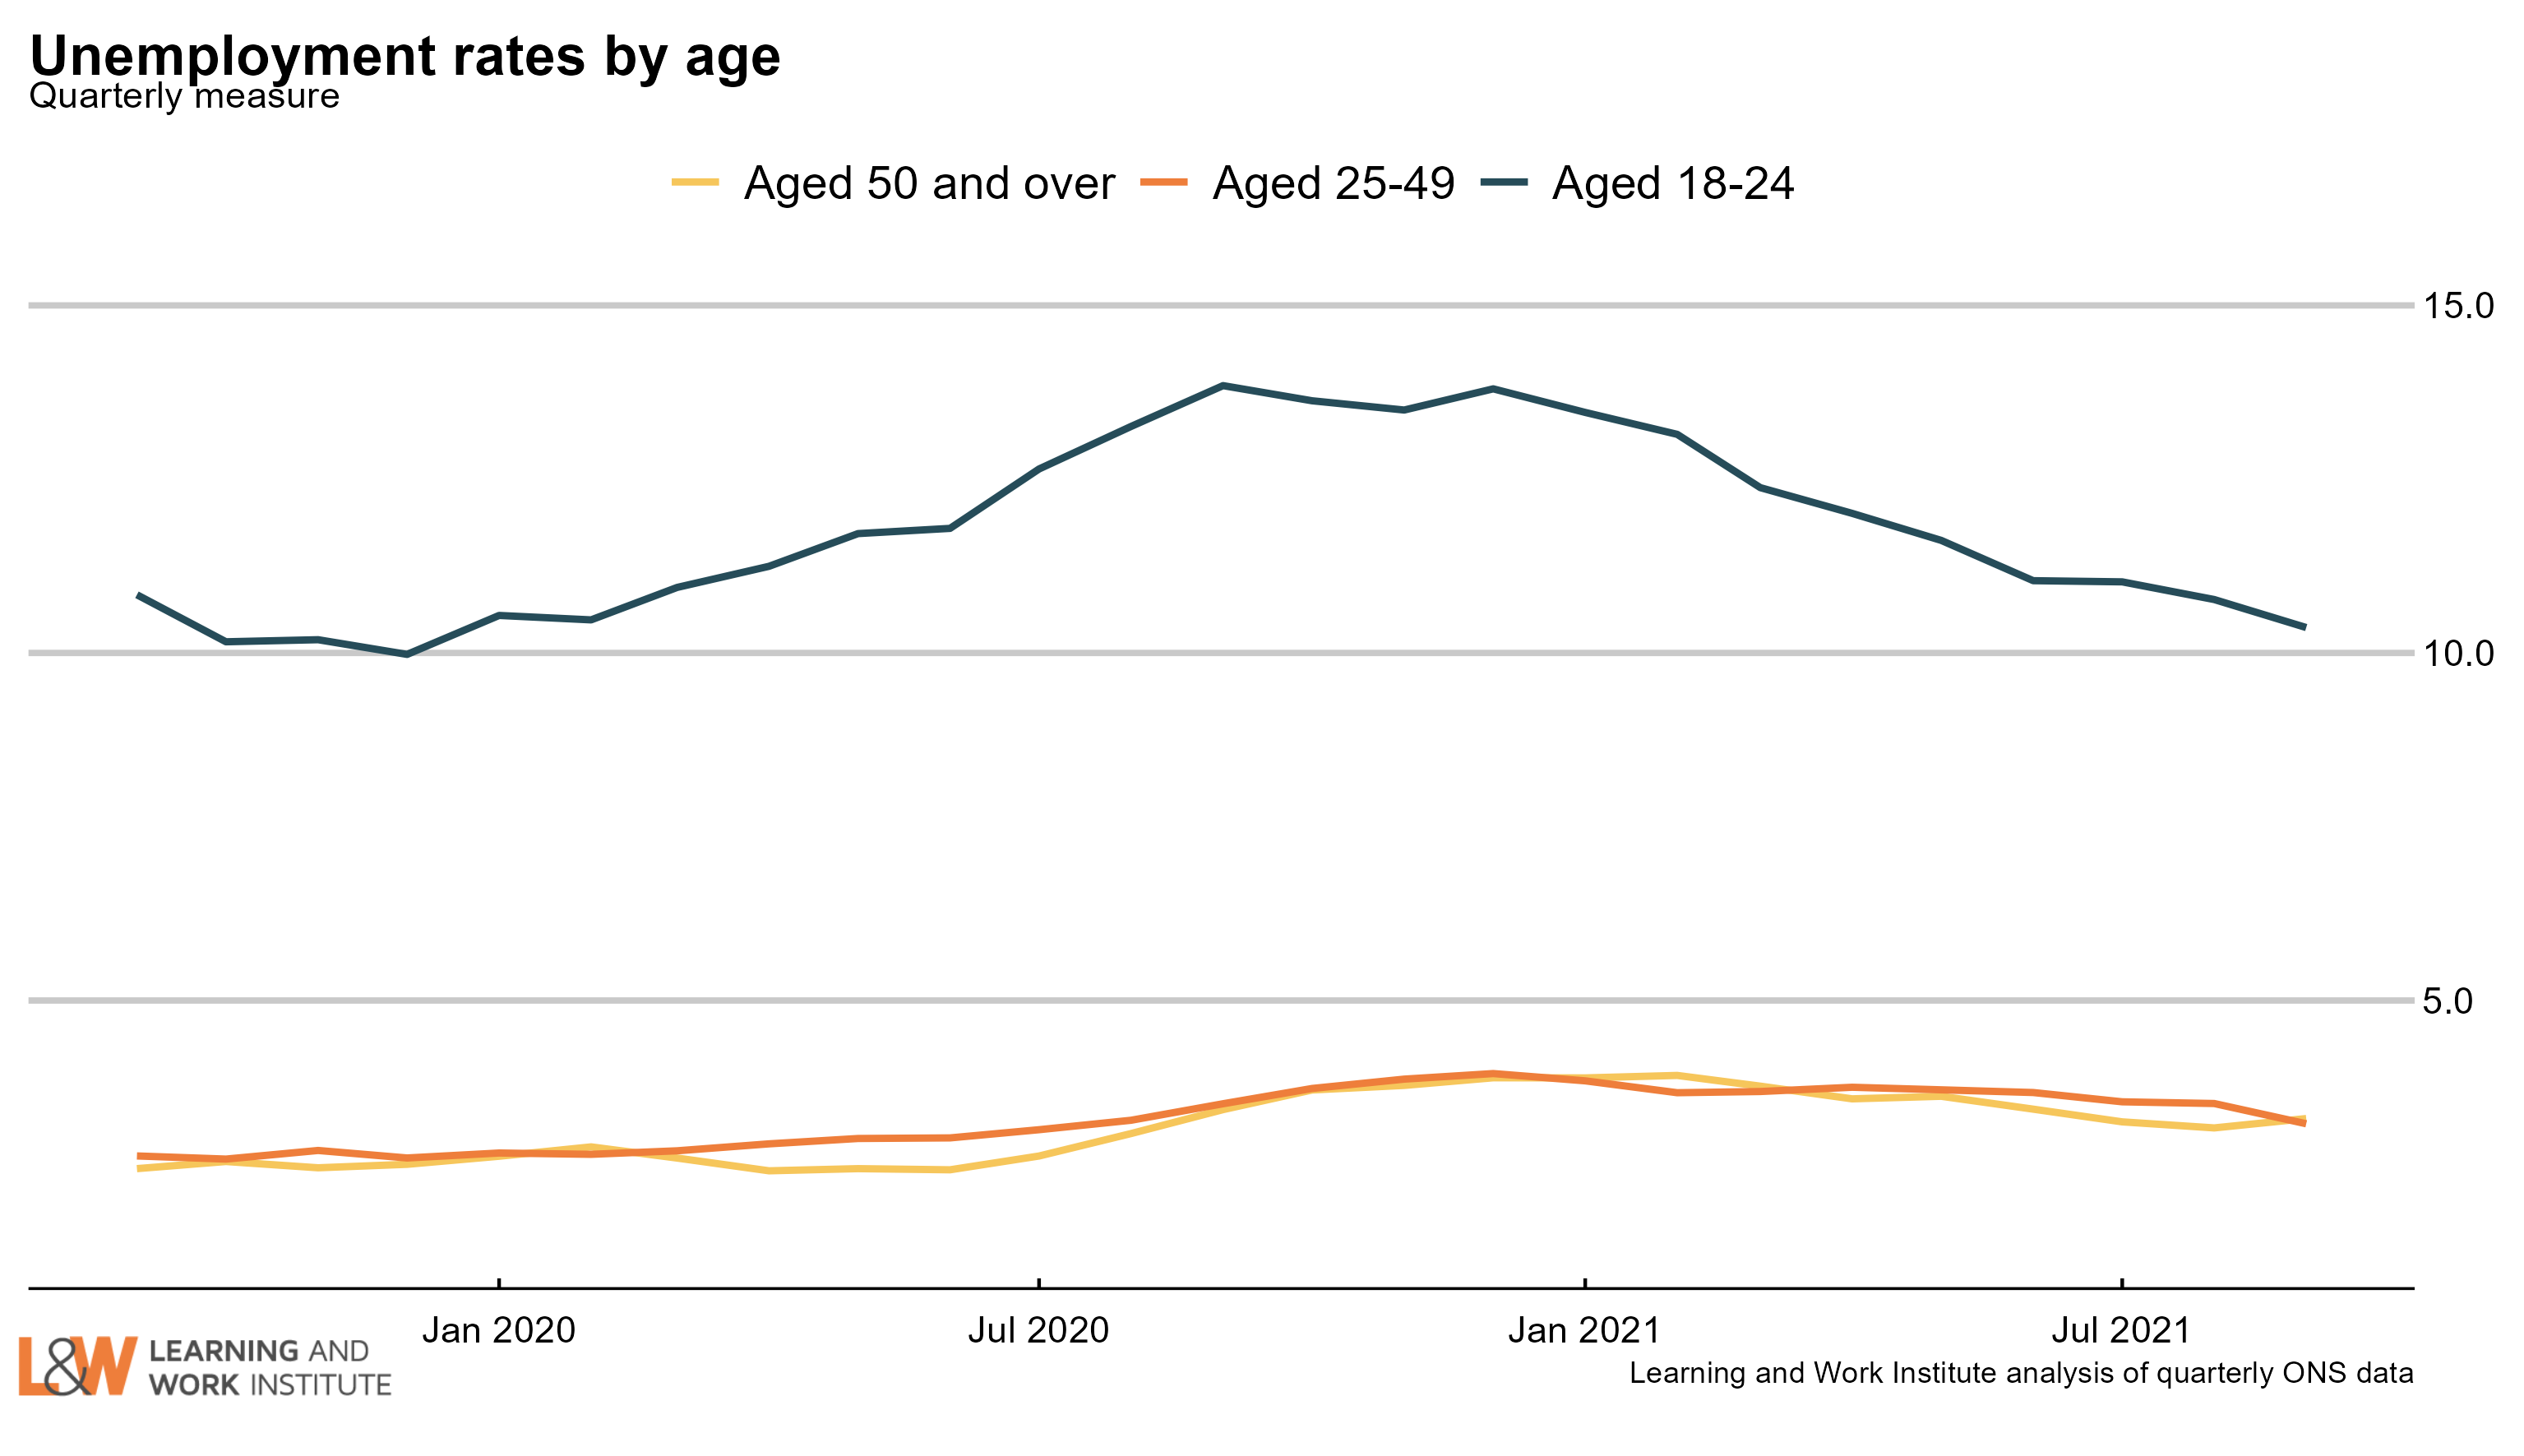 |
|
Chart 8: Unemployment rate changes by age (counting February 2020 as 100)
The 18 to 24 year old unemployment rate (including students) is 0.1 percentage points lower than in February 2020. The equivalent change for those aged 25 to 34 is up 0.5 points. The change for those aged 35 to 49 is up 0.4 points. The change for those aged 50 to 64 is up 0.5 points. The change for those aged over 65 is up 0.1 points.
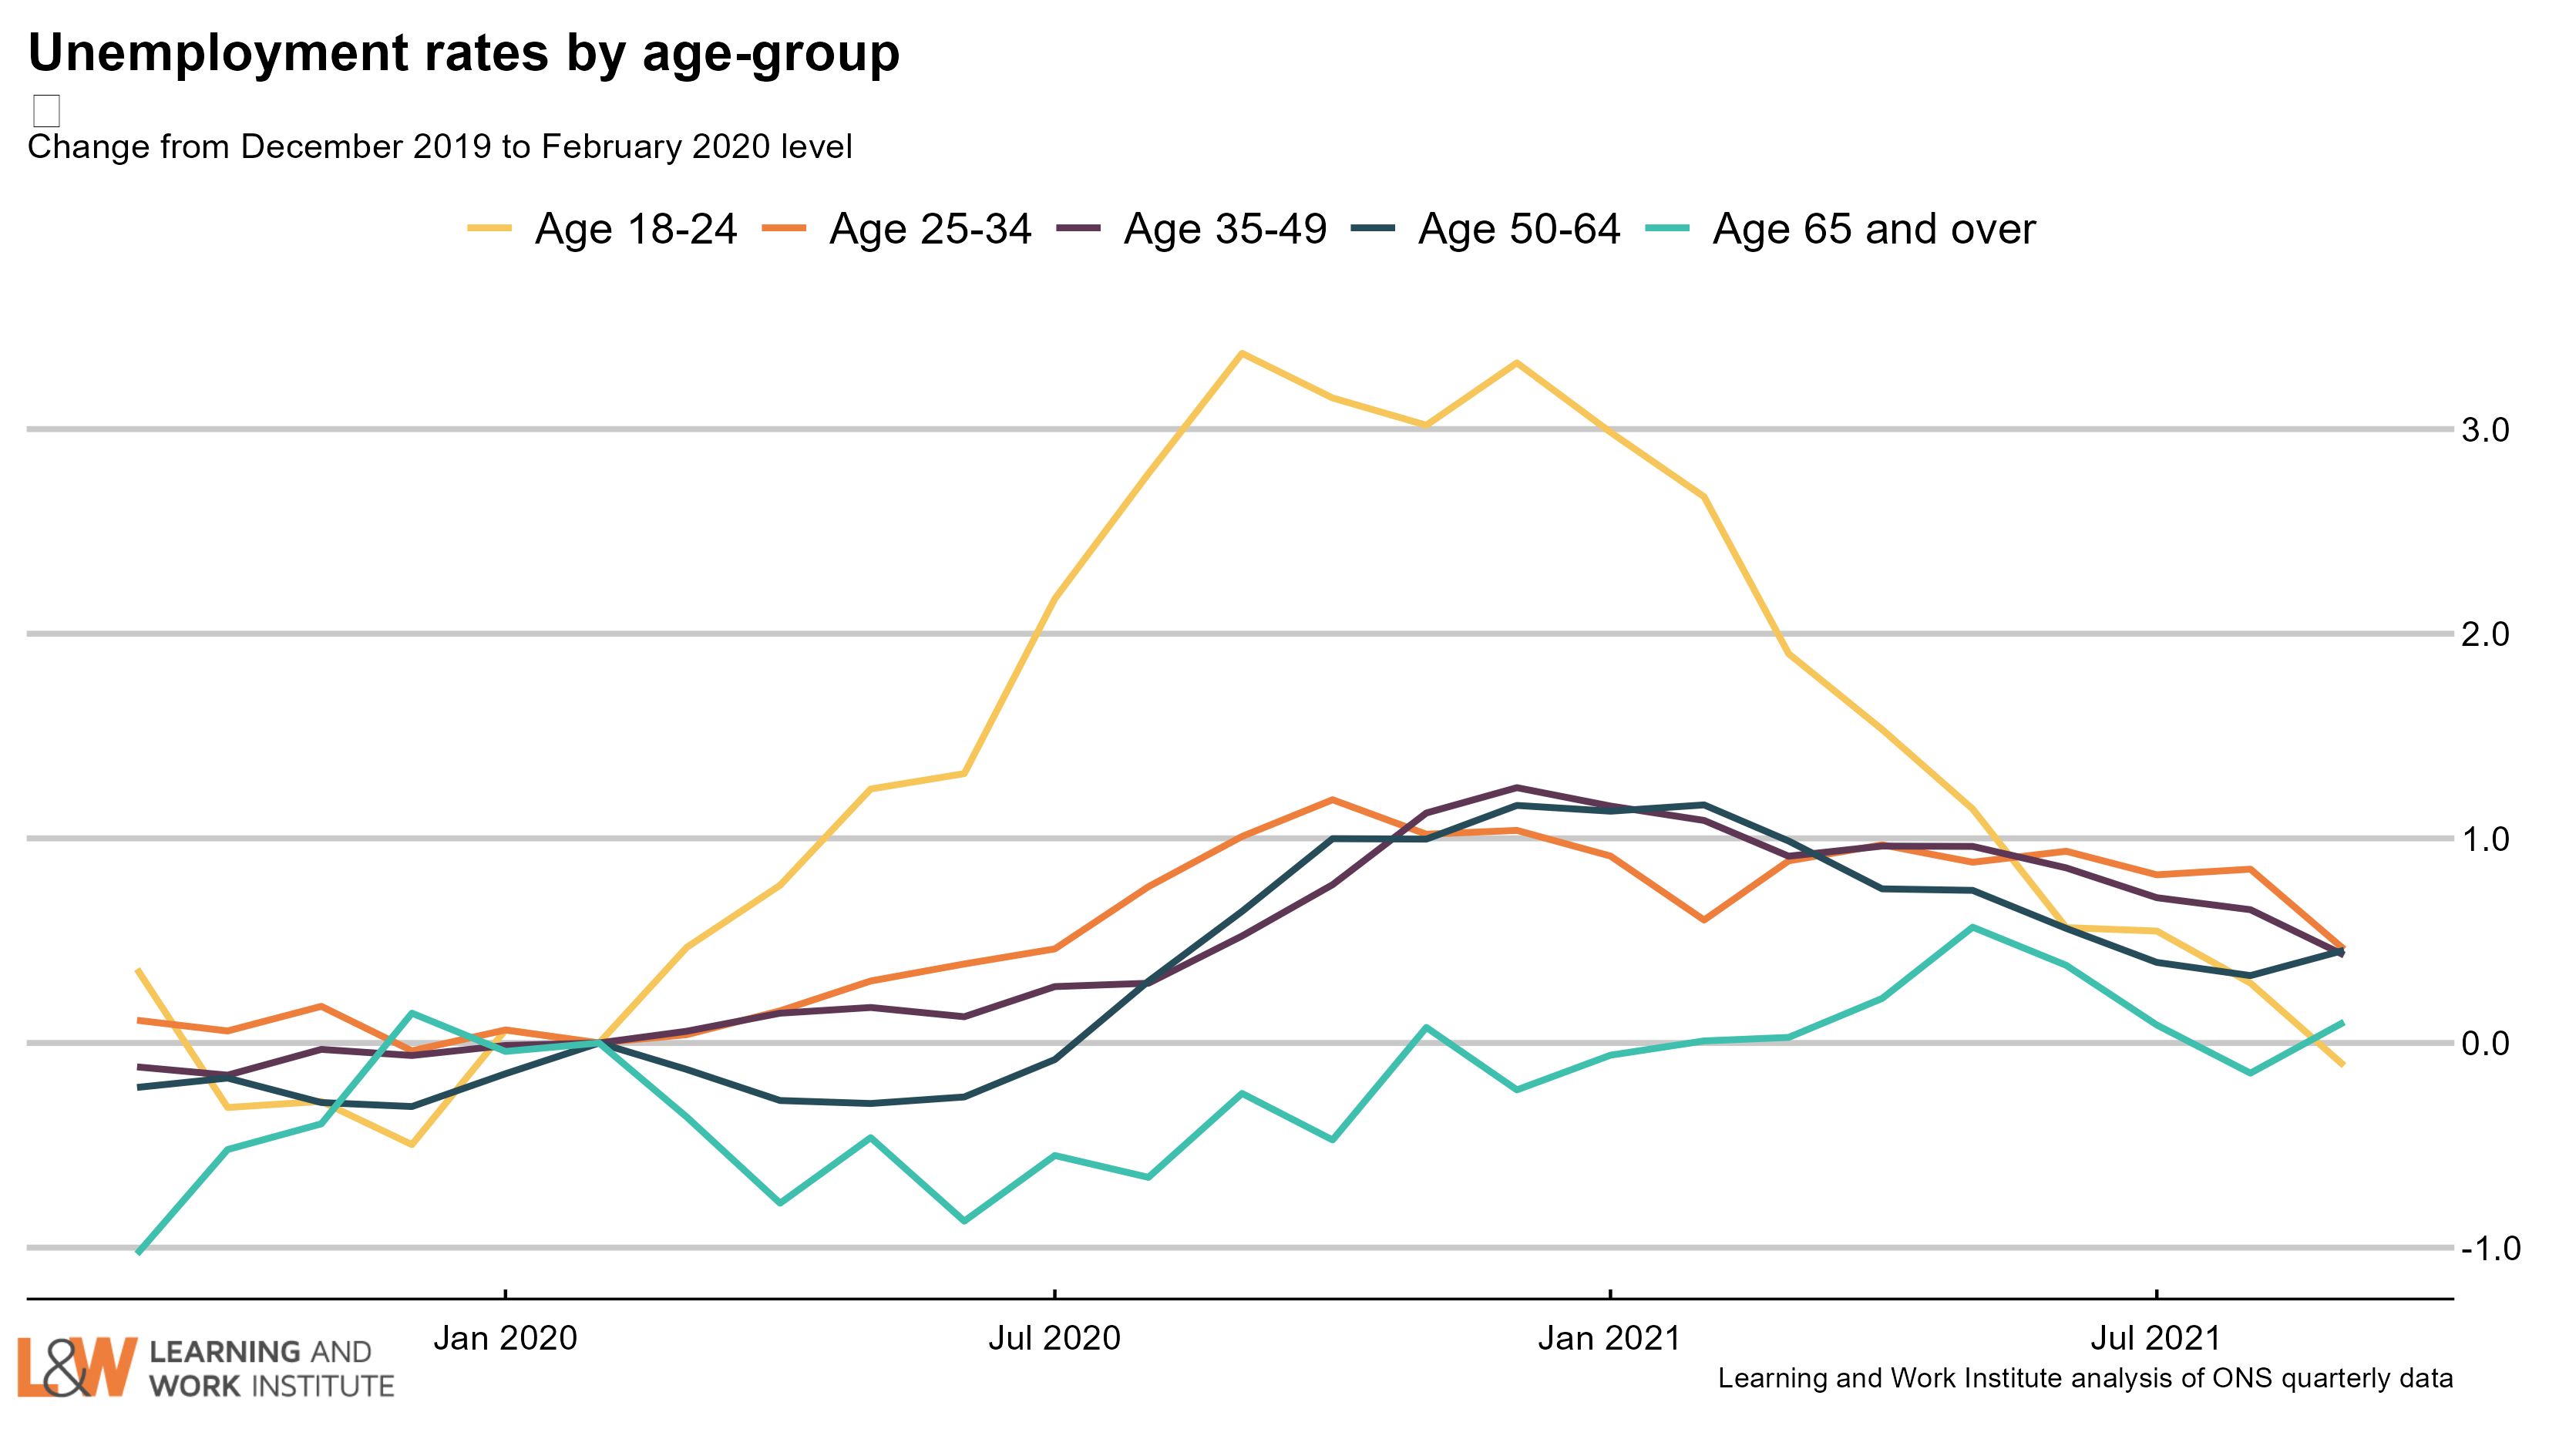
Chart 9: Vacancies – whole economy survey
Headline vacancies
this month is up by 64,000 to 1,172,000. The ONS' experimental single-month vacancy figures increased by 242,000 to 1,298,000 over the quarter to October. The headline ONS vacancy figure is both seasonally adjusted and a three-month average. The chart shows both series.
 |
|
Chart 10: Experimental single month vacancies – whole economy survey
The Office for National Statistics' experimental single month vacancy estimates include sectoral information. Here, we show the changes on the same month two years ago, before the pandemic. The data is not seasonally adjusted, so comparisons with the same month each year are better. The numbers are thousands of vacancies, under each number, and on the right, the change in thousands of vacancies. 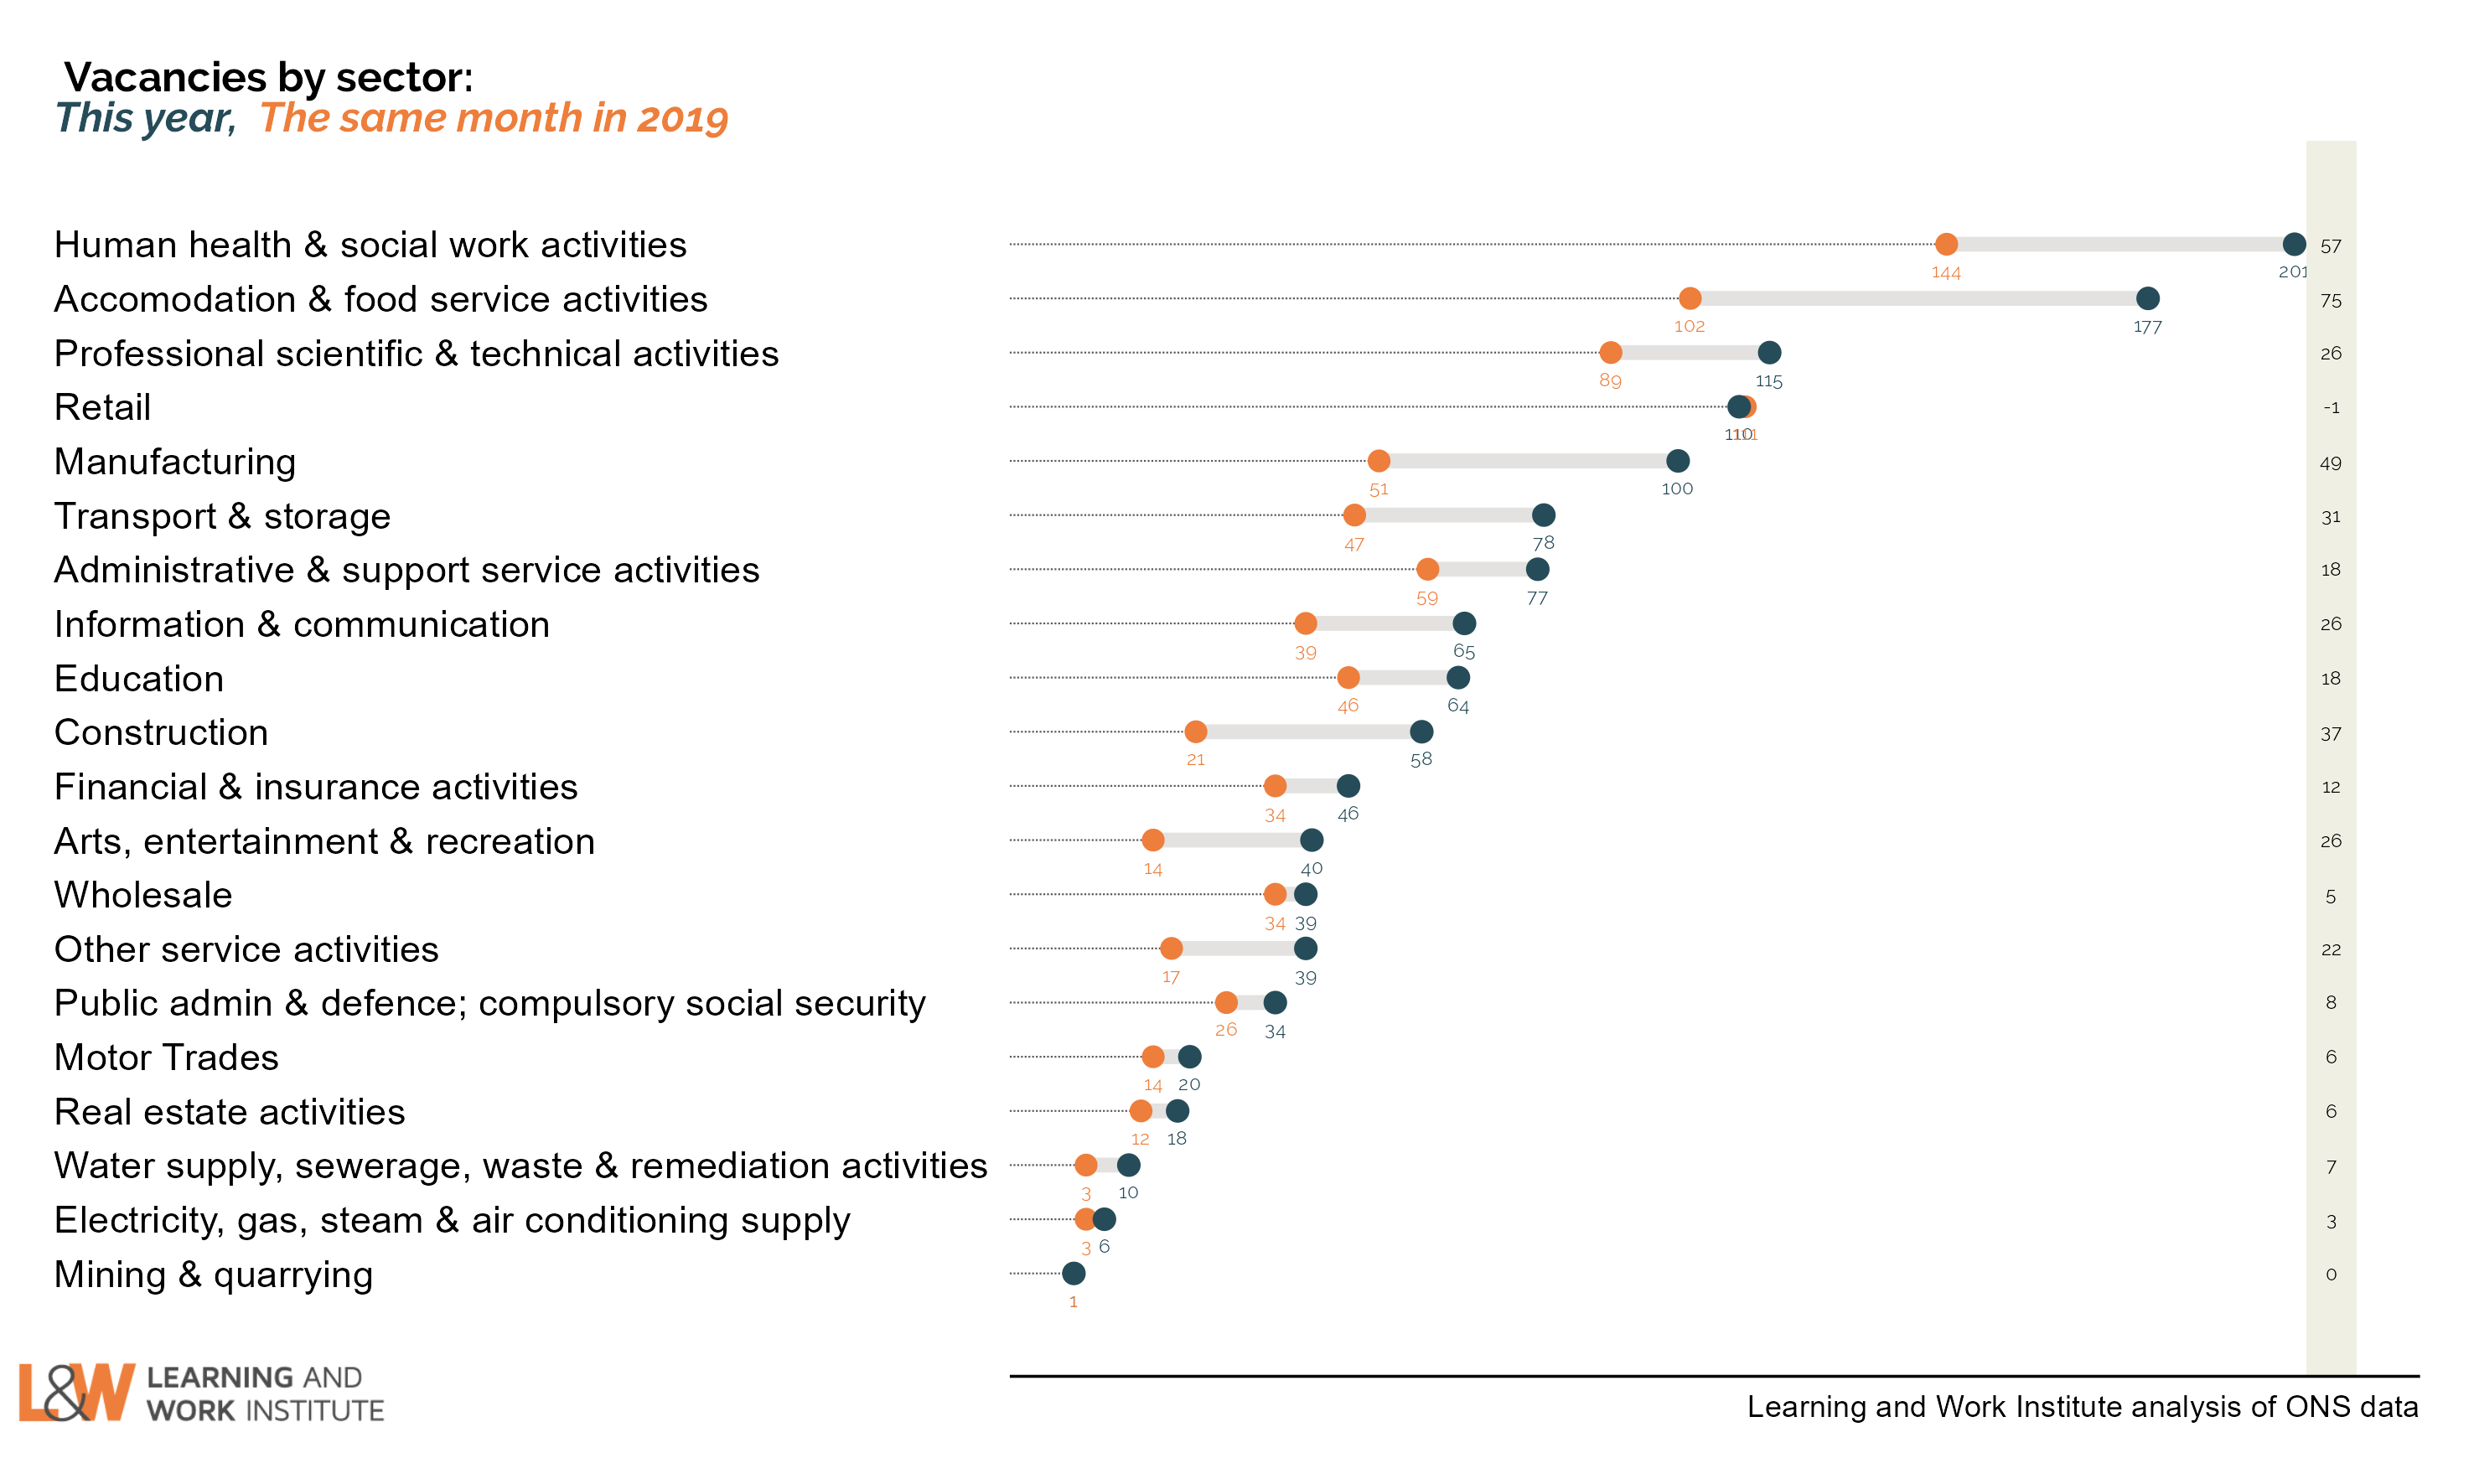 |
|
Chart 11: Unemployed people per vacancy
There are 1.3 unemployed people per vacancy. This has fallen back as the number of vacancies has risen, despite increasing numbers of unemployed. This is the lowest since the series started in 2001. 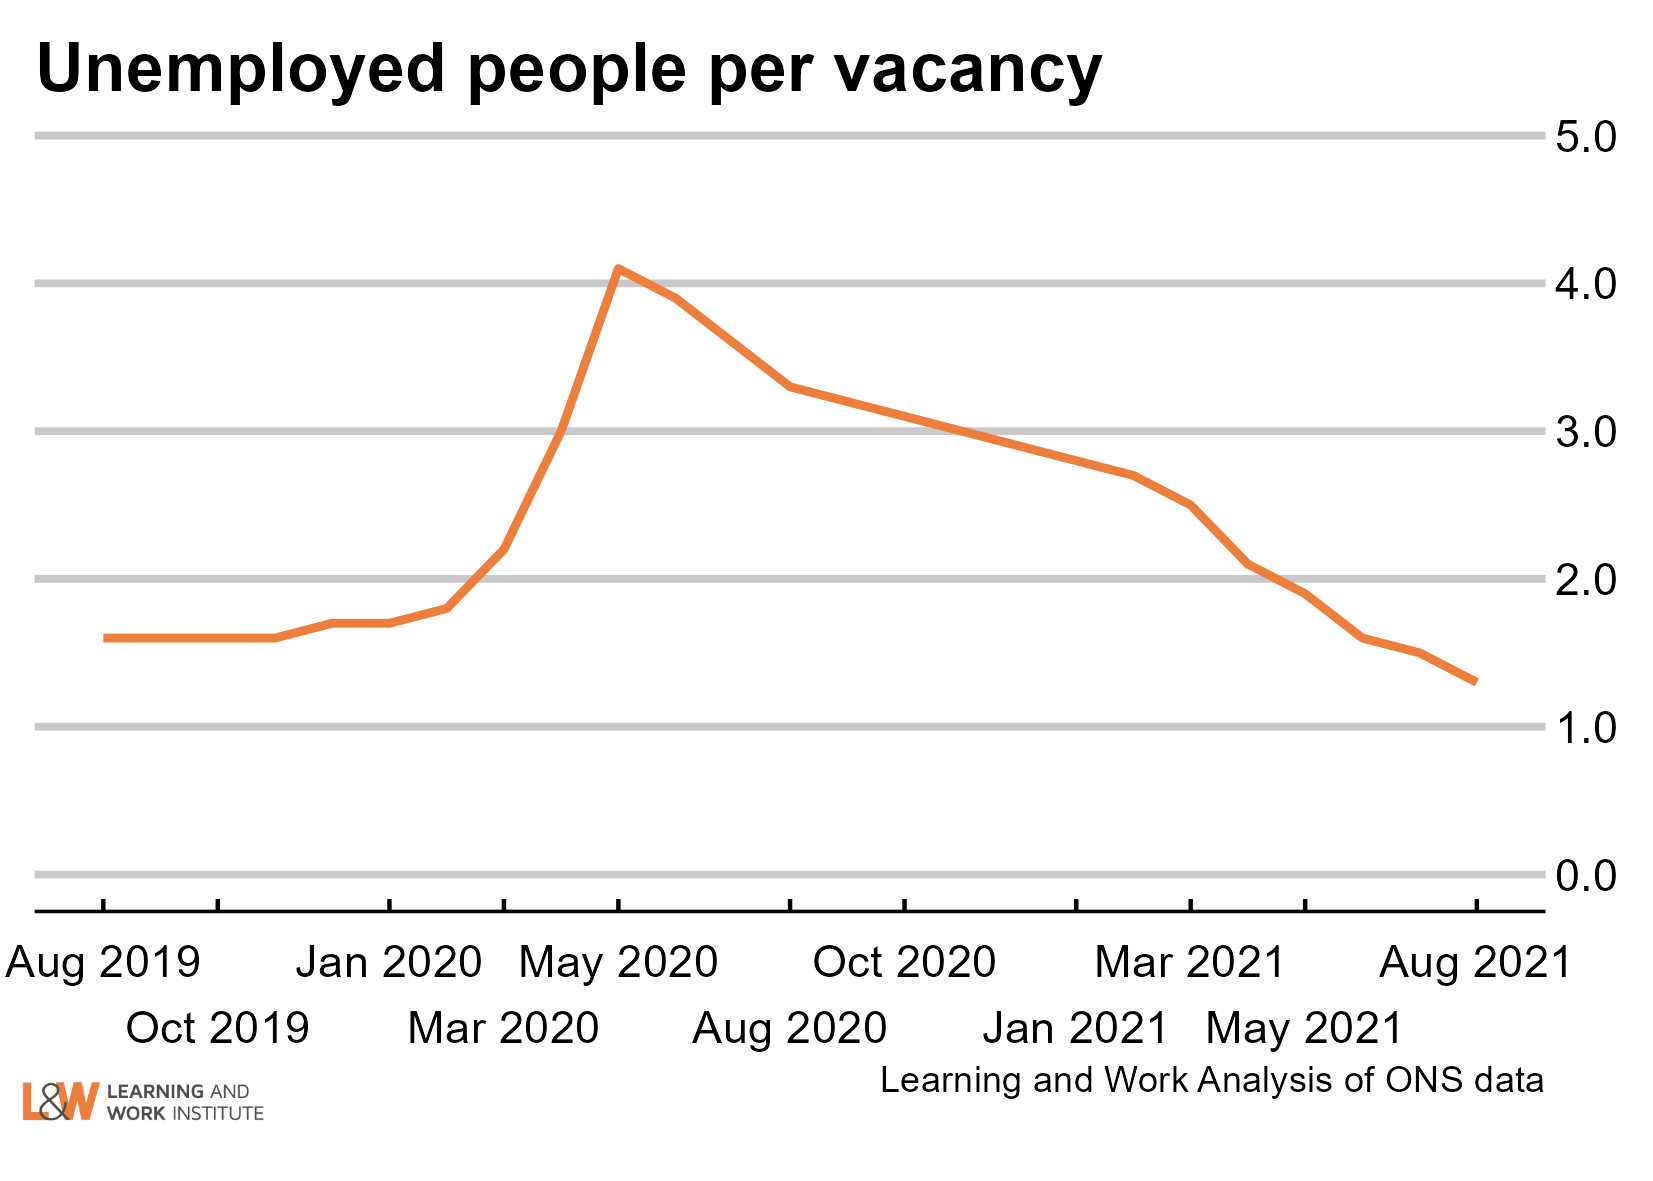 |
|
Chart 12: Online vacancies to early November from Adzuna
Online vacancies have again increased substantially, continuing the recent rises. Online vacancies are up to 147% of Feb 2020. They are at their maximum since the series started in February 2018. Compared with the same week in 2018, the overall vacancy level is up 24%. 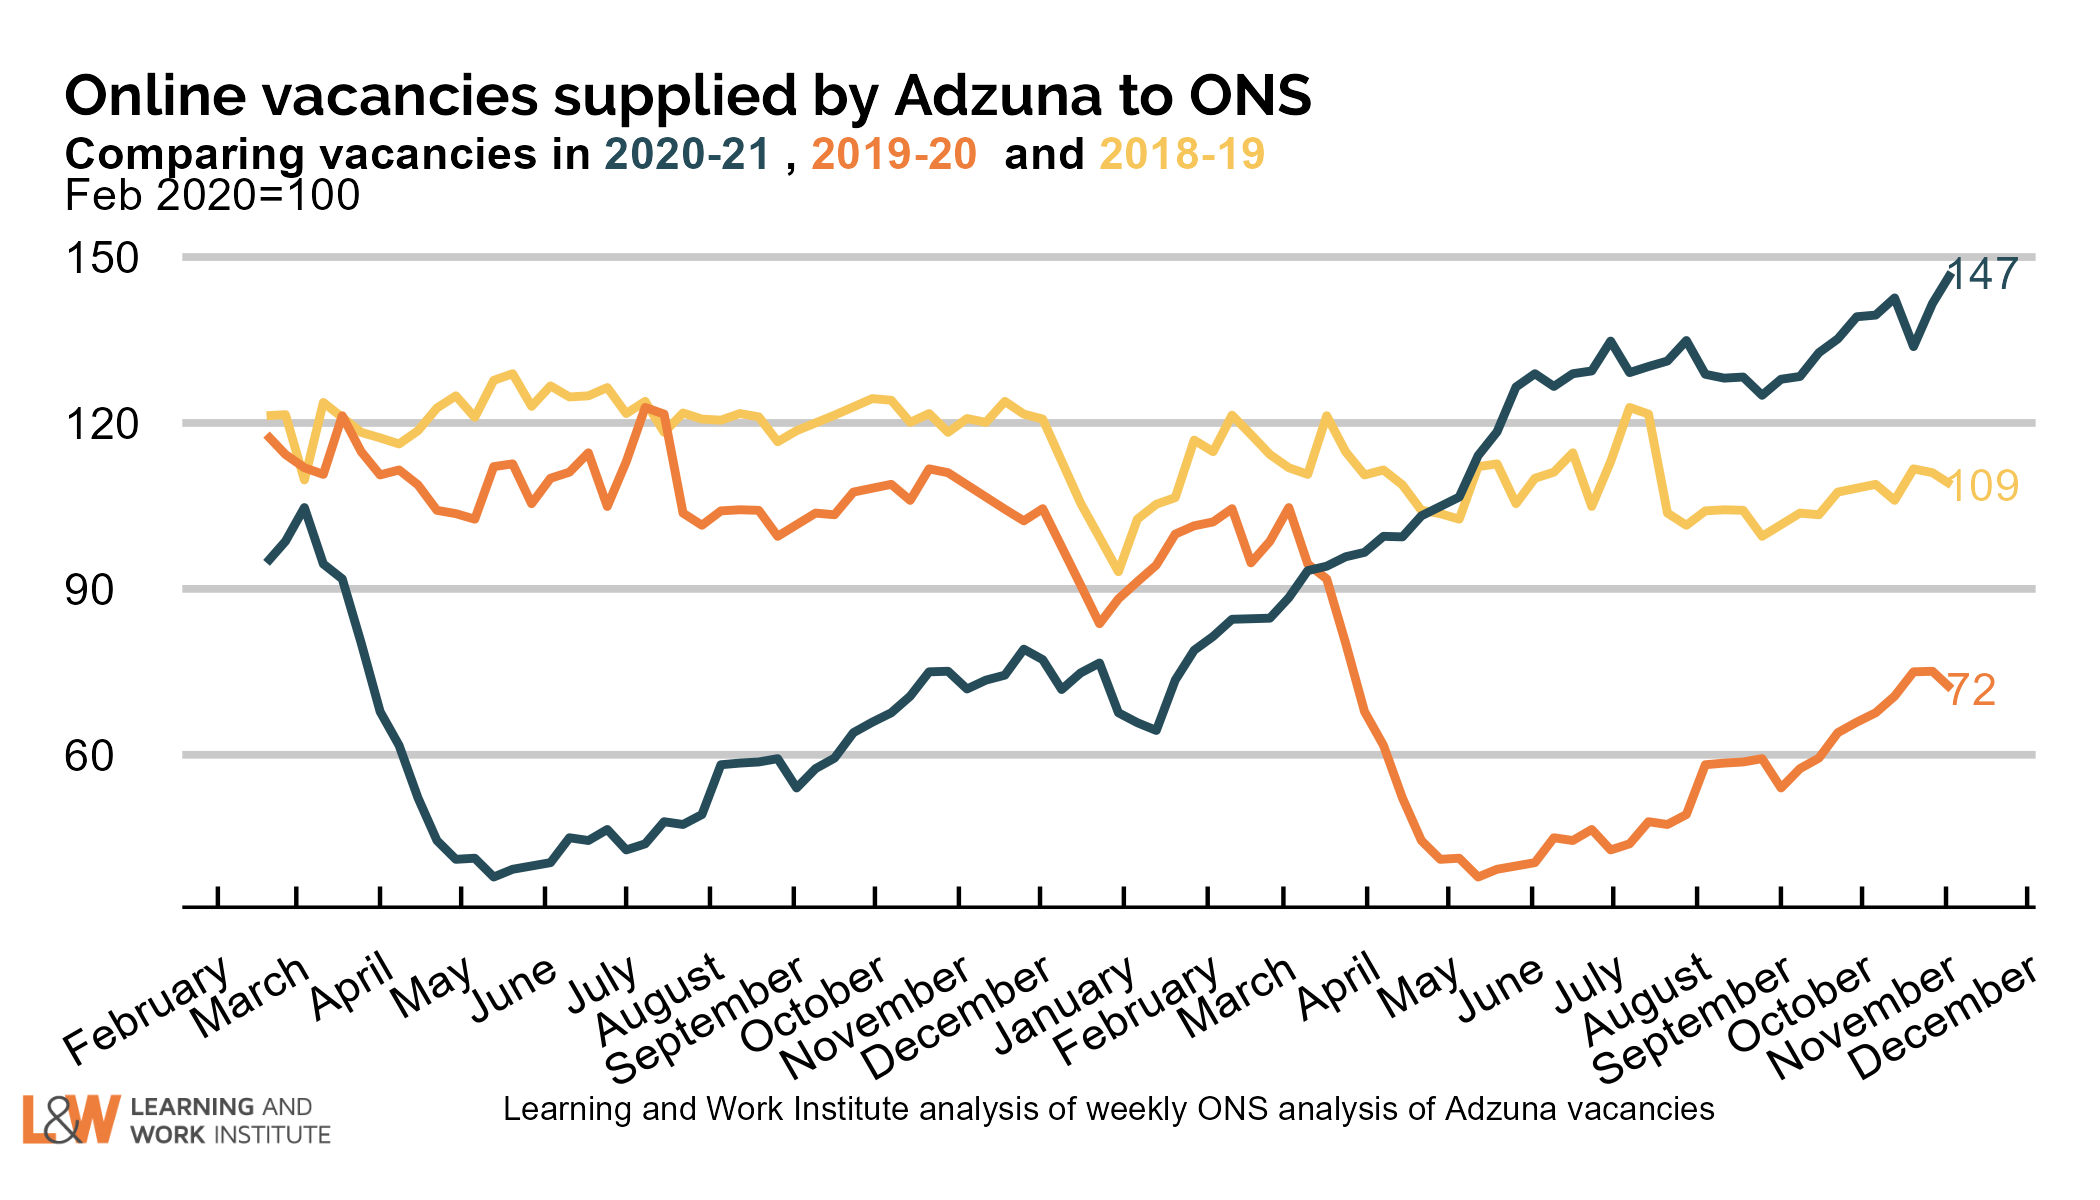 |
|
Chart 13: UK employment
Employment increased by 108,000 on the figure published last month, to 32,523,000. The chart shows both the official figures and the experimental weekly figures. The level is likely to be fairly stable (although HMRC provisional payroll figures show further rises). 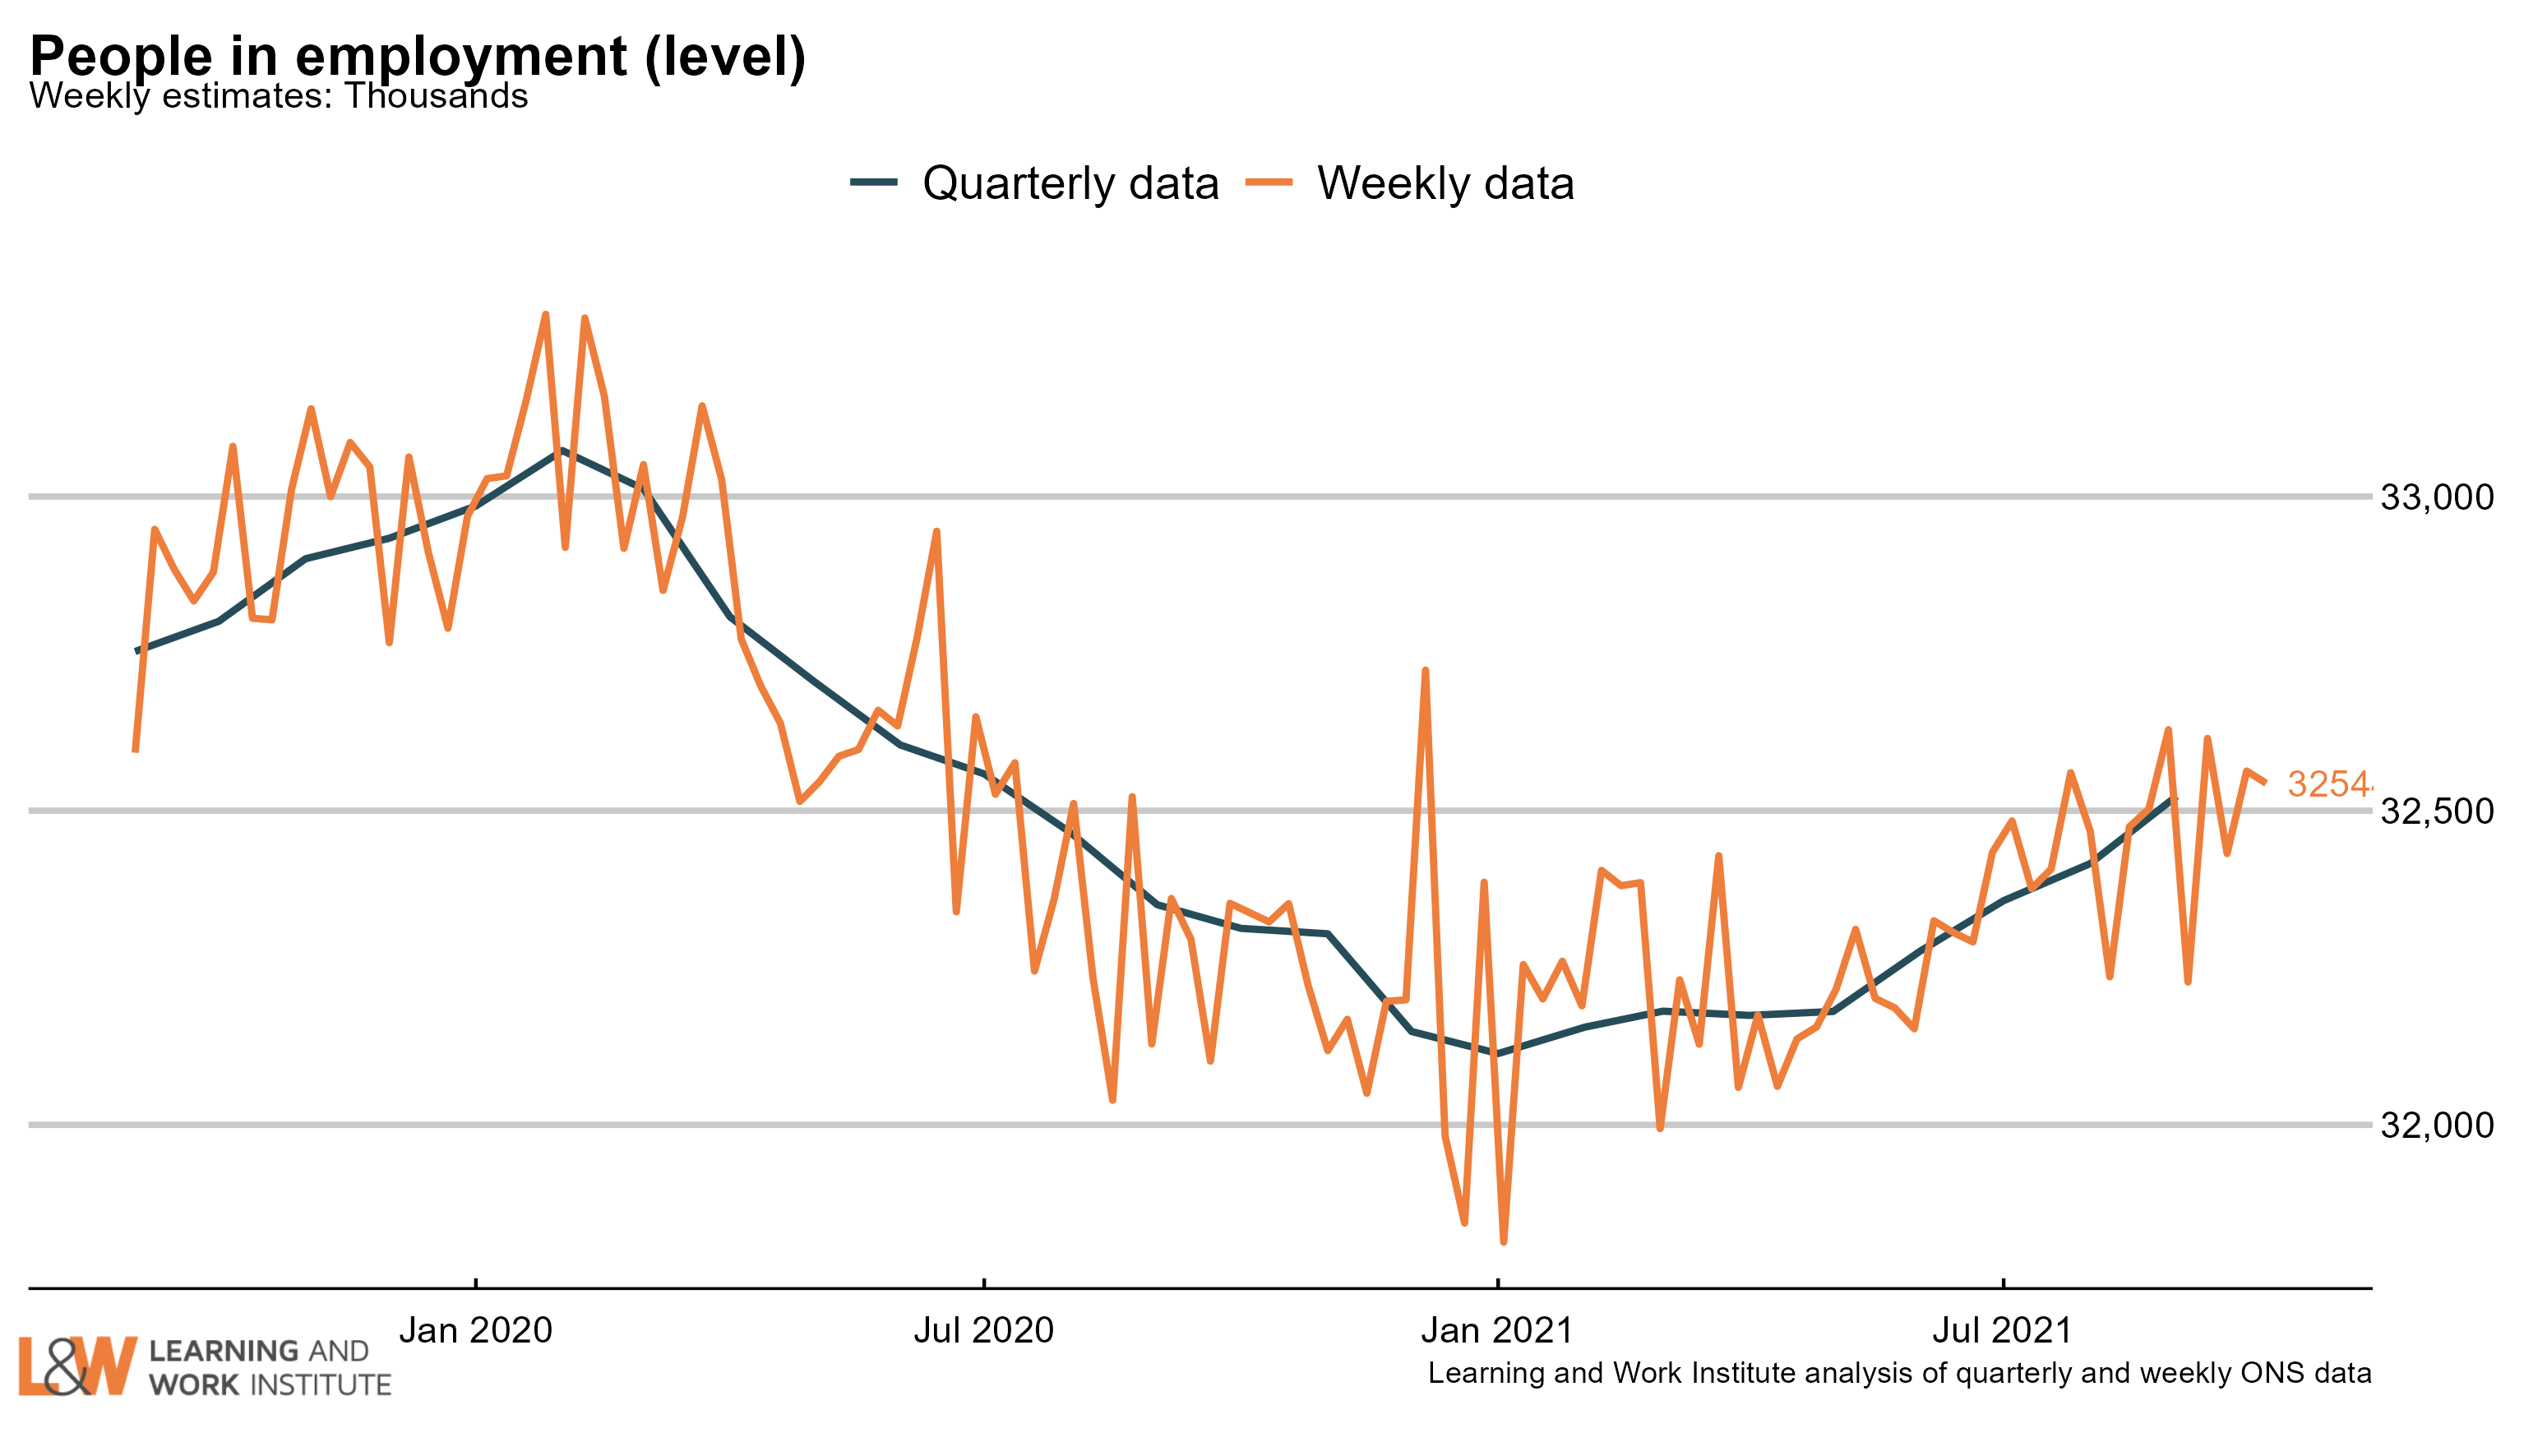 |
|
Chart 14: Employment rate in the UK
The employment rate rose by 0.4 percentage points over the quarter, to 75.4%. The chart shows both the official figures and the experimental weekly figures. The trend is likely to be upwards. 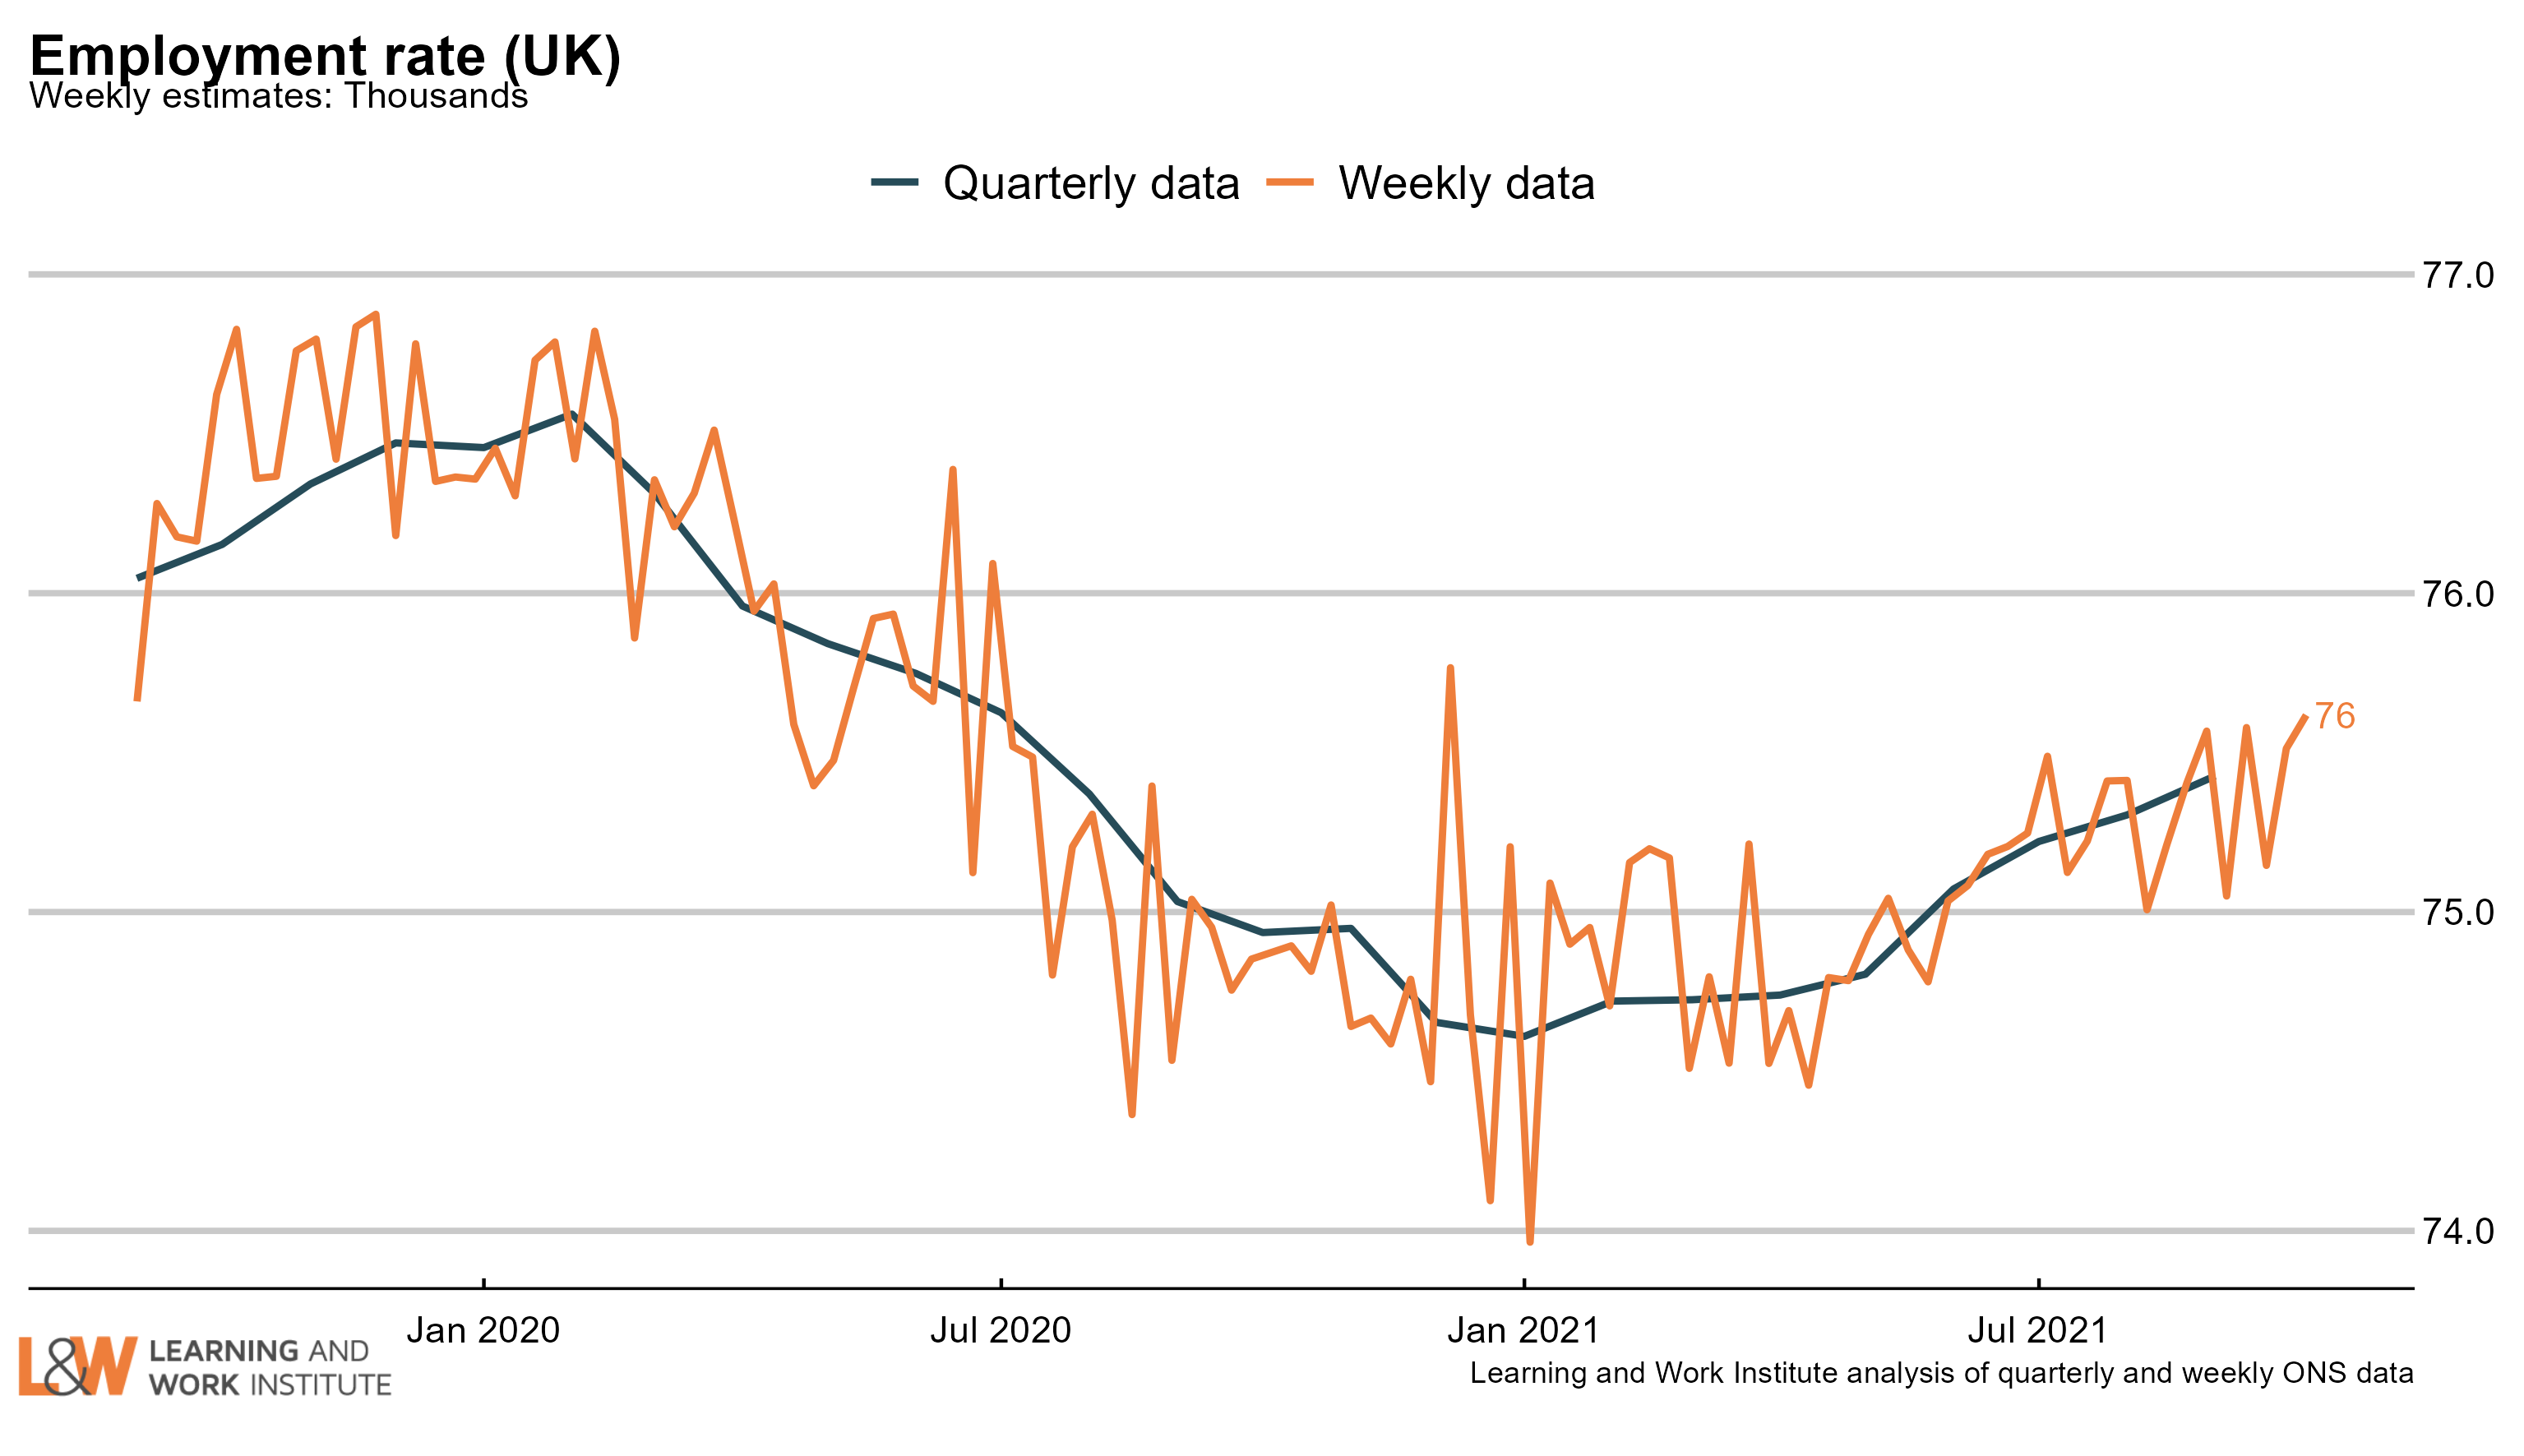 |
|
Chart 15: Economic inactivity – the long-term sick or disabled
The numbers of people who are economically inactive, that is, not working and not currently looking for work, who are long-term sick or disabled has risen sharply in the last three months to 2.26 million working age people. 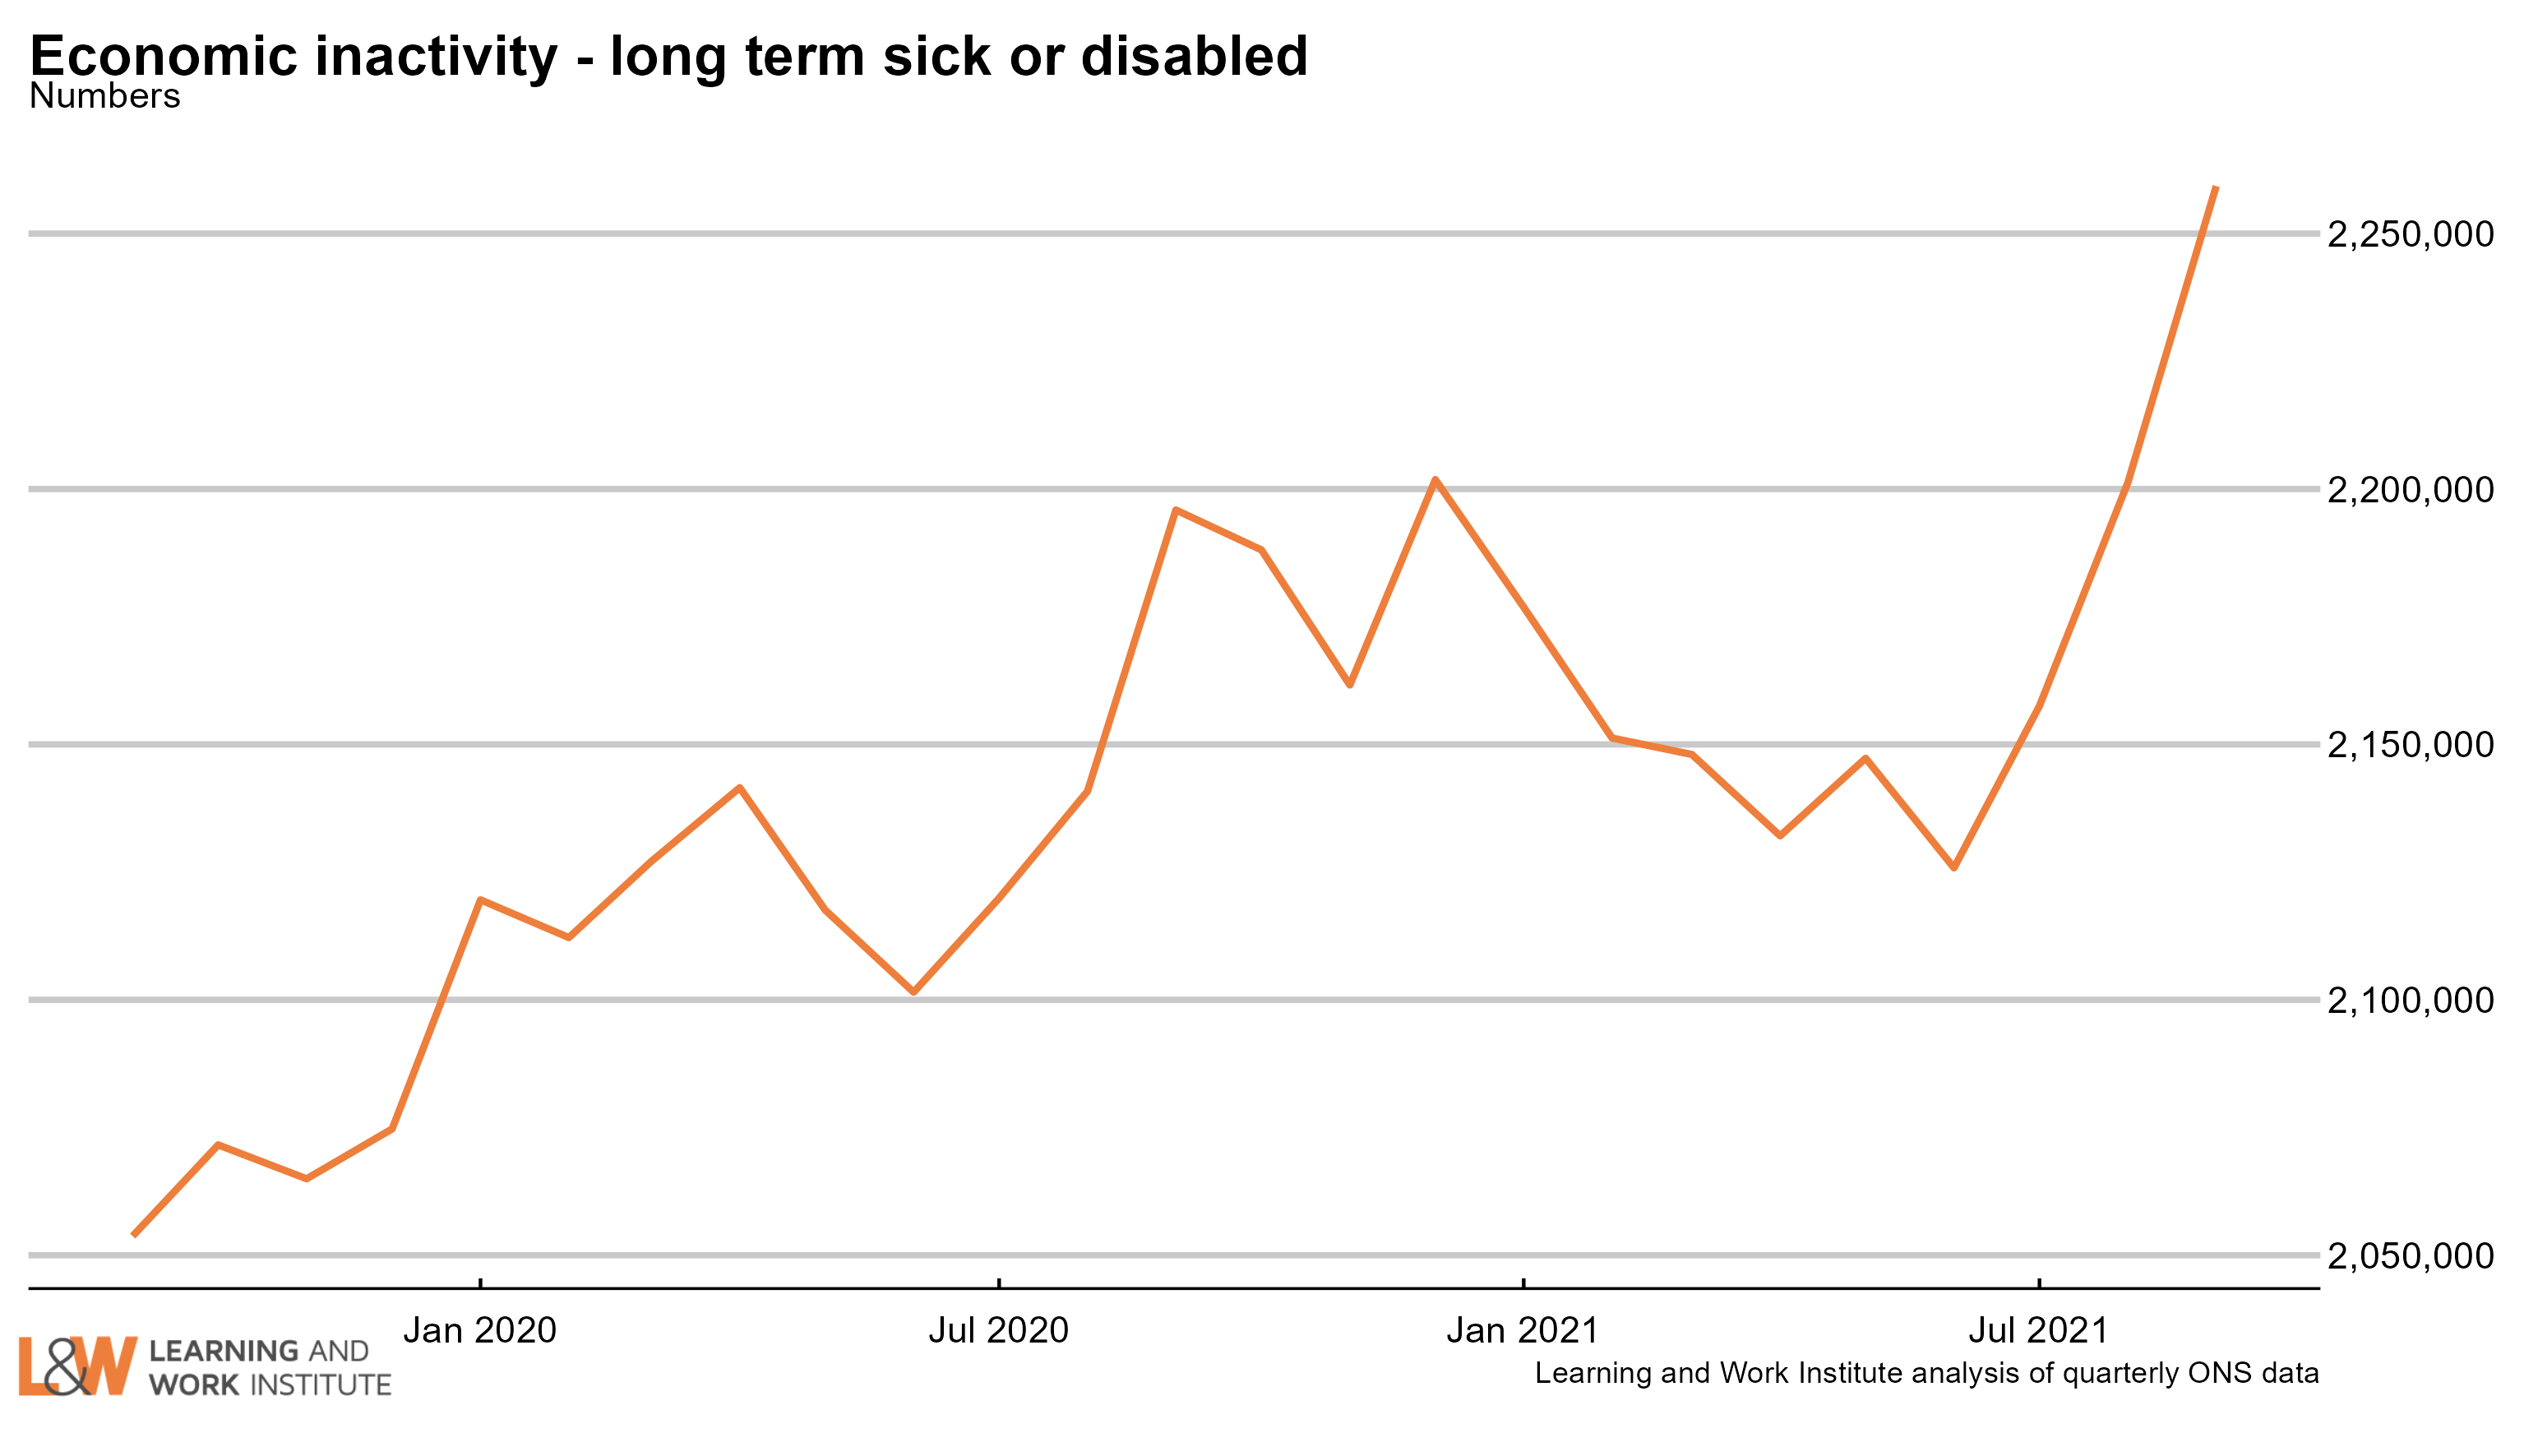 |
|
Chart 16: Economic inactivity – people looking after family
The survey figures showing those looking after family and not doing paid work or looking for paid work had been trending downwards but seems to have started rising. 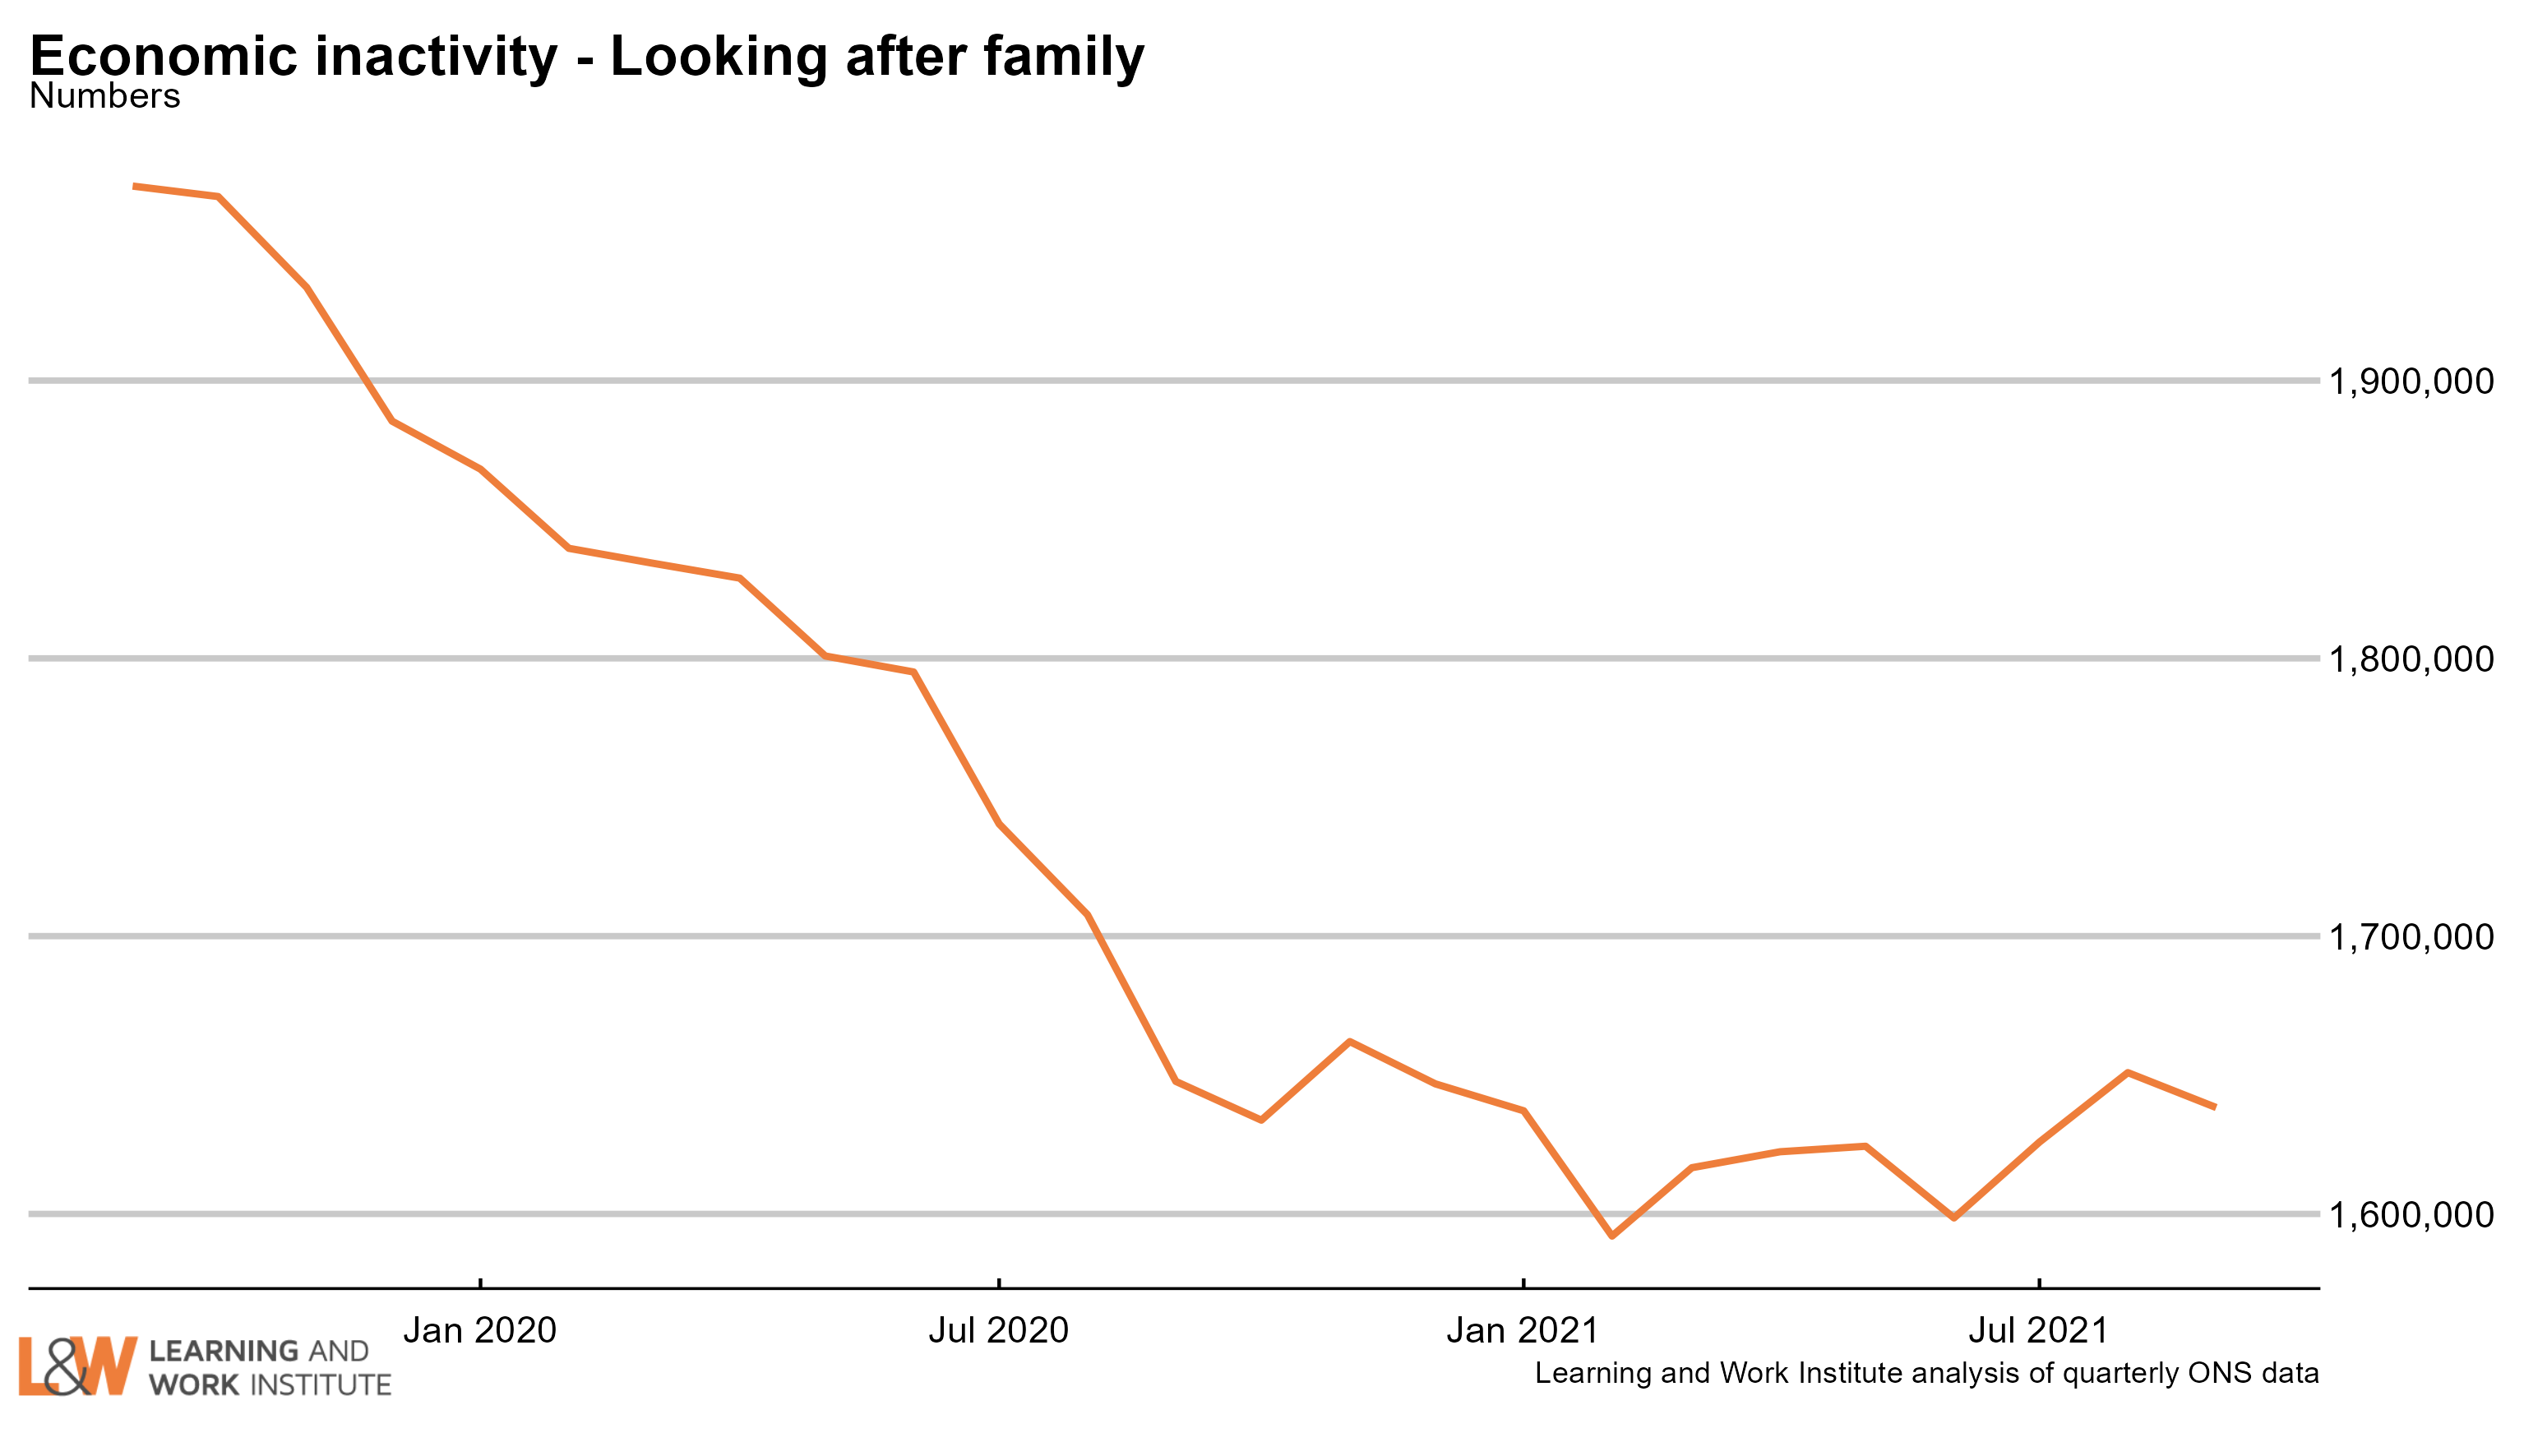 |
|
Chart 17: Economic inactivity – other inactive
In the Coronavirus period, people who were not working or looking for work due to Covid were included in this group. The number in this category increased sharply at the time, and has continued at a high level. A very high proportion of this group want to work, and this increased over the period of the pandemic. The increase over the pre-pandemic level is now 99,000. 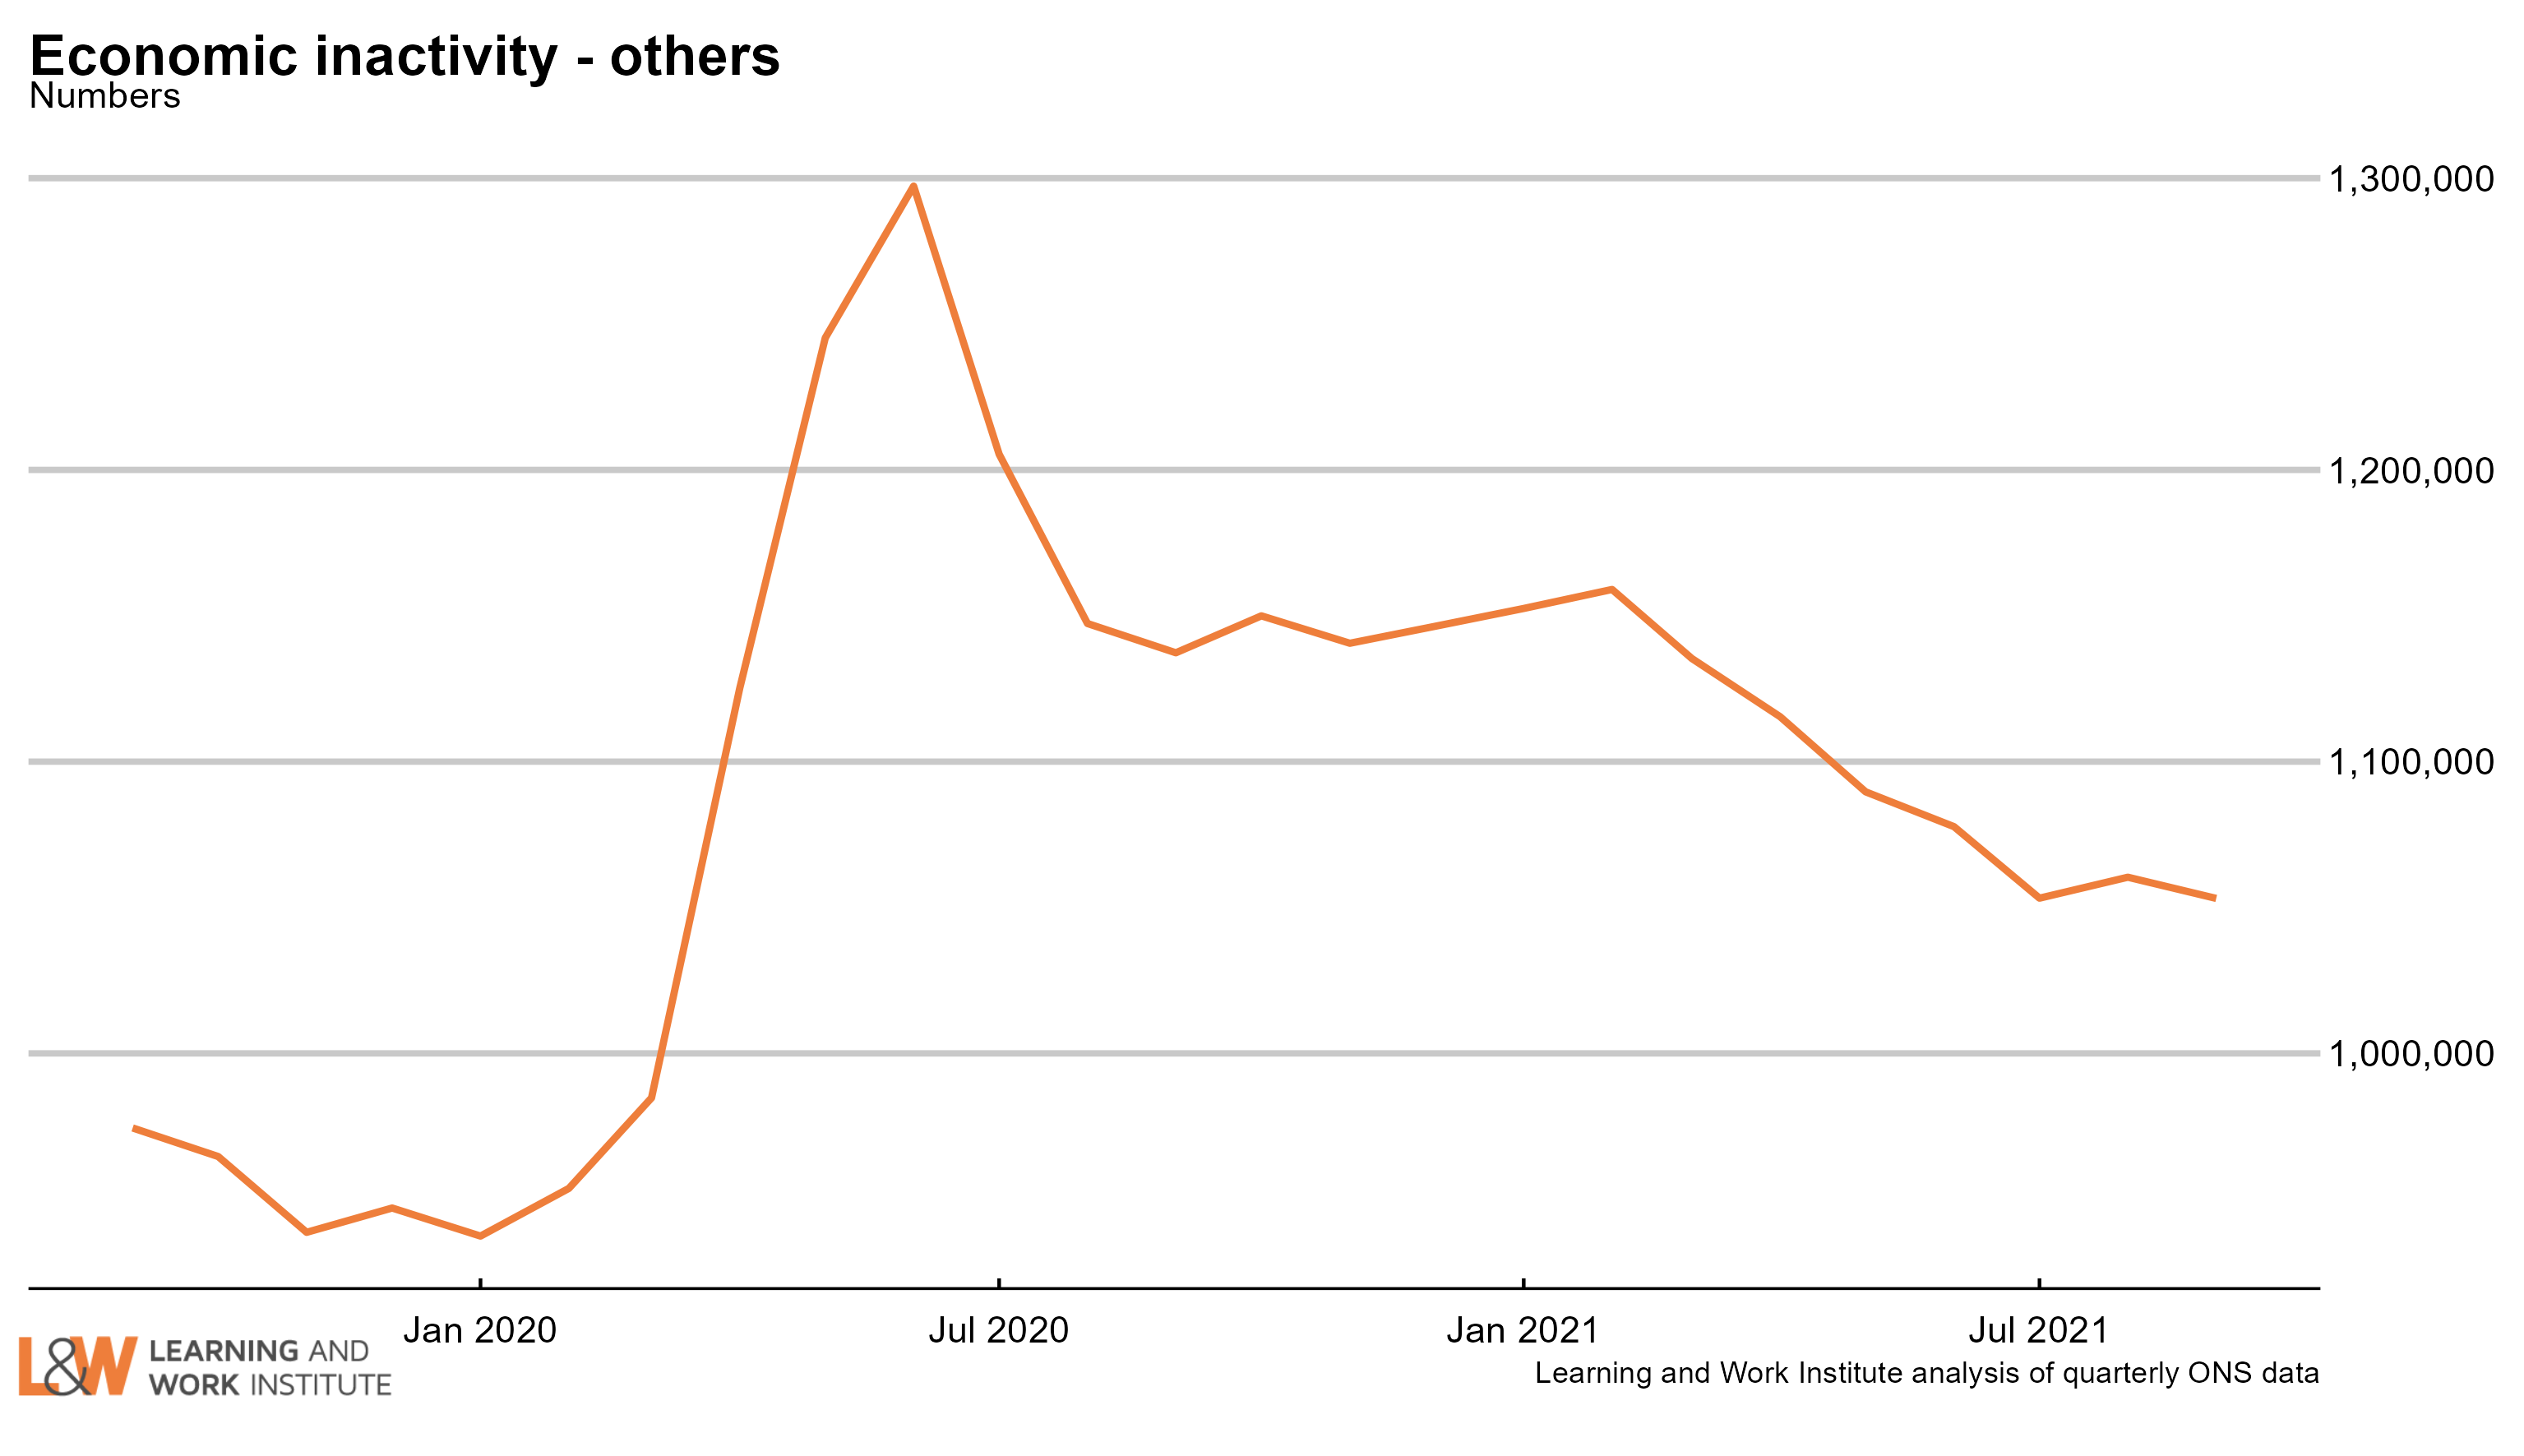 |
|
Chart 18: Employment rate two-year change in regions – July to September 2021
Compared with 2019, three regions showed a rise in the employment rate, led by the Eastern region and London. The employment rate fell in 9 regions, led by the South West and Northern Ireland. 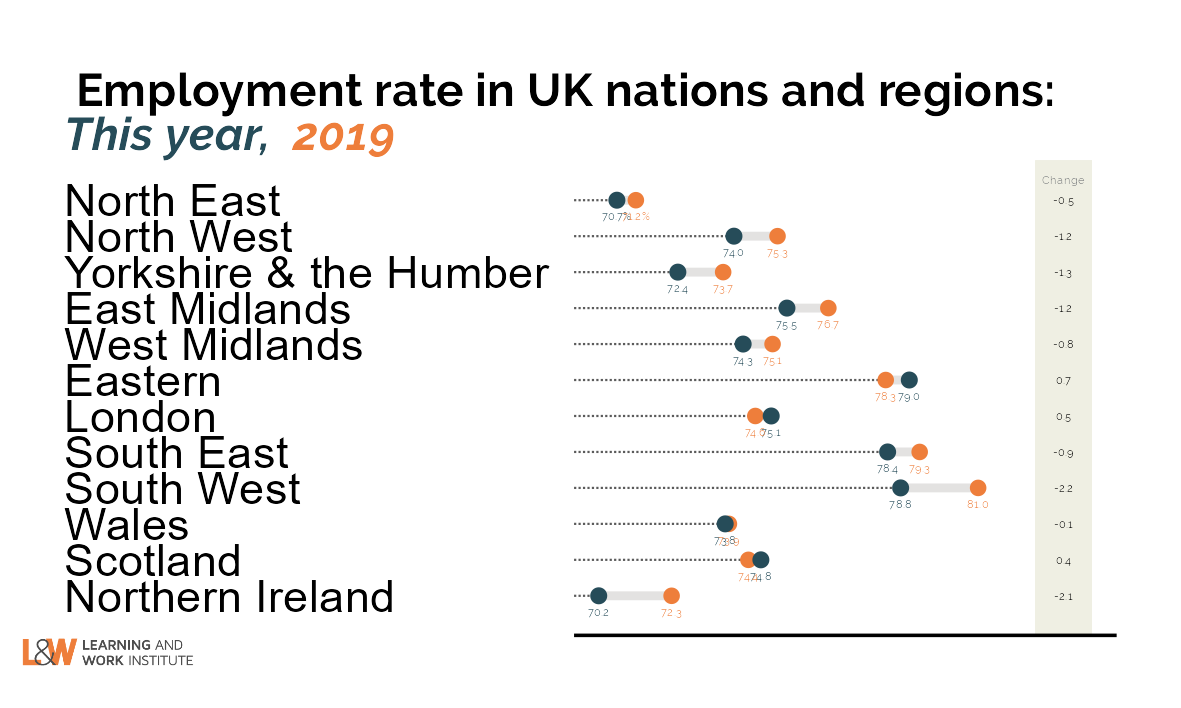 |
|
Chart 19: Unemployment rate two-year change in regions – July to September 2021
Compared with 2019, eight regions showed a rise in the unemployment rate, led by Northern Ireland and London. The unemployment rate fell in three regions, the North East, the East Midlands and Wales. 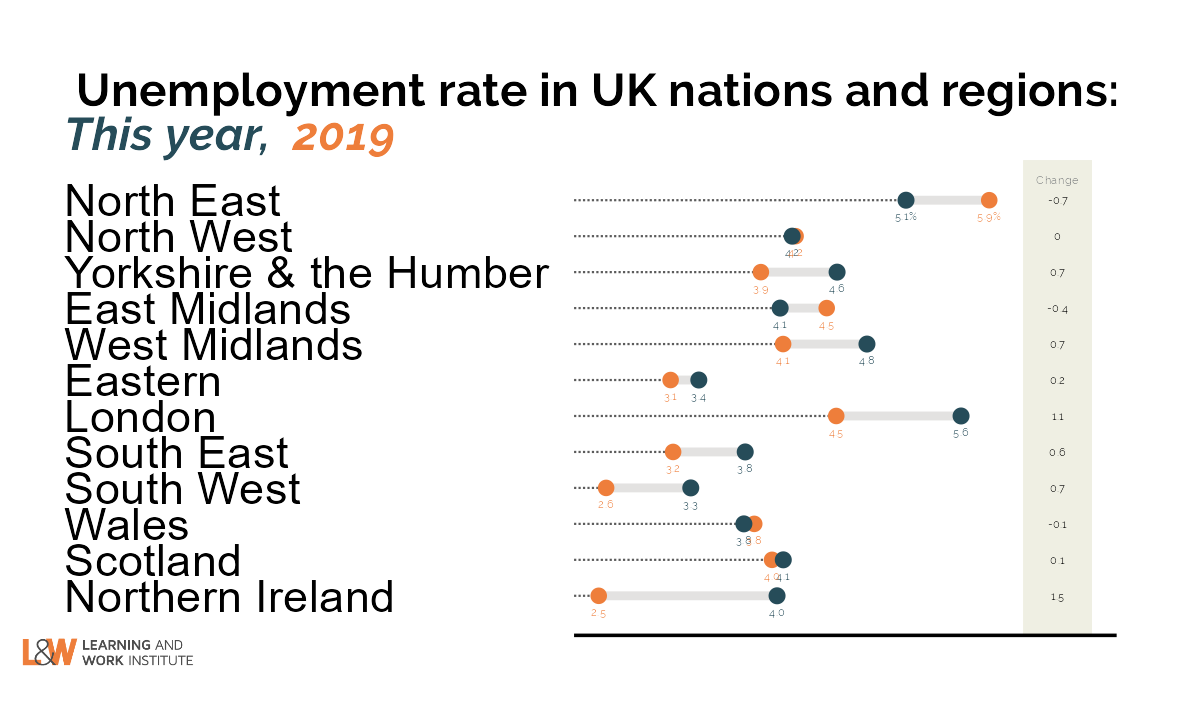 |
|
Chart 20: Inactivity rate two-year change in regions – July to September 2021
Compared with 2019, nine regions showed a rise in the inactivity rate, led by the South West and the East Midlands. The inactivity rate fell in three regions, led by London. 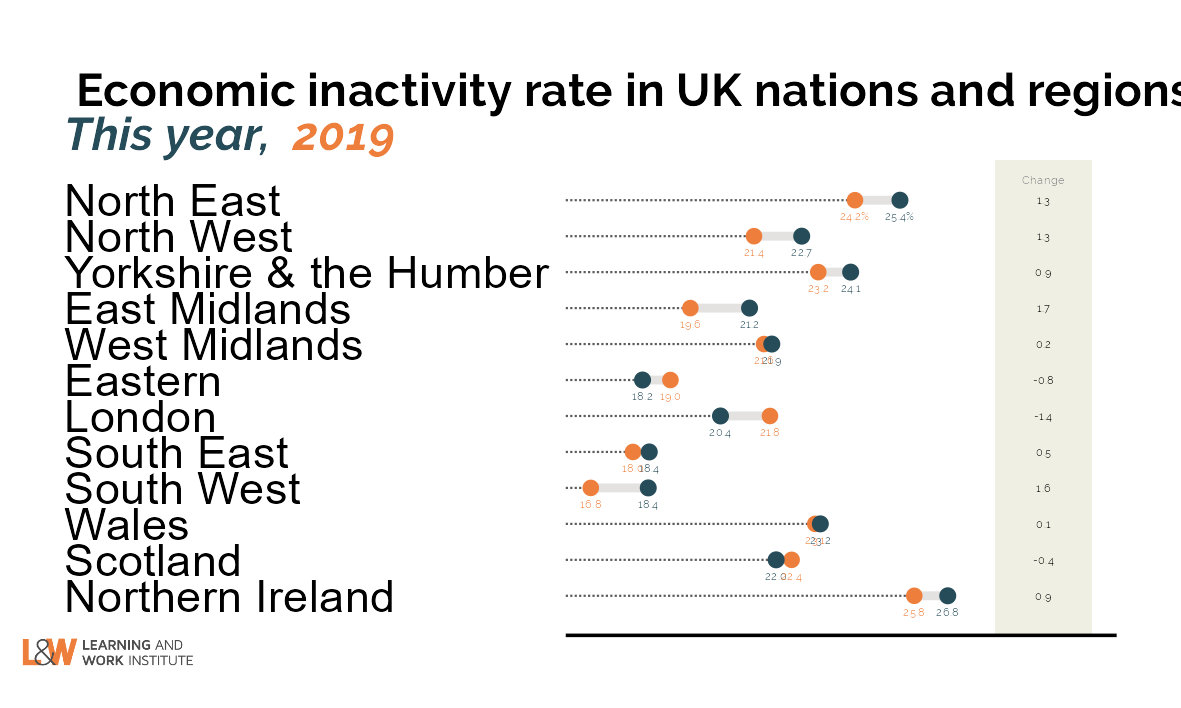 --> --> |
|
This newsletter is produced by Learning and Work Institute and keeps readers up to date on a wide range of learning and work issues.
If you have any questions, contact Paul Bivand
© 2020 Learning and Work Institute. All rights reserved. To subscribe click here
|
 |