 |
|
| Making learning and work count Labour market LIVE from Learning and Work Institute 10 November 2020
Learning and Work Institute comment |
|
| Chart 1: Jobseeker’s Allowance and Universal Credit claimant count The ONS headline Jobseeker’s Allowance and Universal Credit claimant count has fallen by 29,800 in October, taking the total to 2,633,700. ONS' claimant count before seasonal adjustment has fallen by 42,900 to 2,618,300. This change is directly comparable to the local level claimant count changes published today. 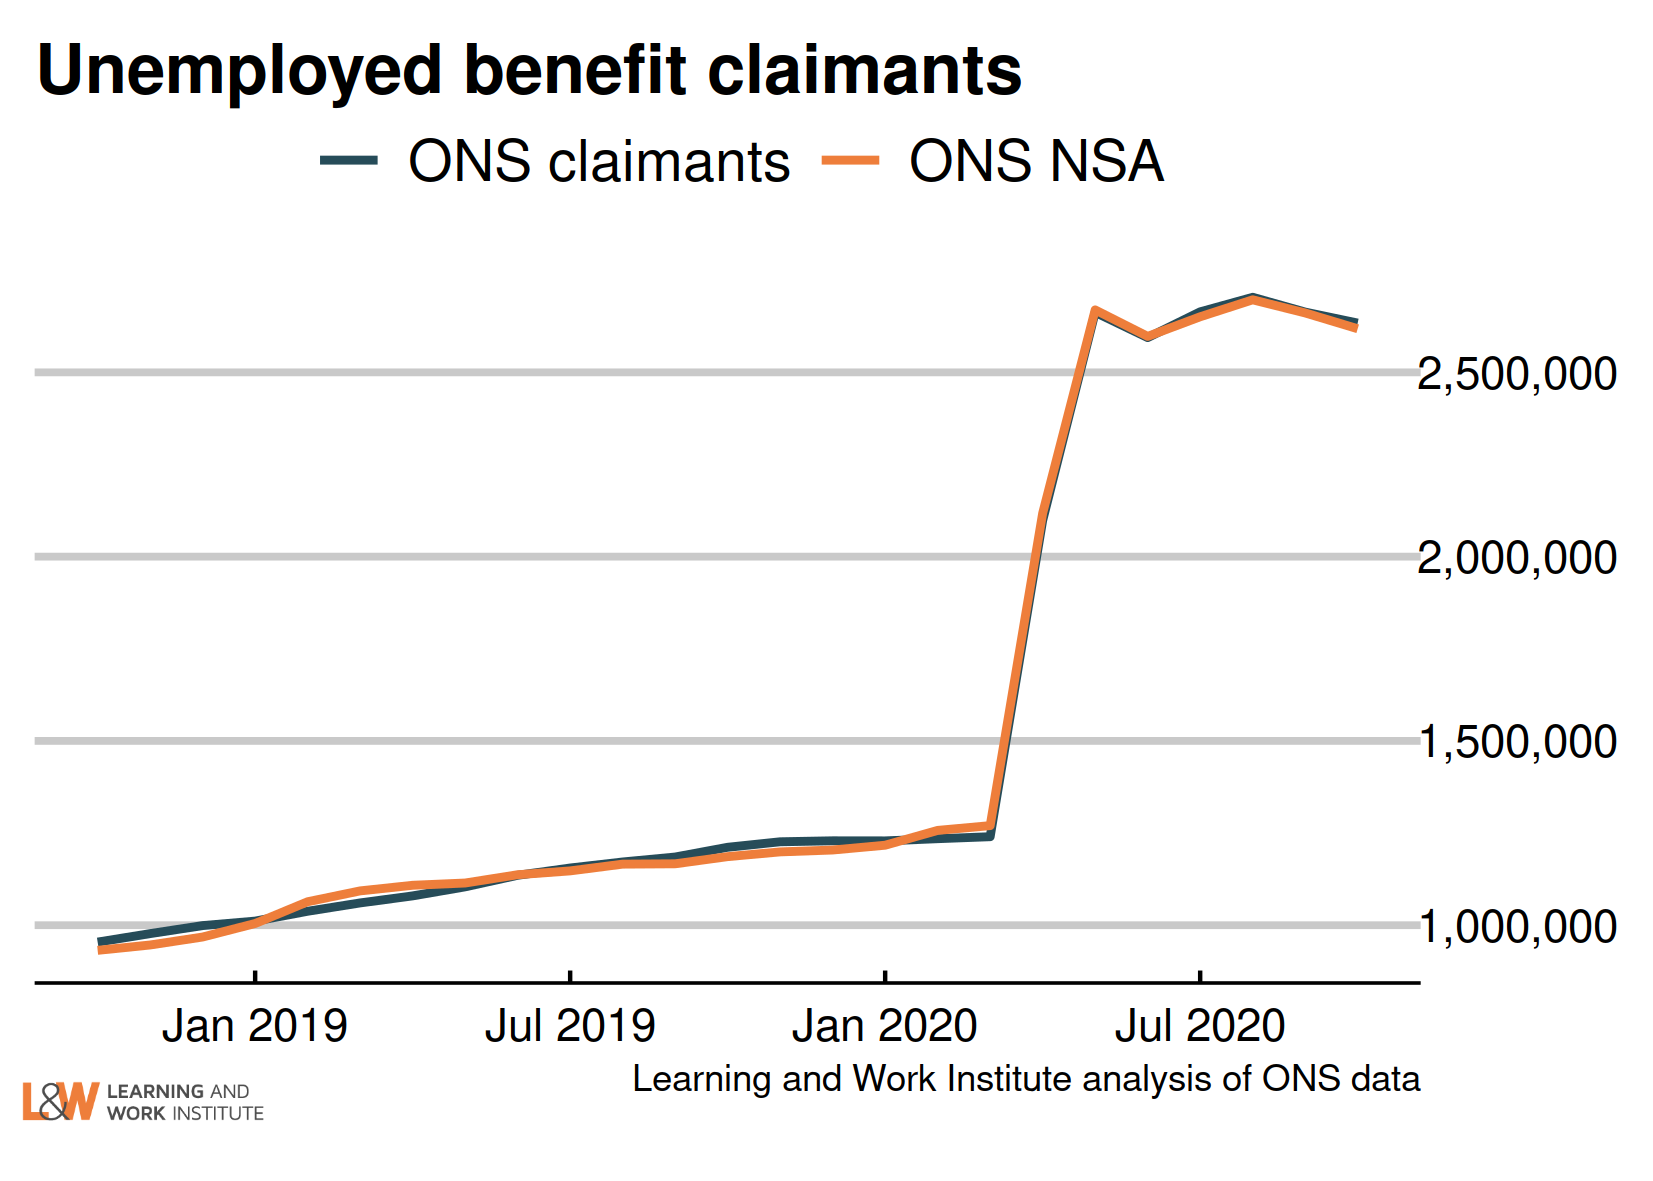 |
|
| Chart 2: UK unemployment (ILO) - the official estimate The latest unemployment figure is 1,624,000. It has risen by 101,000 from the figure published last month. The unemployment rate was up by 0.3 percentage points to 4.8%. 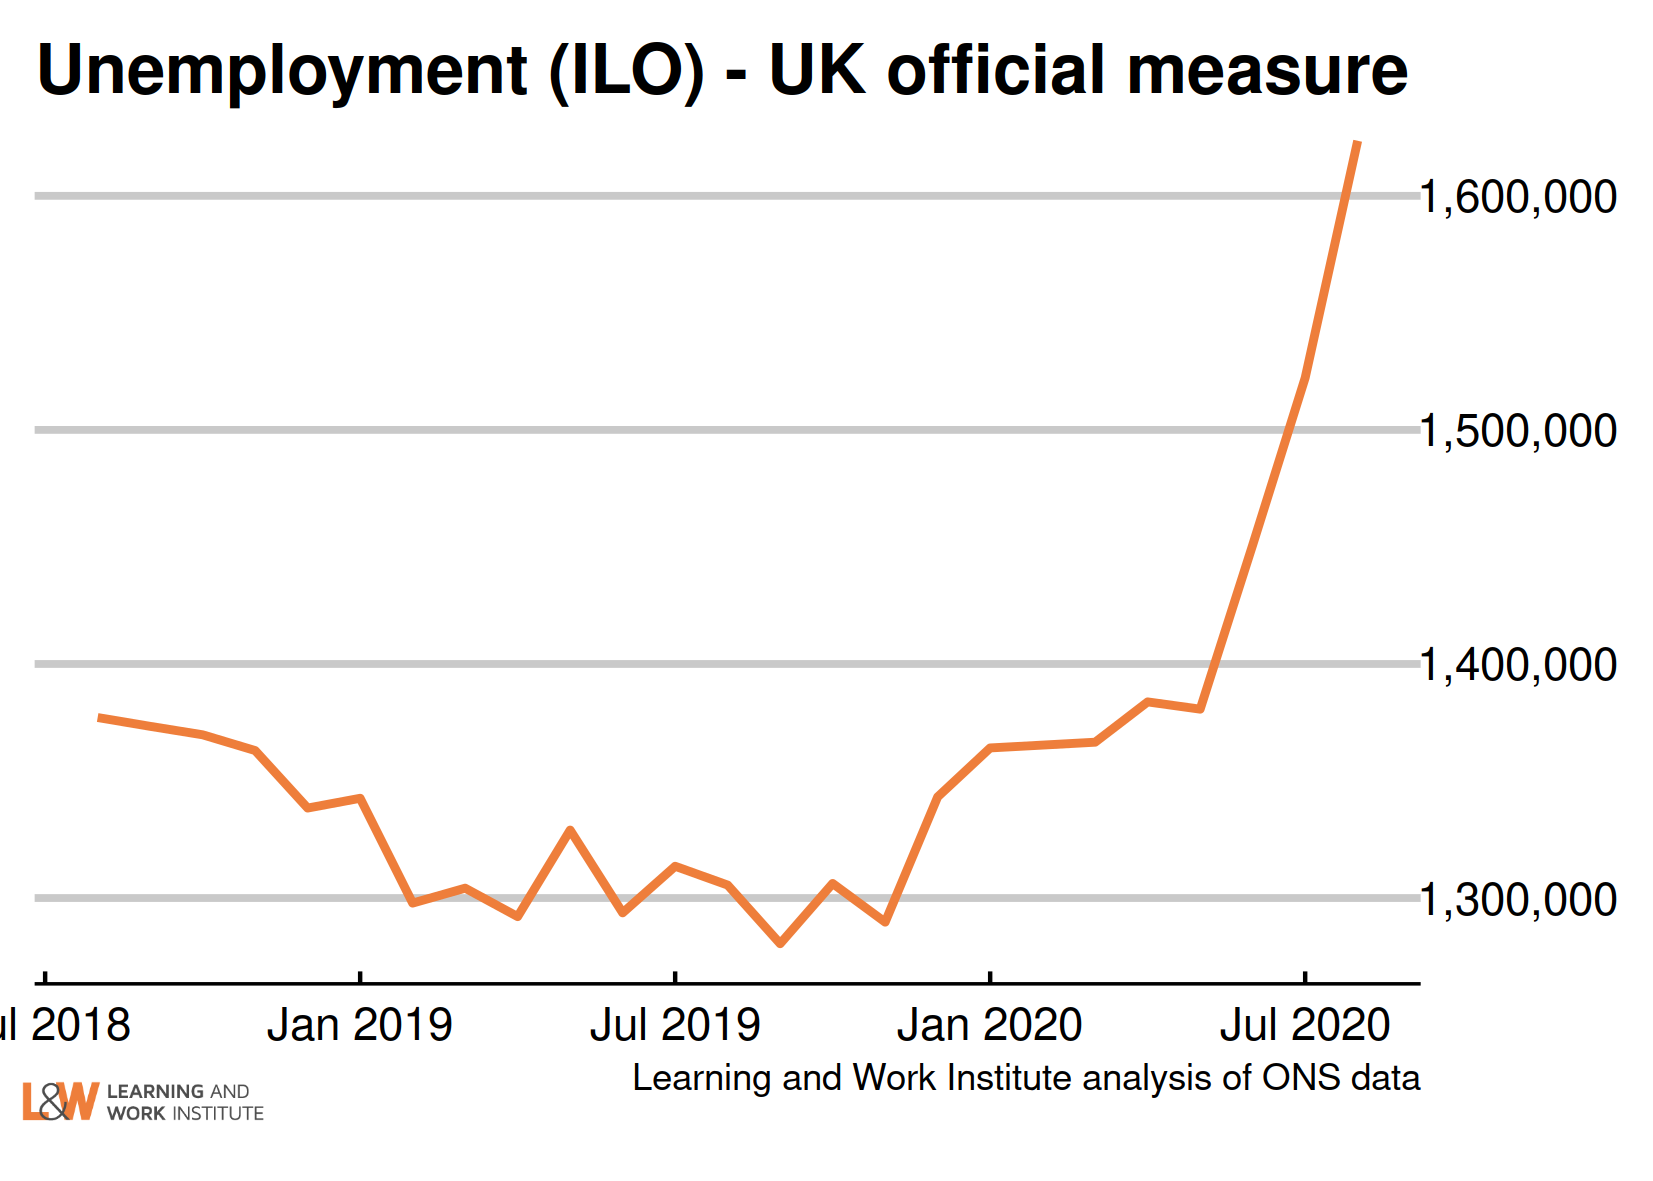 |
|
| Chart 3: Youth unemployment The number of unemployed young people has risen by 21,000 since last month’s figures, to 602,000. Meanwhile, the number of young Universal Credit or Jobseeker’s Allowance claimants fell last month by 2,800, to 516,100. There are now 125,000 more young claimants of Universal Credit or Jobseeker's Allowance than the number of unemployed young people who are not in education. 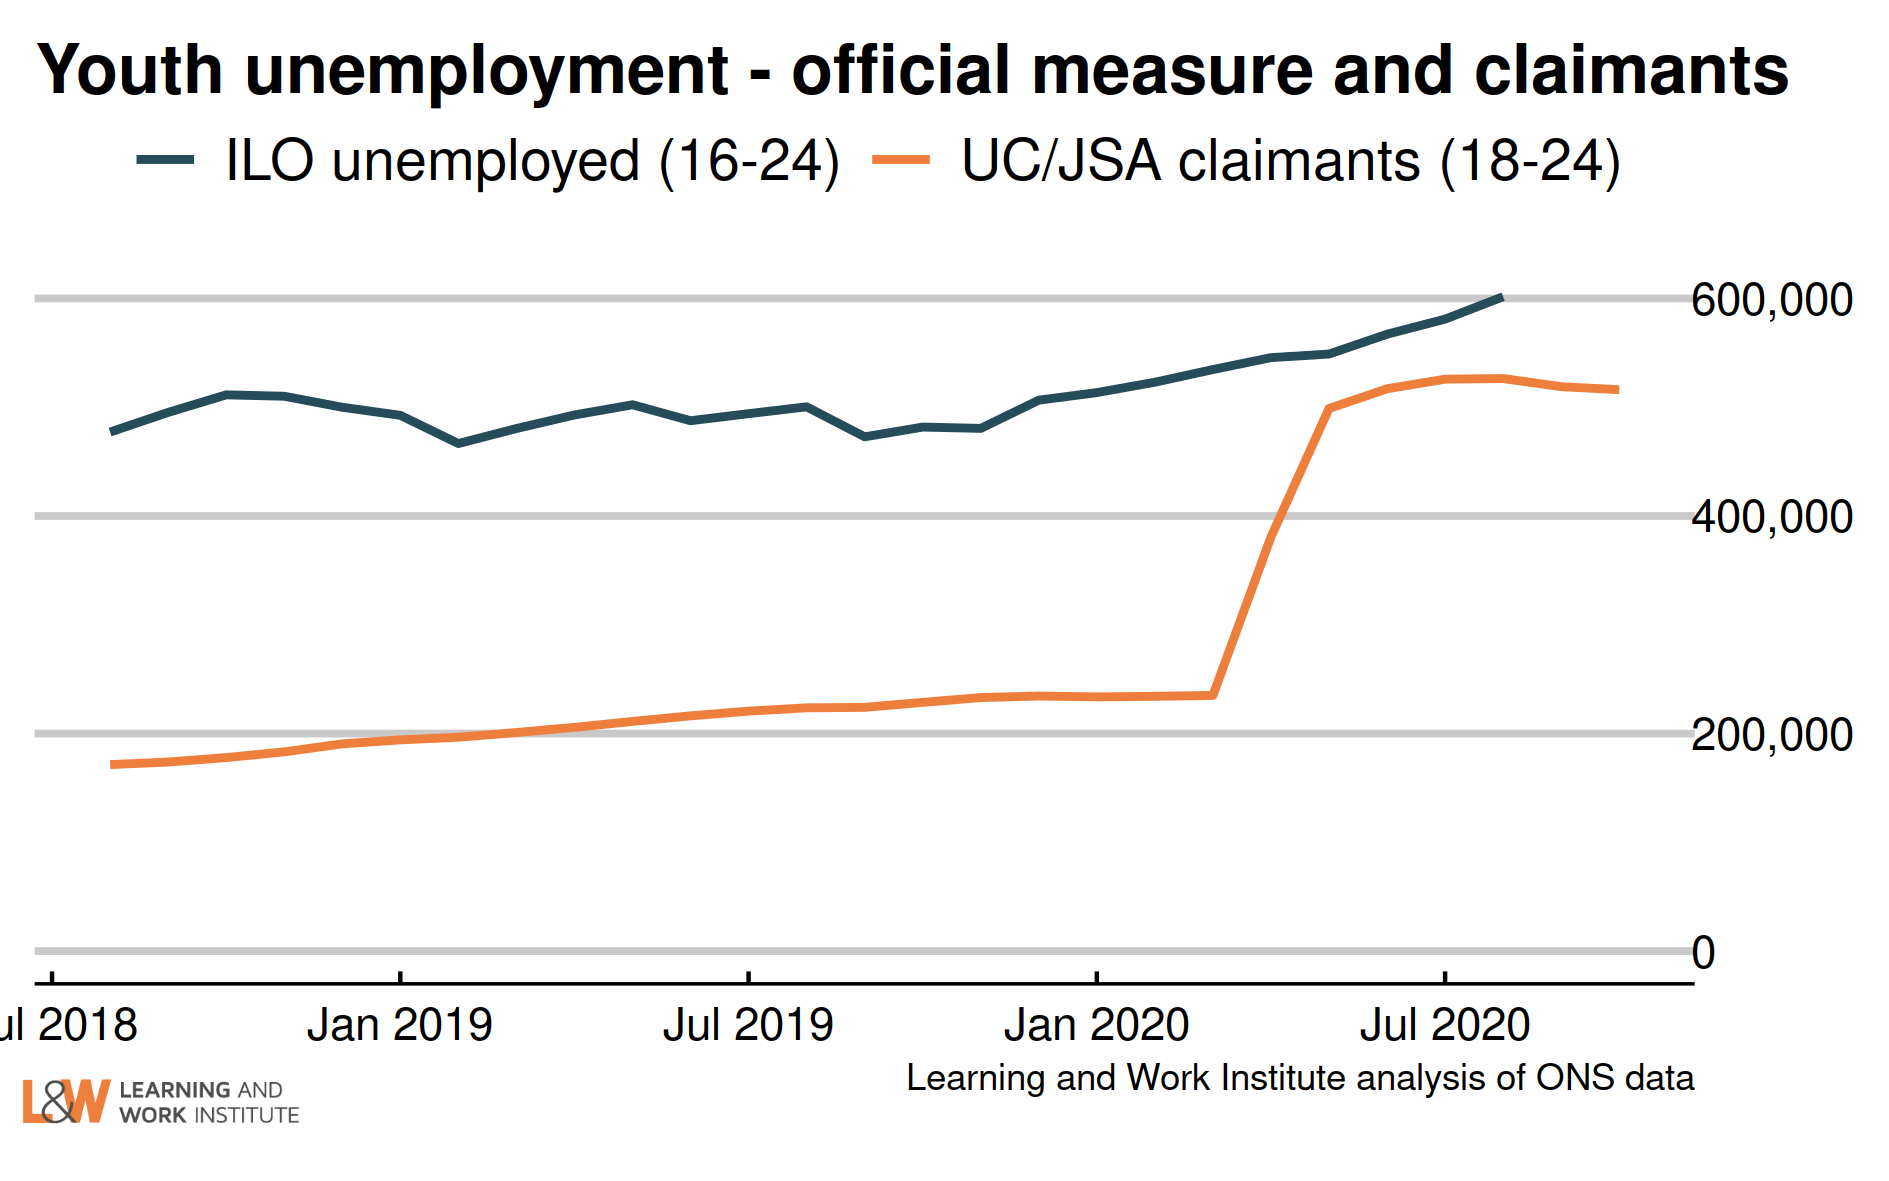 |
|
| Chart 4: Young people not in employment, full-time education or training The number of out of work young people who are not in full-time education (969,000) has fallen in the past quarter by 101,000 , or 9.4%. The fall was entirely among the inactive, as the number of unemployed young people not in full-time education or training rose. The reason for this fall is that there has been a strong rise in full-time education participation. Over the last quarter this has risen by 271,000, nearly three times the fall in the number not in full-time education and out of work. 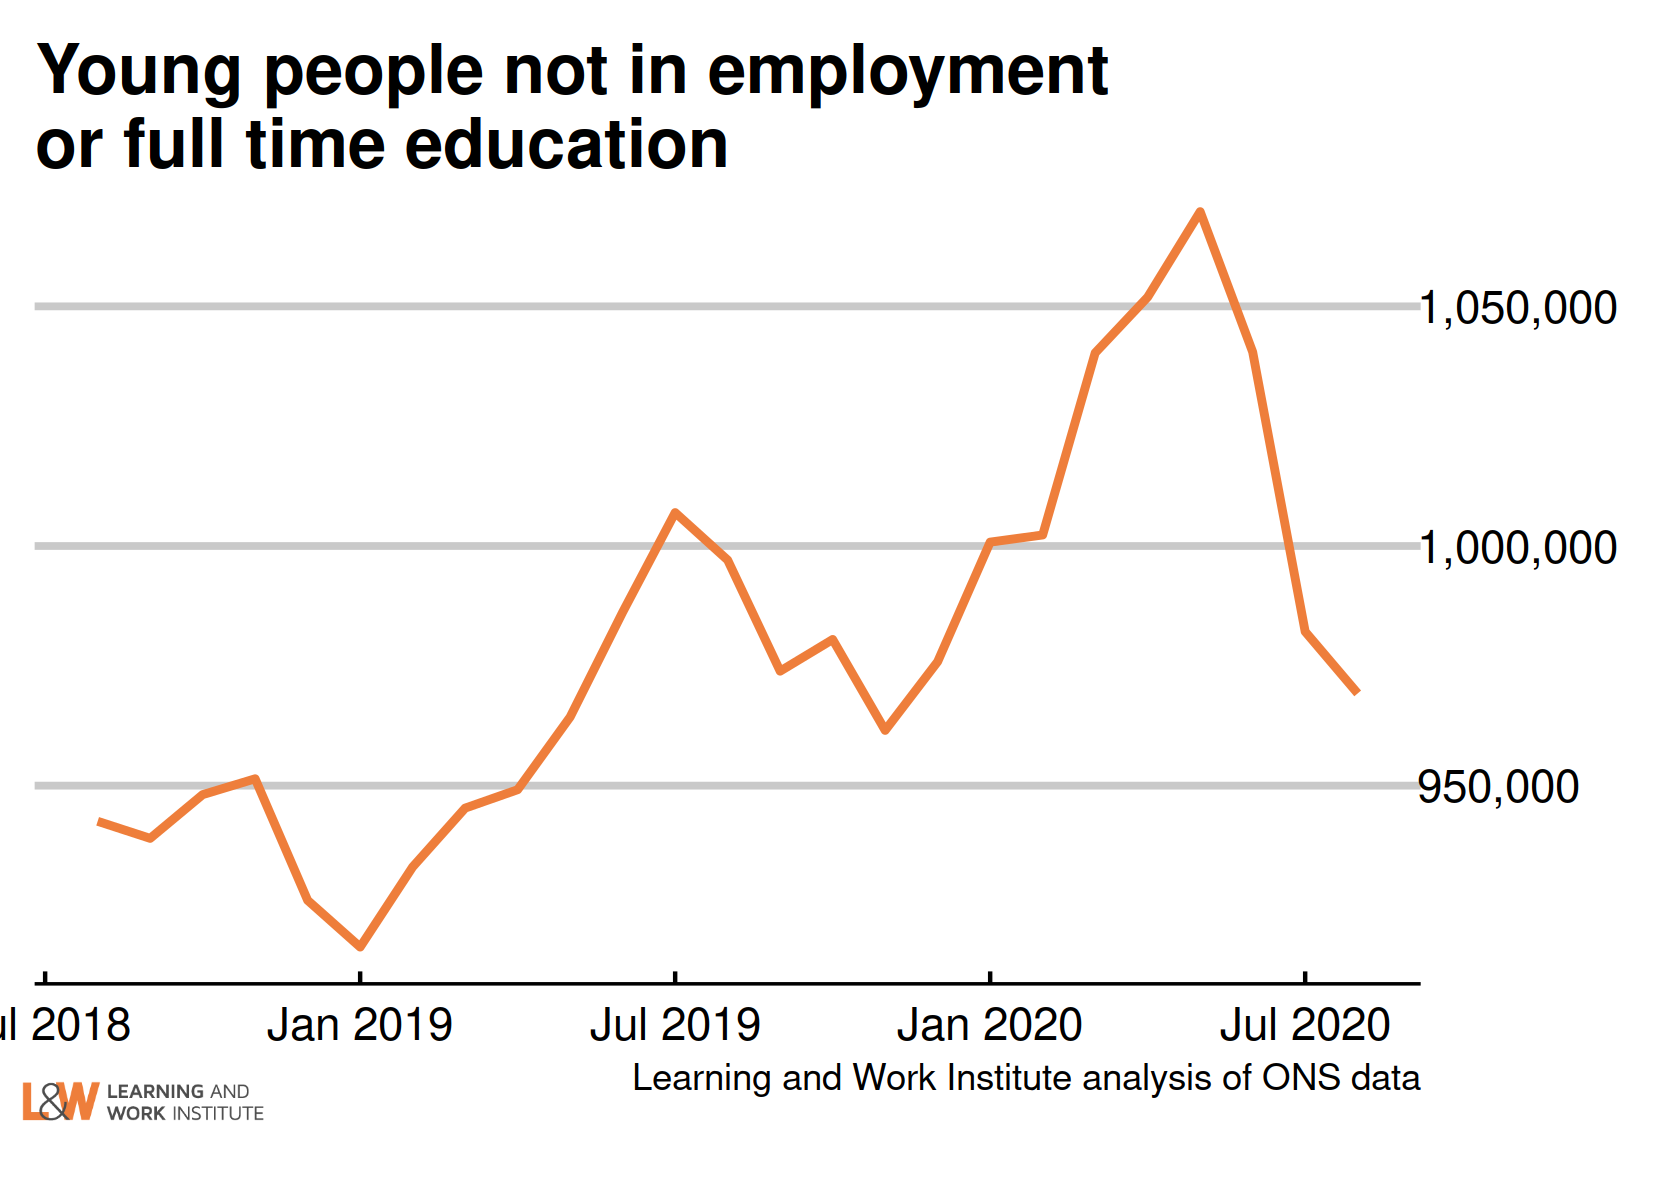 |
|
| Chart 5: Vacancies – whole economy survey Headline vacancies recovered very slightly this month, to 525,000. The ONS' experimental single-month vacancy figures shows a more substantial recovery from 327,000 in May, to 623,000 in October. The headline ONS vacancy figure is both seasonally adjusted and a three-month average. The chart shows both series. 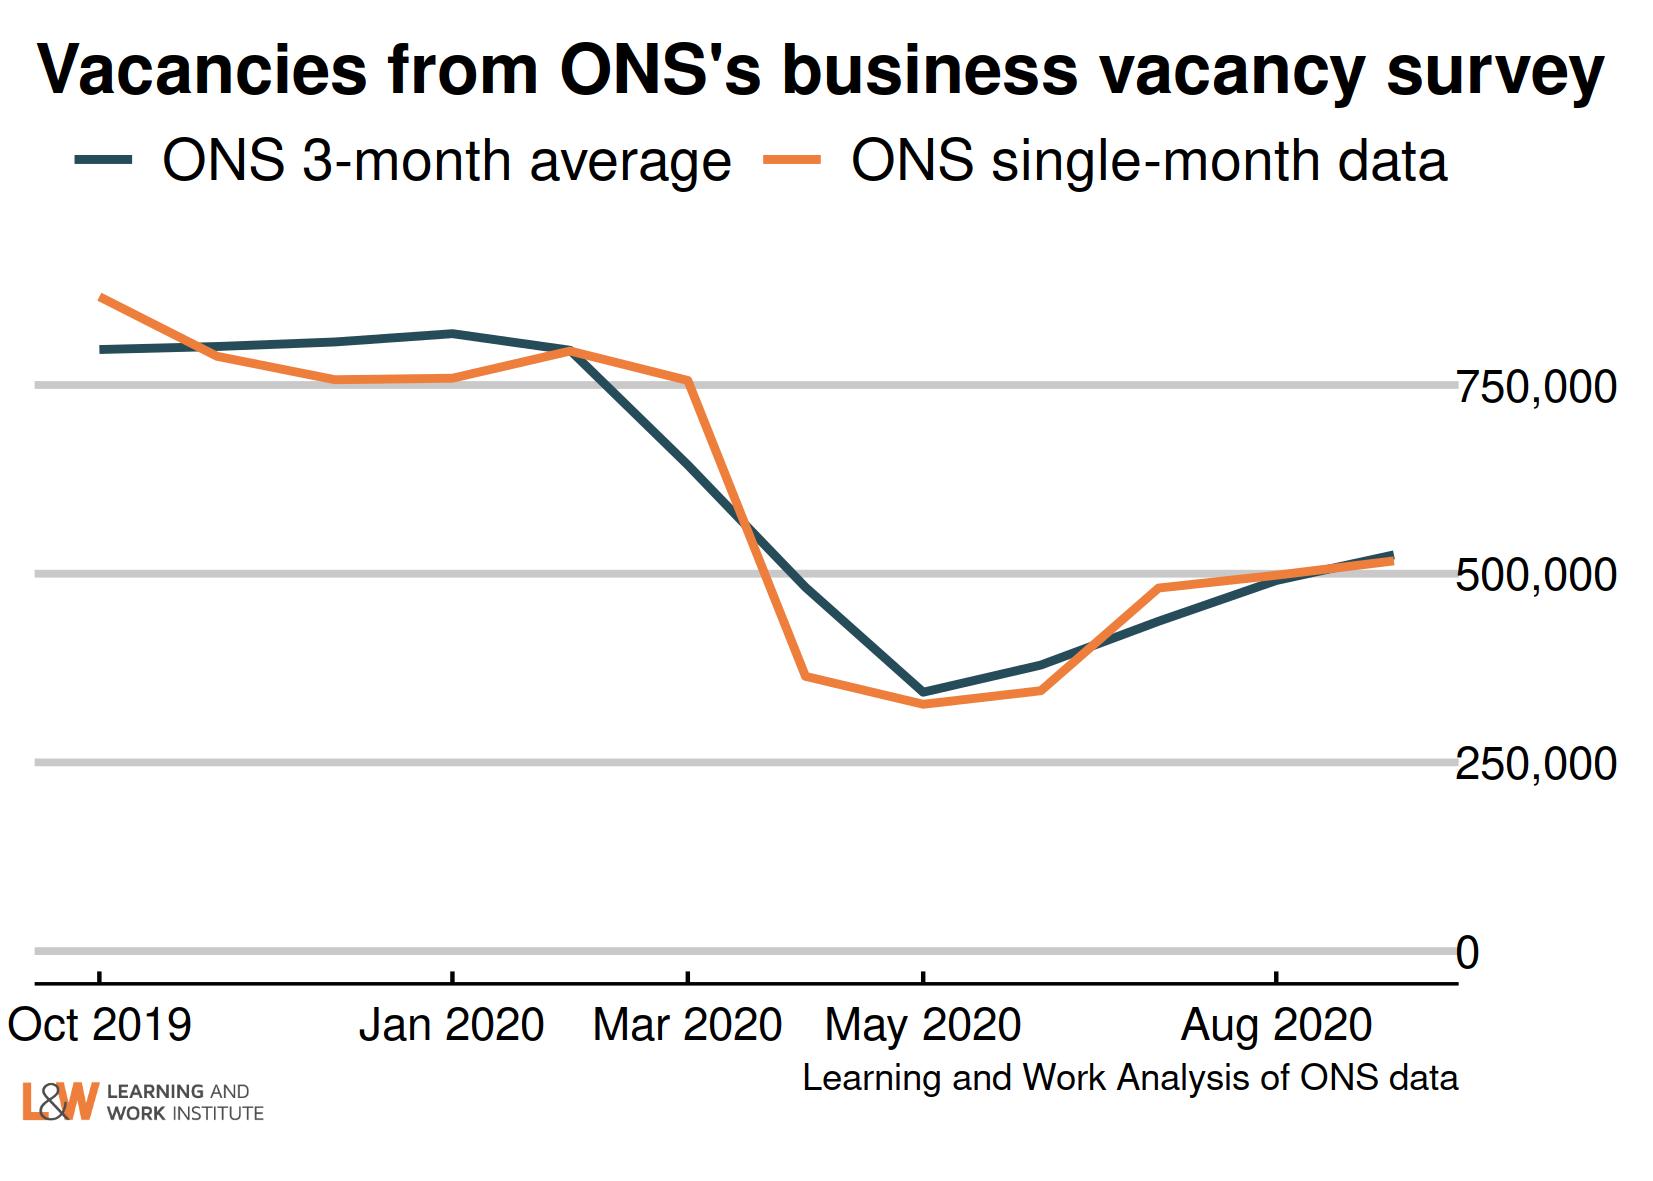 |
|
| Chart 6: Experimental single month vacancies – whole economy survey The Office for National Statistics experimental single month vacancy estimates include sectoral information. As these are not seasonally adjusted, it is better to look at annual changes. The numbers are thousands of vacancies, under each number, and on the right, the annual change in thousands of vacancies. 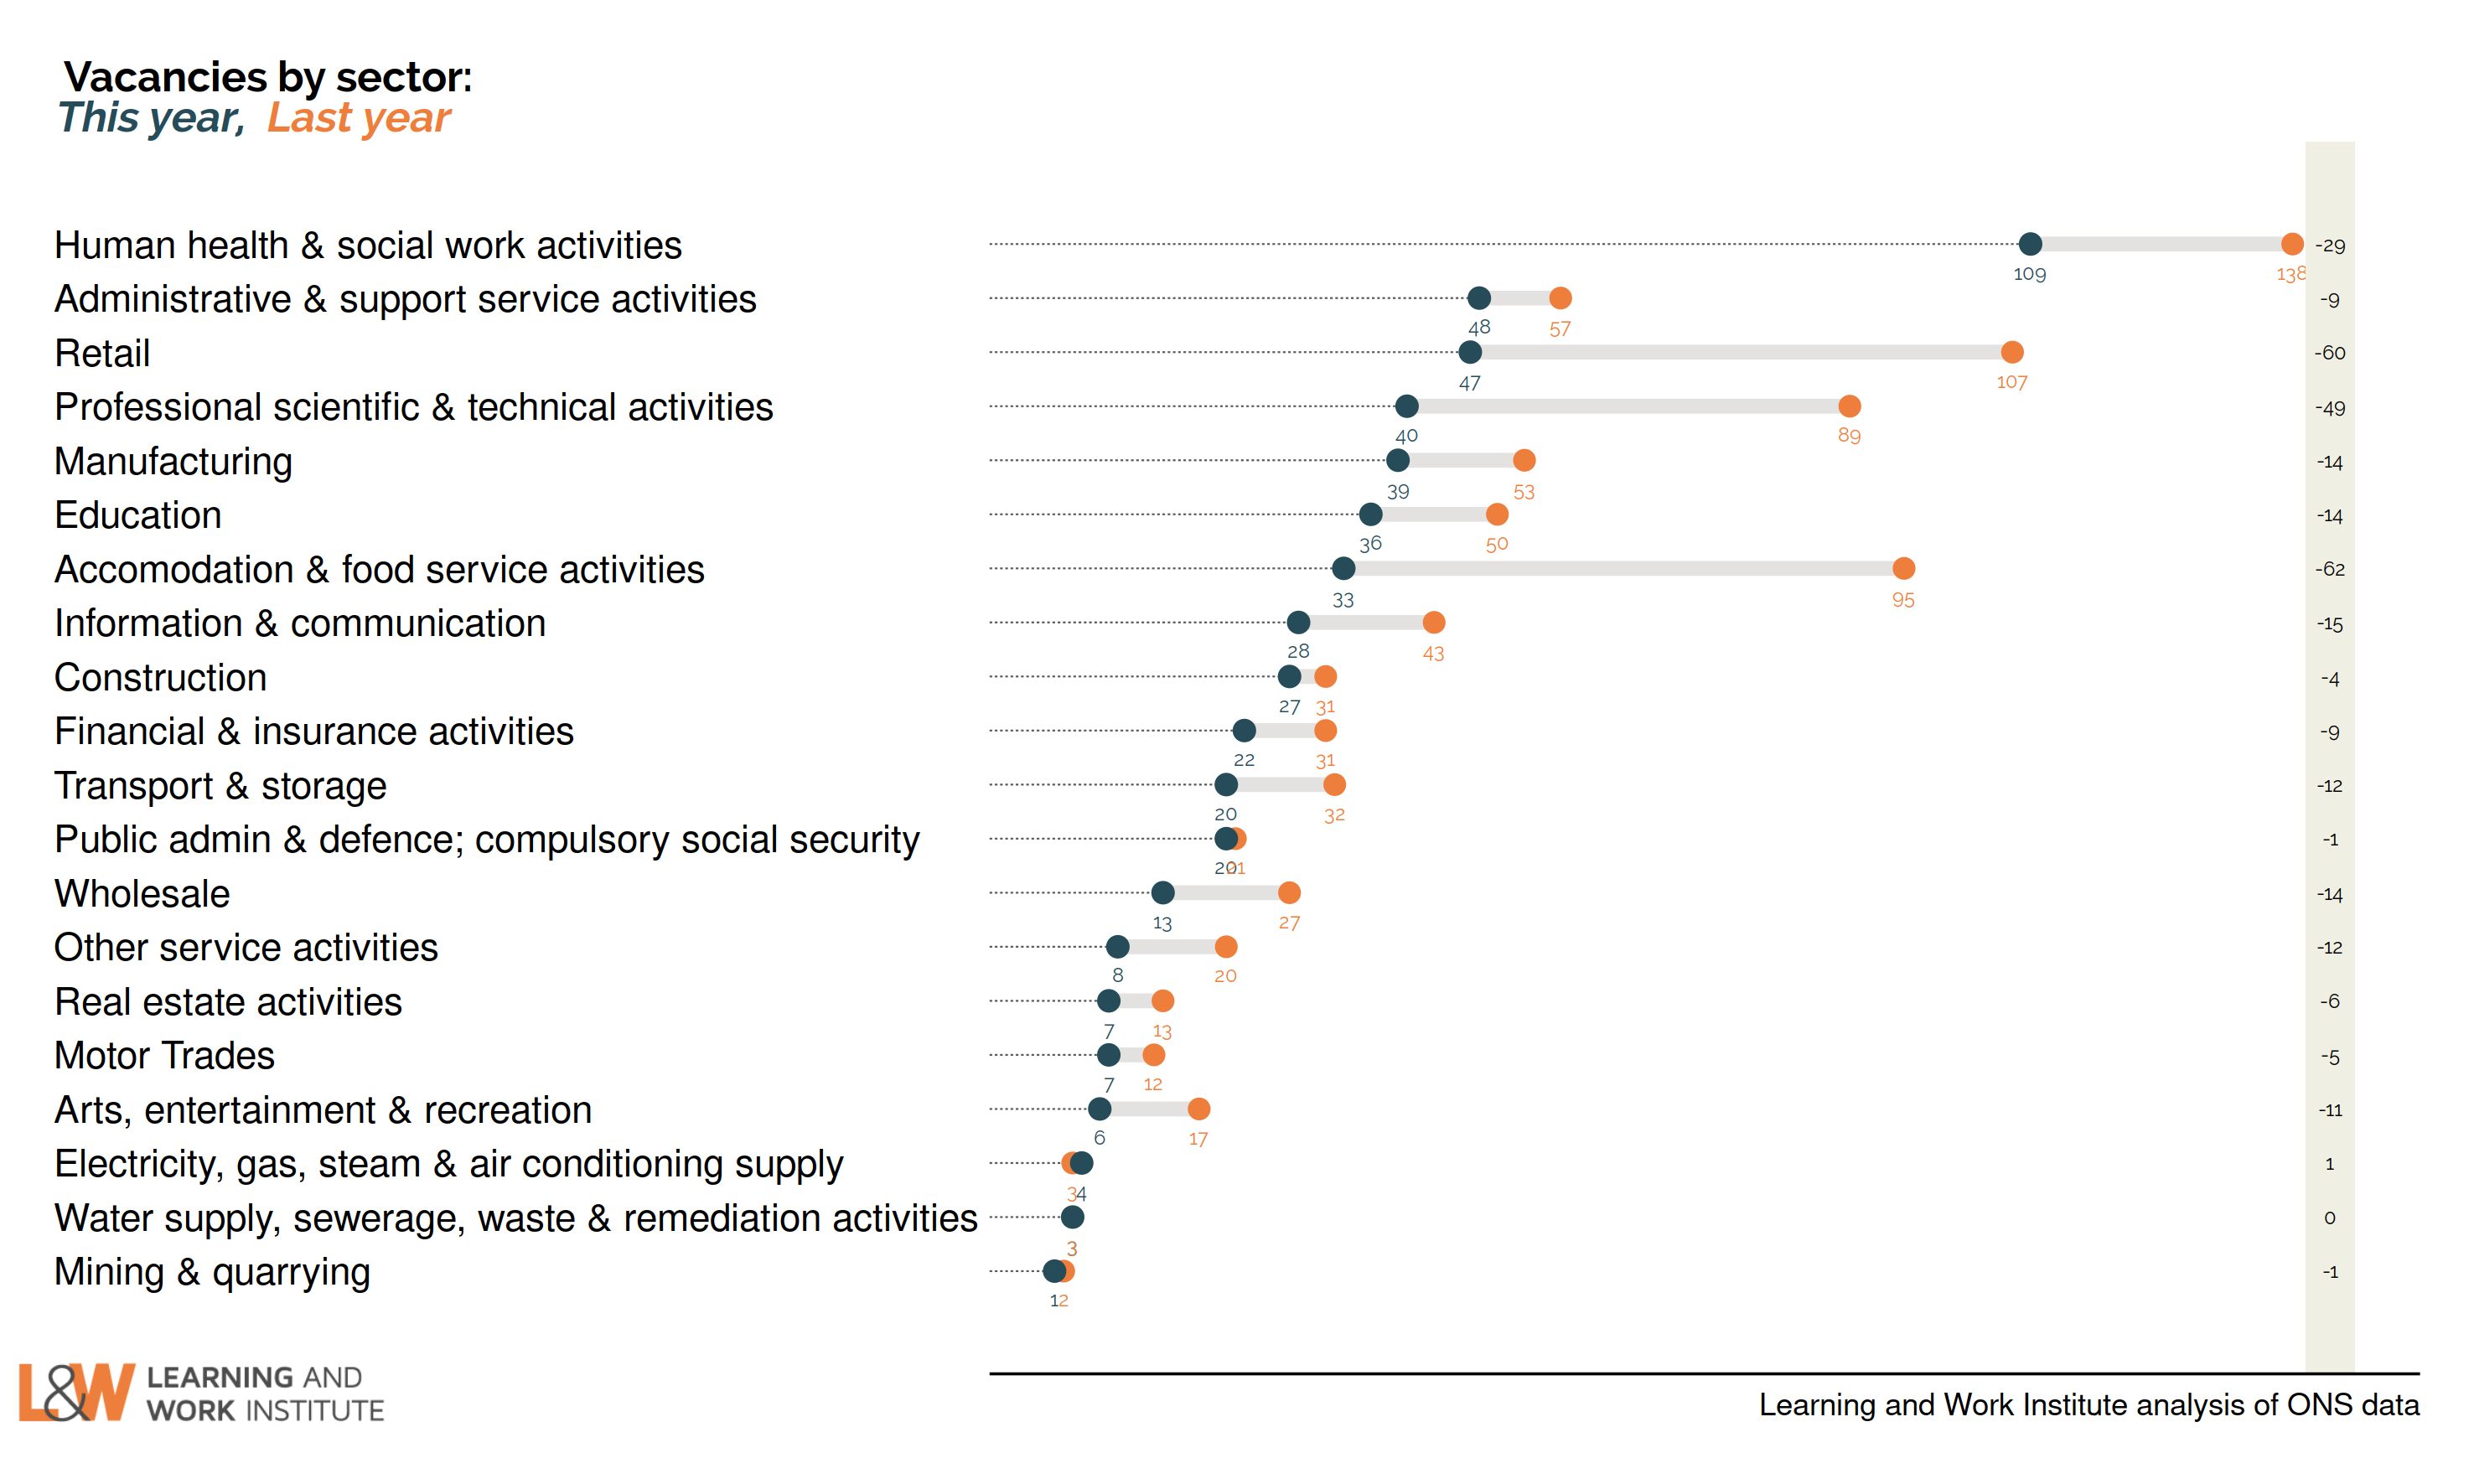 |
|
| Chart 7: Unemployed people per vacancy There are 3.3 unemployed people per vacancy. This has fallen back as the number of vacancies has risen, despite increasing numbers of unemployed. 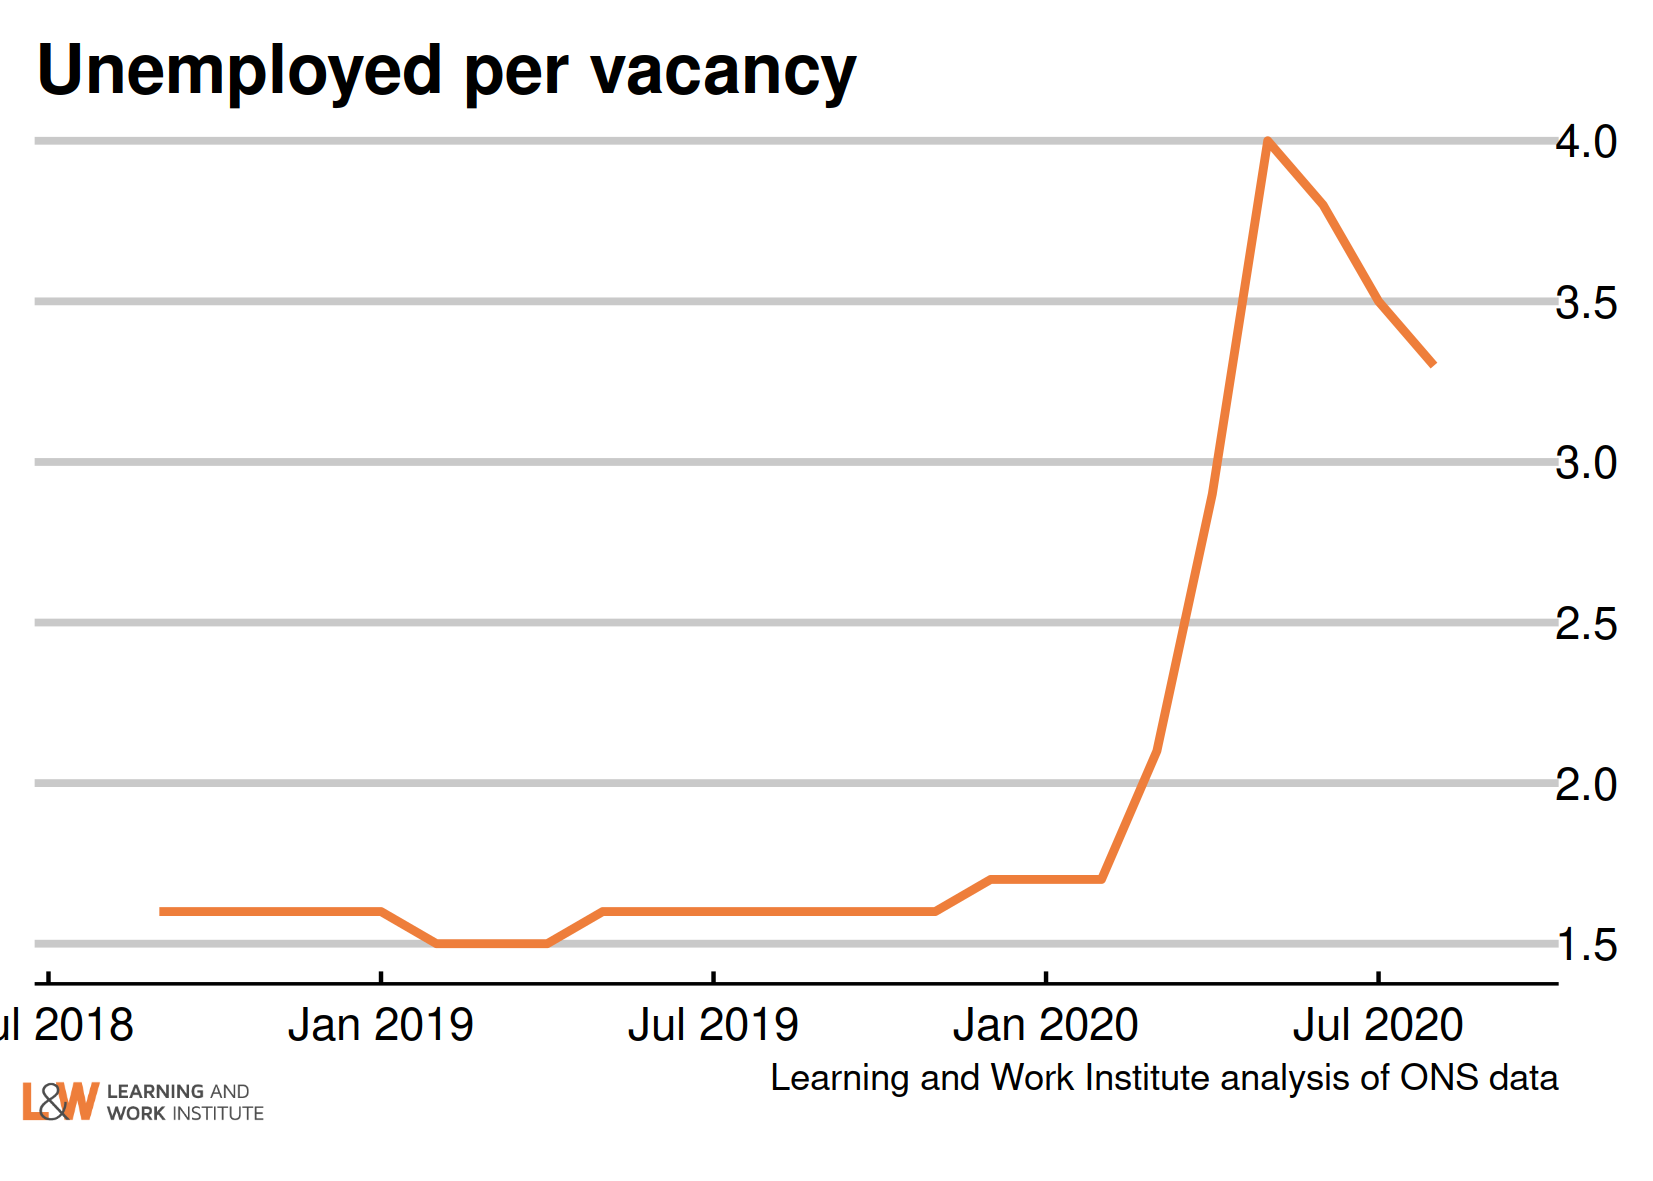 |
|
| Chart 8: Online vacancies to the end of October from Adzuna Job vacancies dropped to below half of the 2019 average following lockdown. ONS analysis suggests that it was this reduced hiring that led to falls in employment, rather than increased job loss. There had been a gradual increase as the lockdown had eased, but the number of vacancies at the start of November was just 70% of pre-crisis levels. 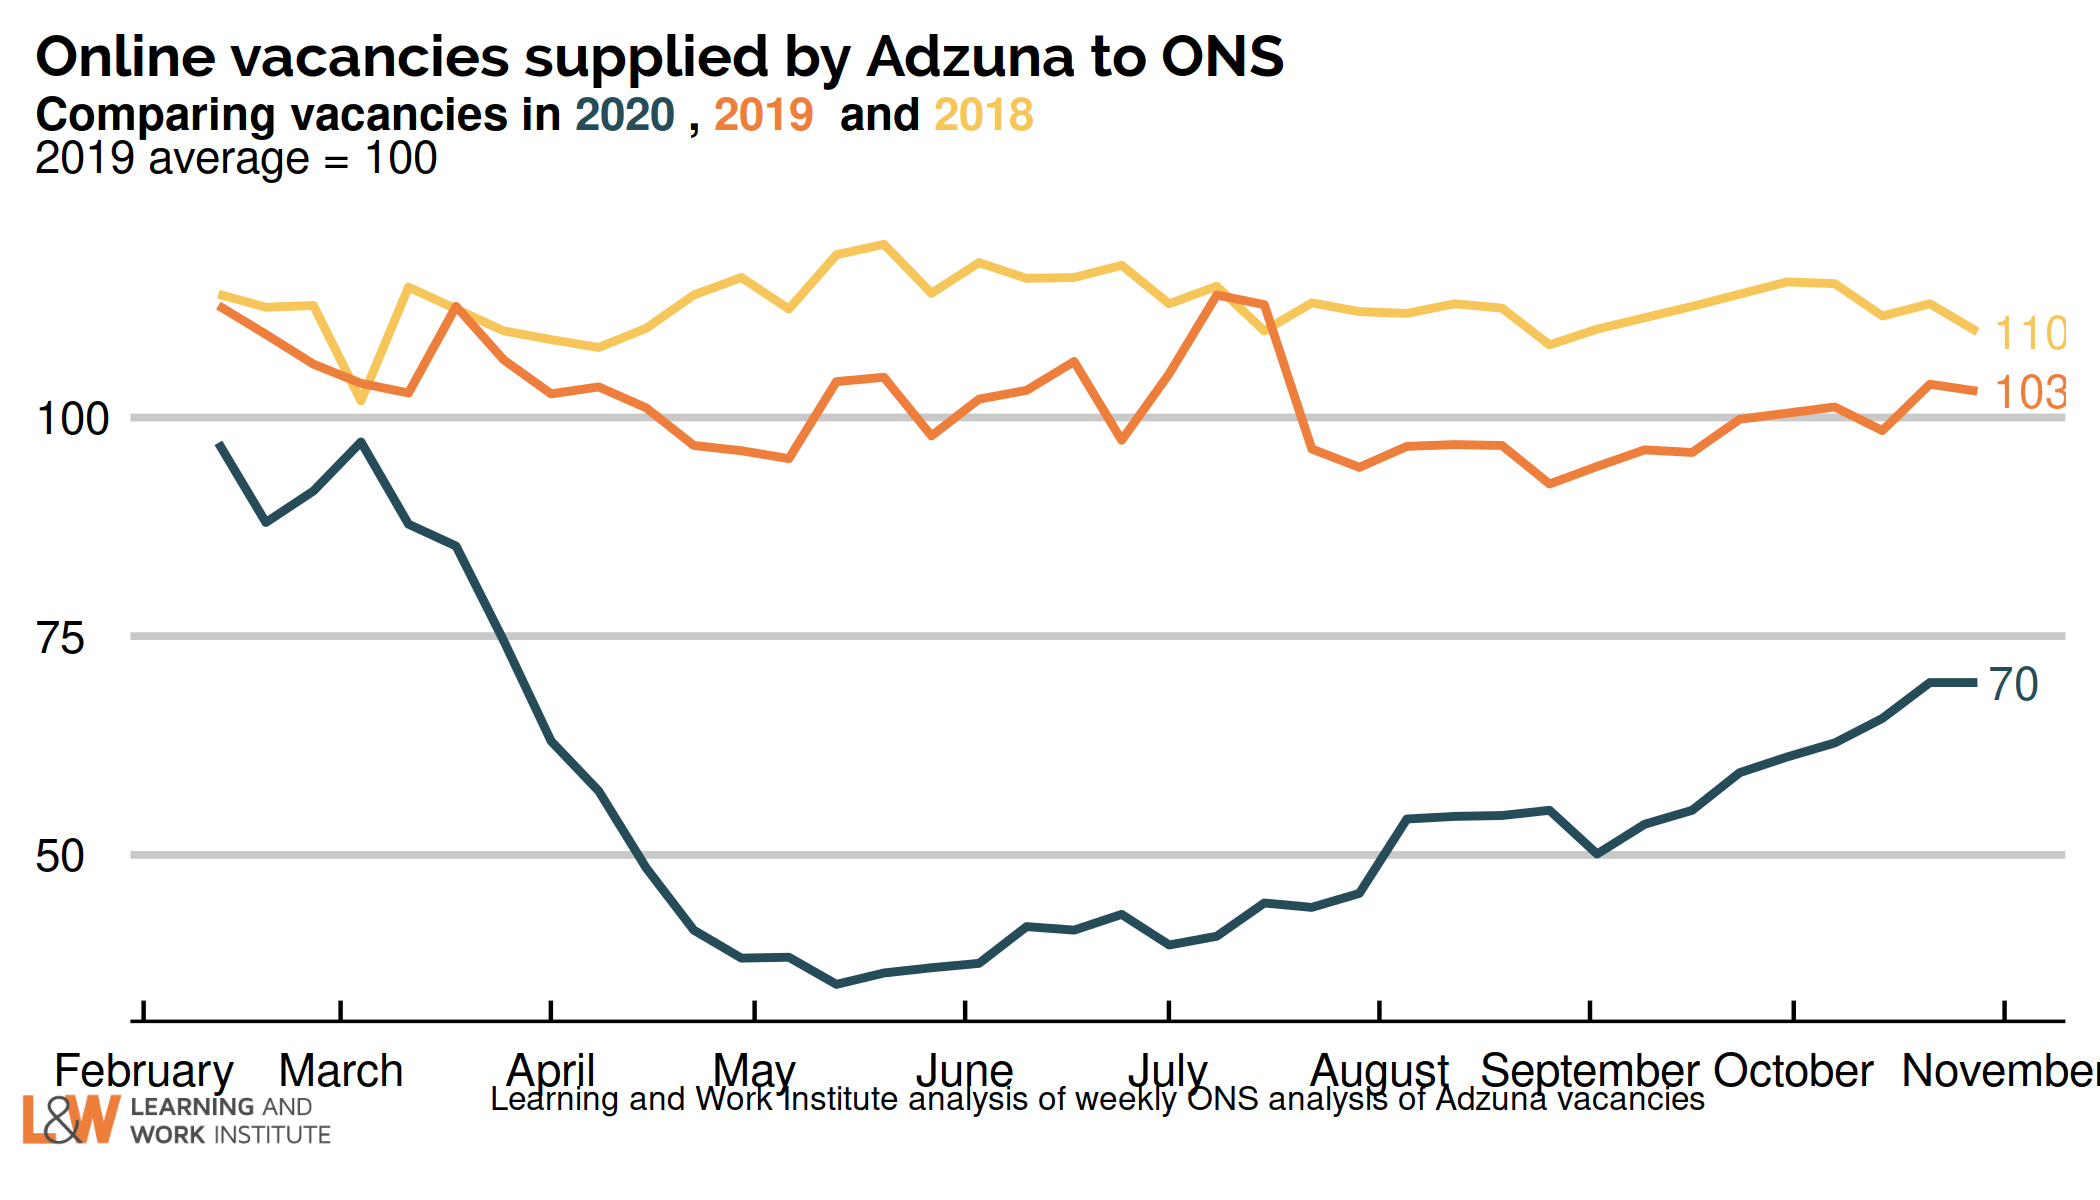 |
|
| Chart 9: Unemployment rates by age The 18 to 24 year old unemployment rate (including students) is 12.3% of the economically active – excluding one million economically inactive students from the calculation. The rate for those aged 25 to 49 is 2.9%. For those aged 50 and over it is 2.6%. The quarterly change is up 2.1 for 18 to 24 year olds, up 0.5 for 25 to 49 year olds, and up 0.9 for the over-50s. 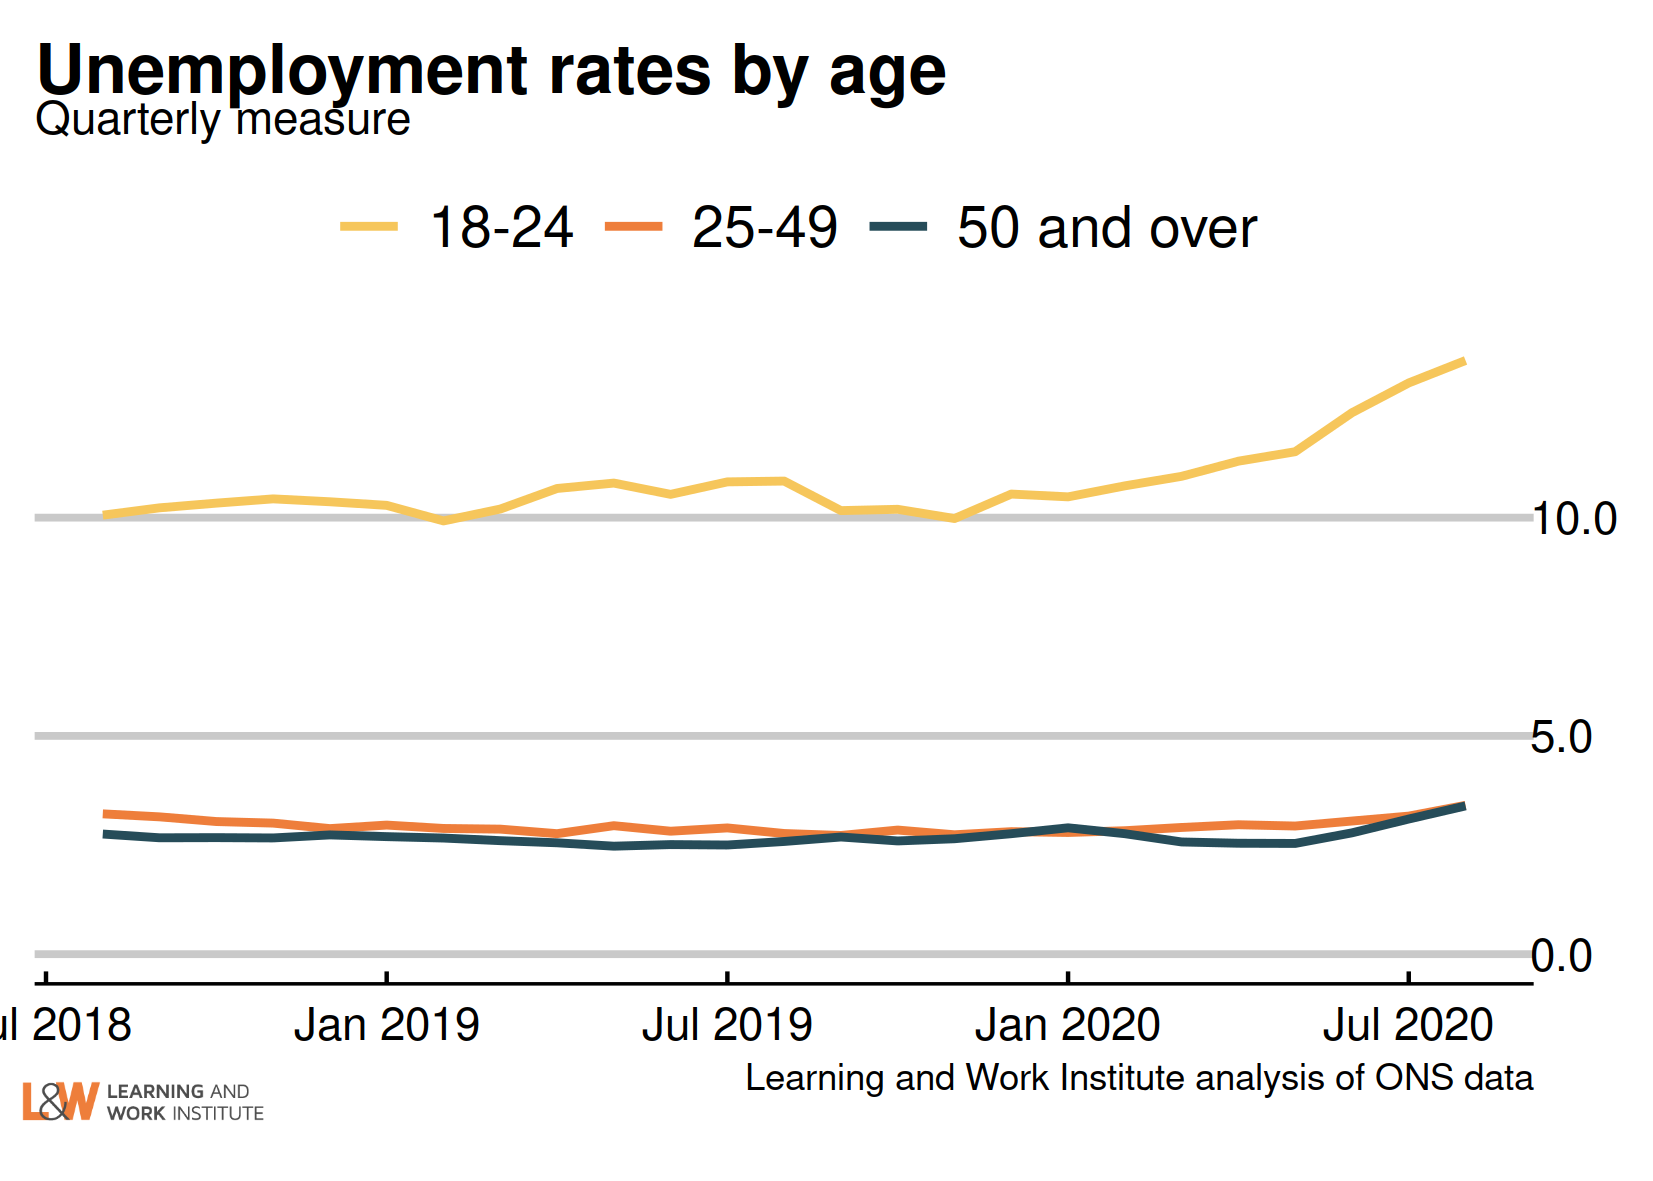 |
|
| Chart 10: UK employment Employment has fallen by 84,000 on the figure published last month, to 32,507,000. 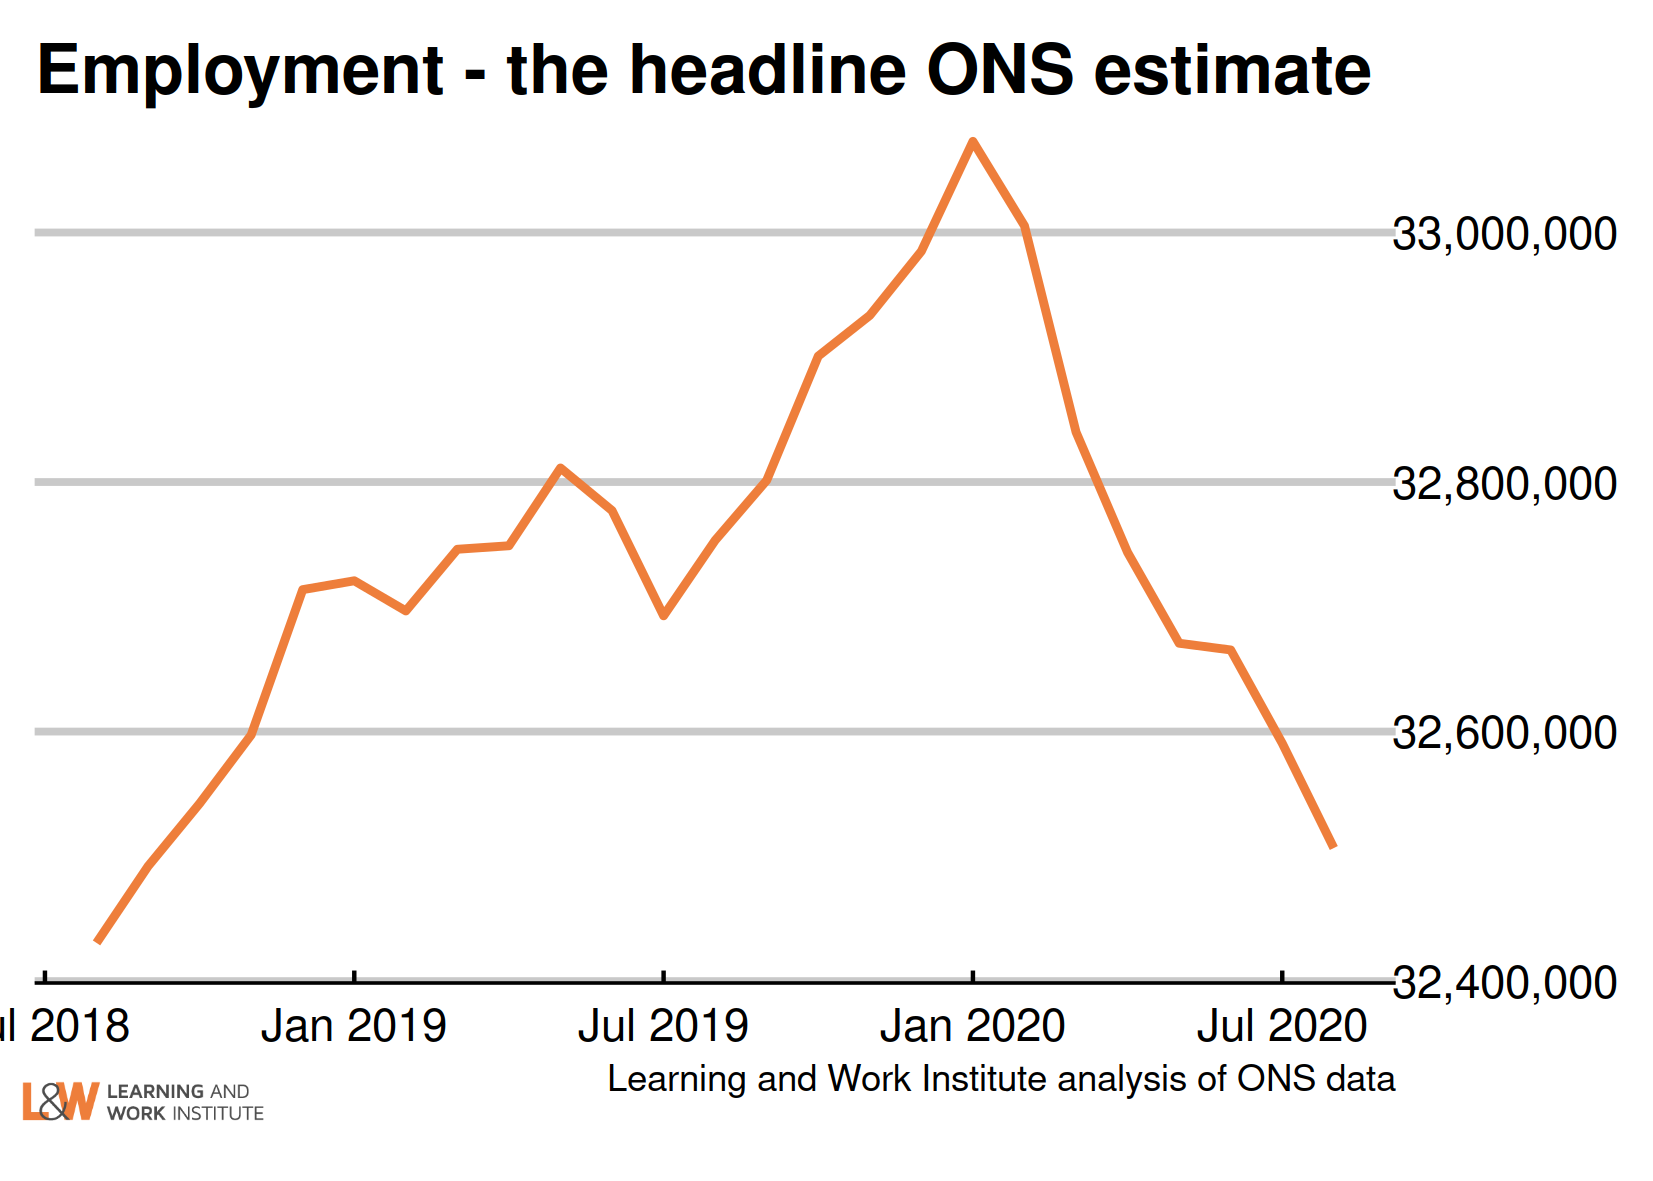 |
|
| Chart 11: Employment rate in the UK The employment rate is down by 0.6 percentage points over the quarter, to 75.3%. 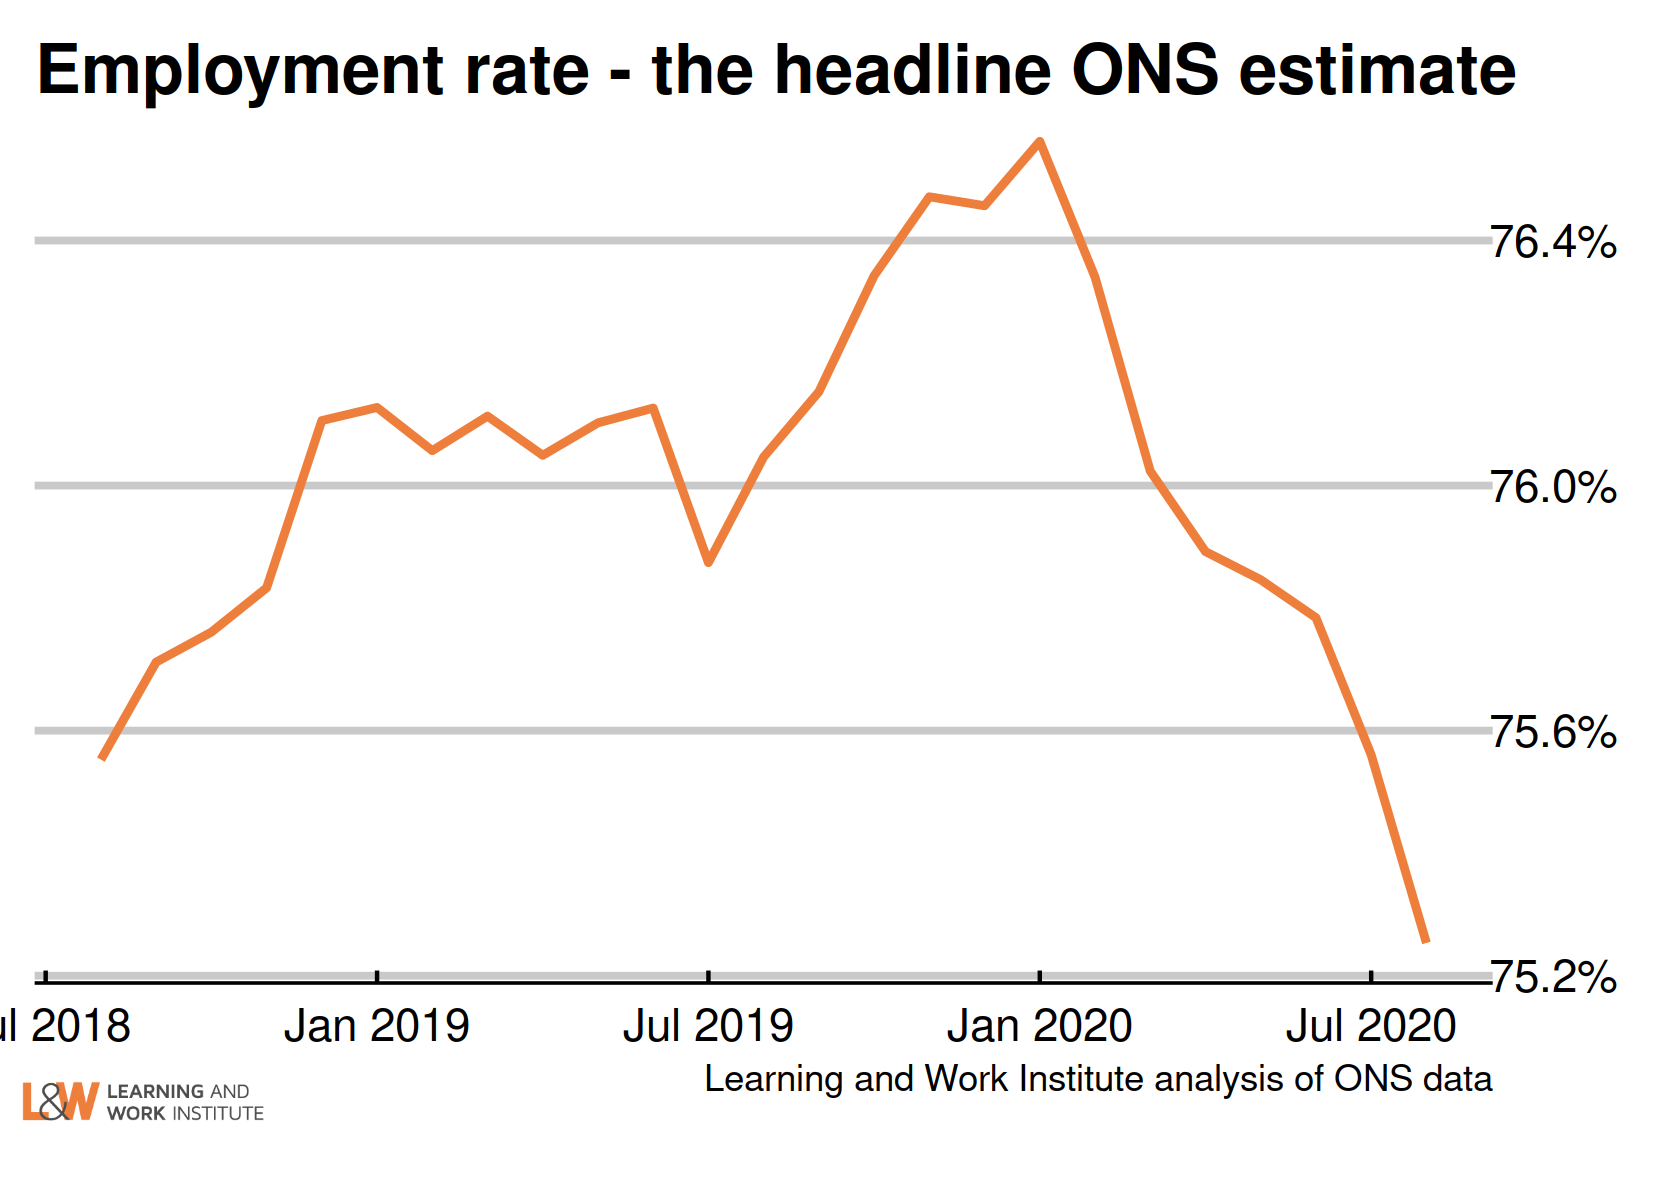 |
|
| Chart 12: Claimants for inactive benefits and the economically inactive – inactivity benefits The number of people inactive owing to long-term sickness rose, while the latest benefit figures (for May 2020) rose. The survey revision has resulted in a reassessment of the recent trend - previous figures had shown a sharp drop in the inactive, long-term sick, which has now been revised into a continuing upwards trend. This chart shows claimants of Employment and Support Allowance, and Universal Credit without work requirements (the orange dots), compared with survey figures for the economically inactive owing to long-term sickness. Survey responses as to the reasons for inactivity may be volatile at the moment. 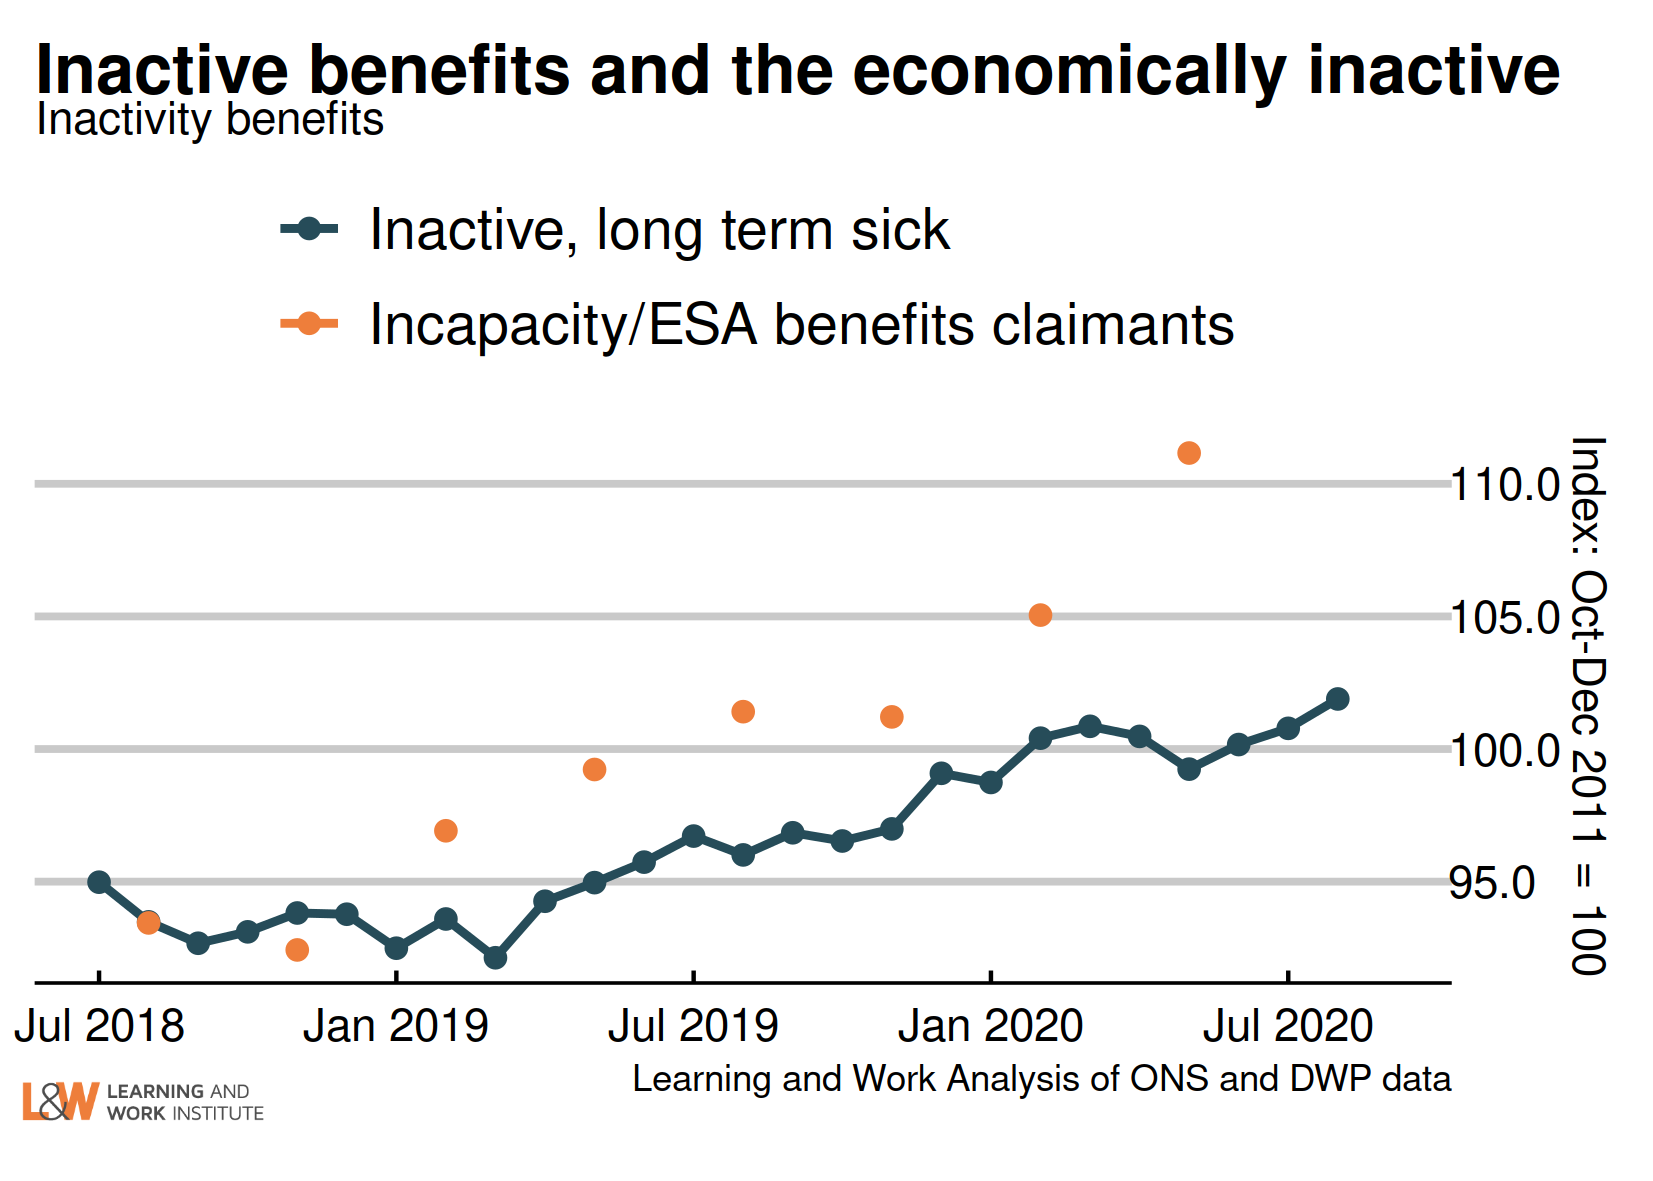 |
|
| Chart 13: Claimants for inactive benefits and the economically inactive – lone parents This chart shows claimants of out of work benefits as lone parents (the orange dots) and survey figures for all those who are economically inactive looking after family (including couple families). The survey figures (showing those looking after family) fell sharply while benefit measures rose slightly in the latest (May 2020) data. 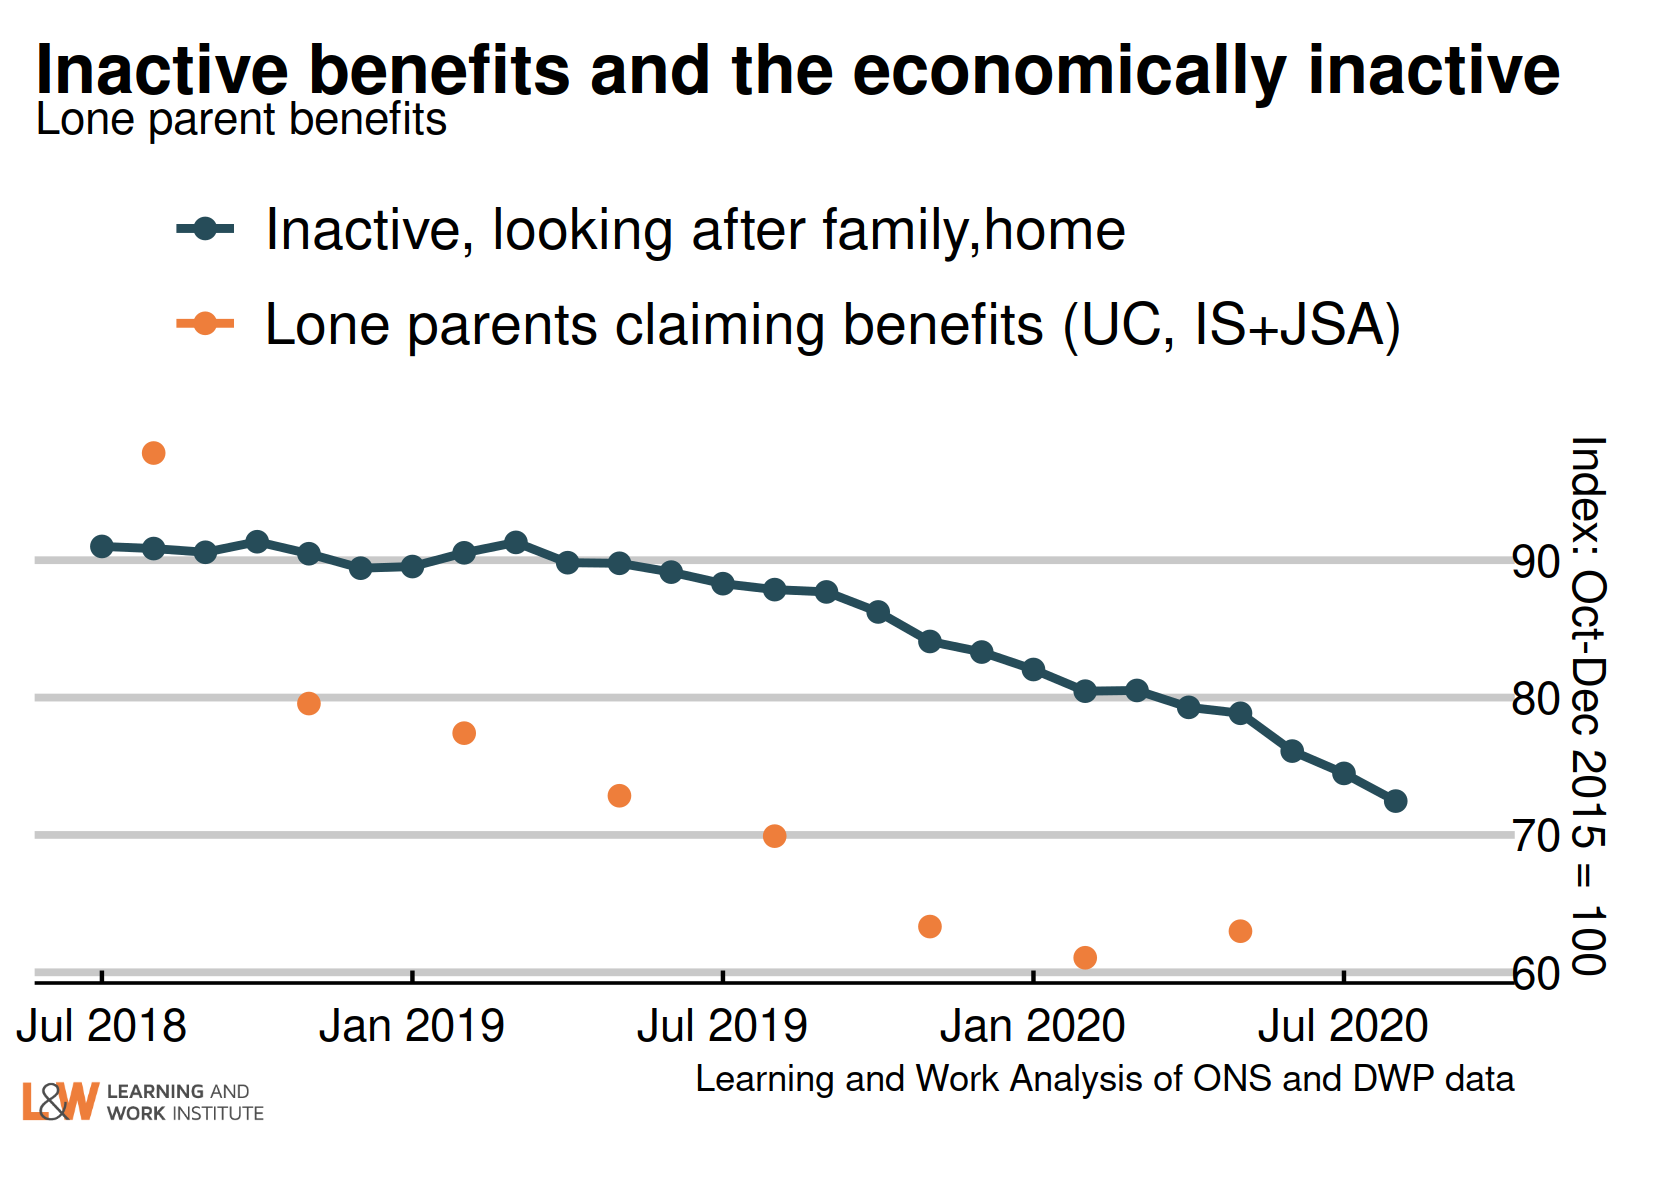 |
|
| Chart 14: Employment rate annual change in regions to– July 2020 to September 2020 Compared to last year, three regions still showed a rise in the employment rate, while nine showed a fall. The largest rises were in London and Yorkshire and the Humber, and the largest falls were in the South West, Wales and Northern Ireland. 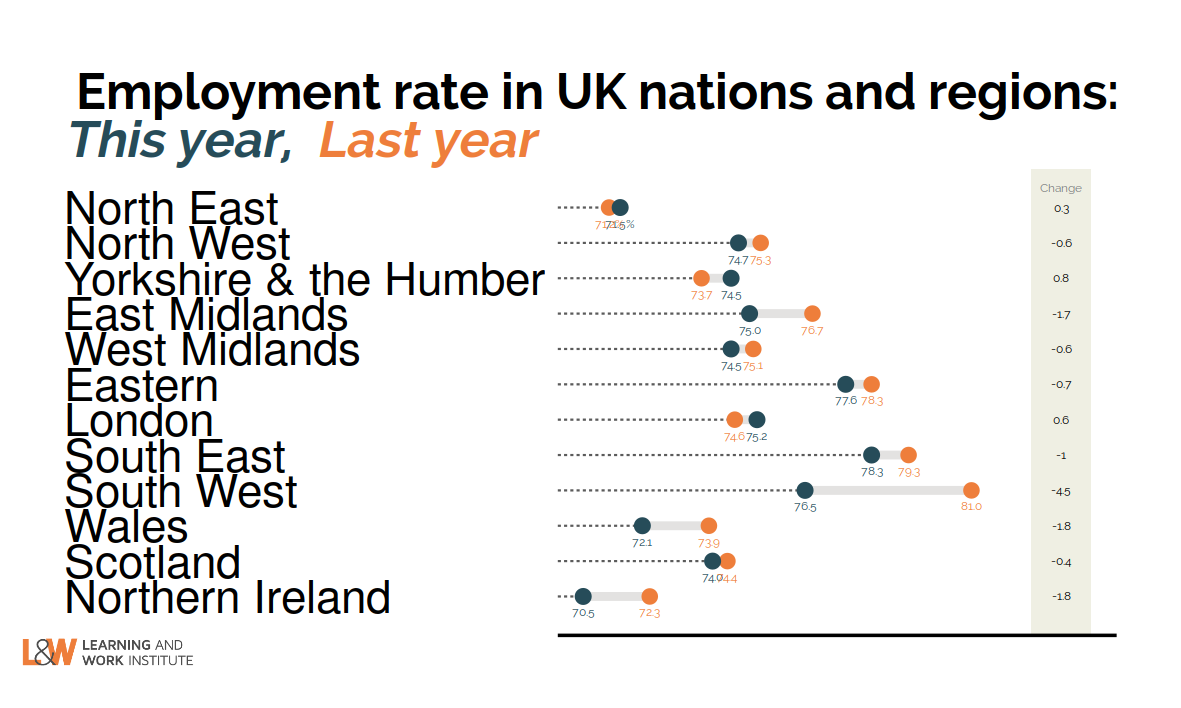 |
|
| Chart 15: Unemployment rate annual change in regions to – July 2020 to September 2020 Compared to last year, all regions showed a rise in unemployment. The largest rises were in the South West and London. 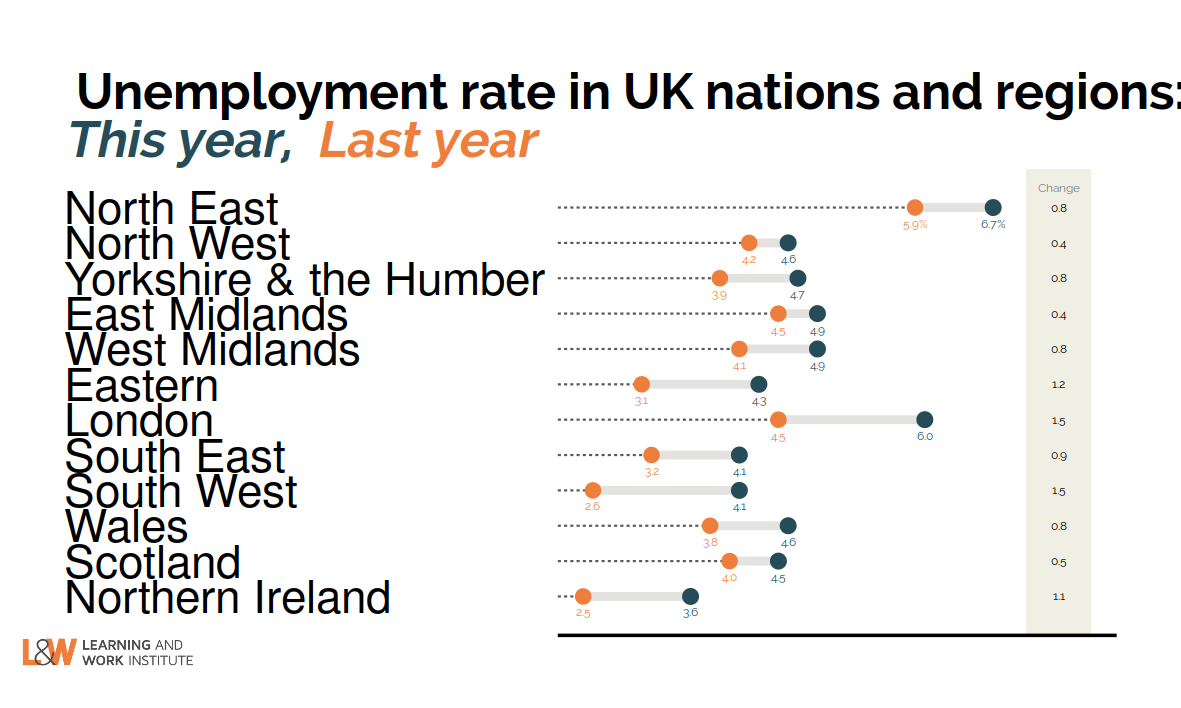 |
|
| Chart 16: Inactivity rate annual change in regions to– June 2020 to August 2020 Compared to last year, six regions showed a rise in the inactivity rate, led by the South West and the East Midlands, while five showed falls, led by London and Yorkshire and the Humber. 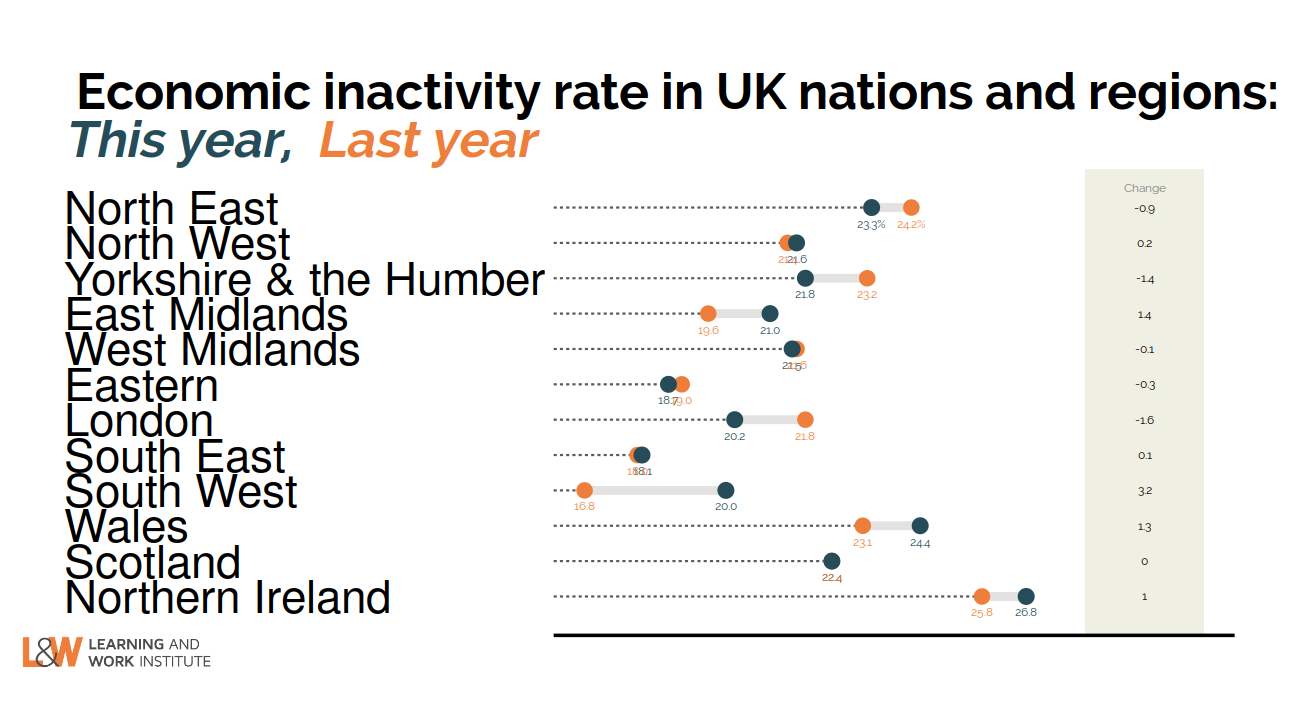 |
|
|
This newsletter is produced by Learning and Work Institute and keeps readers up to date on a wide range of learning and work issues. |
|