 |
|
Making learning and work count
Labour market LIVE from Learning and Work Institute
16 June 2020
- The ONS figure for claimant unemployed is 2,801,700, sharply up by 1,561,600 on March, and the claimant rate is 7.8%.
- The ONS figure for 18-24 claimant unemployed is 522,900 in May, up by 287,900 or 122.5% on March.
- Vacancies fell 342,000 in the three months to May.
- Single month vacancies fell 477,000 or 60.0% in May from February.
- Unemployment in February-April 2020 was 1,336,000, down by 12,000 from last month’s published figure (quarterly headline has fallen by 8,000) and the unemployment rate 3.9%, showed no change at on last month and was stable on last quarter.
- The number of workless young people (not in employment, full-time education or training) is 1,026,000, and has risen by 50,000 on the quarter, representing 14.9% of the youth population (up by 0.8 percentage points).
- Youth unemployment (including students) is 528,000, and is up by 21,000 on the quarter.
- The employment rate in February-April was 76.4%, (down by 0.3 percentage points on last month’s published figure and down by 0.1 percentage points in the preferred quarterly measure).
This briefing supplements our early briefing published this morning on our website. It does not repeat the early briefing or charts: this is additional to the early briefing.
Join us at our webinar tomorrow (17 June), to discuss these figures further. We will welcome comments from Stephen Evans, Shadow Employment Minister, Seema Malhotra MP and chief executive of ERSA, Elizabeth Taylor. Sign up here.
Learning and Work Institute comment
The headline labour market figures published on 16 June covering February to April still show no impact of the coronavirus pandemic. However, more timely indicators point to a dramatic negative impact of the crisis on a range of labour market indicators.
Duncan Melville, chief economist at Learning and Work Institute, commented:
The headline numbers for employment, unemployment and economic inactivity released today all cover February to April of this year. A little under a half of these three months was after the onset of the social distancing / lockdown measures put in place by the Government to combat the COVID-19 pandemic. Thus, it is surprising that there is still no sign of the impact of Coronavirus pandemic n these numbers. In the three months to February to April employment rose by 6,000, unemployment fell by 8,000 and inactivity amongst people of working age rose by 39,000. These are all very modest changes.
The single month LFS estimates released today show much more fully the impact of the crisis. Compared to March, employment in April was 318,000 lower. However, in April, ILO unemployment only increased by 40,000 while economic inactivity amongst people of working age increased dramatically by 425,000. Hence, the deterioration in employment in the month was reflected not in substantially higher unemployment, but in people exiting the labour market into inactivity. This presumably reflects the Government’s decision not to enforce job search requirements for Universal Credit between late March and late June due to the pandemic.
Other more timely indicators point clearly to the massive hit to the labour market that the COVID-19 pandemic has caused.
In May, the claimant count measure of unemployment rose by 528,900 to 2,801,700. This is its highest level since the early 1990s in the wake of the recession then. Over the two months since March, the claimant count has risen by 1,561,600 - a rise of 126 per cent in just two months.
At the end of April, total hours worked were 259 million hours lower than at the start of March - a fall of 24.3 per cent. Over the same period, employment fell by just 1.1 per cent, this demonstrates the effectiveness of the Coronavirus Job Retention Scheme. Total working hours are falling because so many workers are furloughed and so still employed but working zero hours.
Monthly vacancy figures for May were running at 318,000 which is 60 percent down on the pre-crisis levels of February. In May there were 8.8 claimant unemployment for each vacancy compared to just 1.6 in February. This is more than a five-fold increase, and the figure for May is also more double the peak of the ratio of claimant unemployment to vacancies seen in the aftermath of the Great Recession - 4.0 in January 2010. The weekly ONS Online Job Advert Estimates bottomed out at start of May and advert levels have picked up slightly since, but, even so, at start of June advert levels were still less than half those seen at the start of March.
The HMRC estimate of the number of paid employees fell by 163,000 in May and compared to March was 612,000 lower - a fall of 2.1 percent.
These figures above need to be seen within the context of the pandemic related shrinkage in the UK economy. Data released last Friday indicated that in April the economy contracted by 20 percent, and by 25 percent over the two months since February. The falls in employment up to the end of April and in paid employees between March and May were magnitudes smaller than the fall in economic output between February and April. This again points to the important impact the Coronavirus Job Retention Scheme is having in keeping workers who would otherwise lose their jobs in work.
Turnover figures from the Business Impact of Coronavirus (COVID-19) Survey for the first half of May showed one in five businesses having temporarily closed / paused trading and of those still operating around three fifths reported reduced turnover levels compared to the previous two weeks with around a quarter reporting turnover reductions of more than 50 percent. This suggests that the contraction in economic output seen between February and April continued into May.
Looking further forward, last week the OECD published a forecast for the UK economy. This suggested that GDP could fall by between 10.5 and 14 percent this year overall depending on whether or not there is a second outbreak of COVID-19 later in the year. In the single hit scenario, the OECD project that the unemployment rate will peak at 11.7 percent in the third quarter of this year and average 9.1 percent for the year as a whole. This projection is similar to that set out in the latest L&W research report, Emergency Exit, published on Friday which projects a potential increase in unemployment to a peak of 12 percent or 4 million. This report sets out the impact of coronavirus on the labour market, the likely scale of the challenge we face, and identifies policy priorities to get Britain back to work.
The report calls on the Government urgently to introduce an ambitious ‘Plan for Jobs’, including;
-
Large-scale investment and incentives to create jobs with shovel-ready and jobs-rich schemes brought forward. Rather than cutting employer taxes - which would be expensive and less effective - action should be taken to stimulate demand, including through car and boiler scrappage schemes.
-
A Youth Guarantee to prevent a rise in long-term youth unemployment, including maintenance support to help 18 year olds to stay on in education; an Opportunity Fund to create ring-fenced temporary jobs for young people; and reforms to the apprenticeship system to re-focus funding on young people.
-
A massive expansion of help to find work, including for the millions of furloughed workers at risk of losing their jobs. This should include £800 million in redundancy, retraining and reemployment support, at least 10,000 extra Jobcentre Plus Work Coaches, and £2.4 billion of support for the long-term unemployed.
|
 |
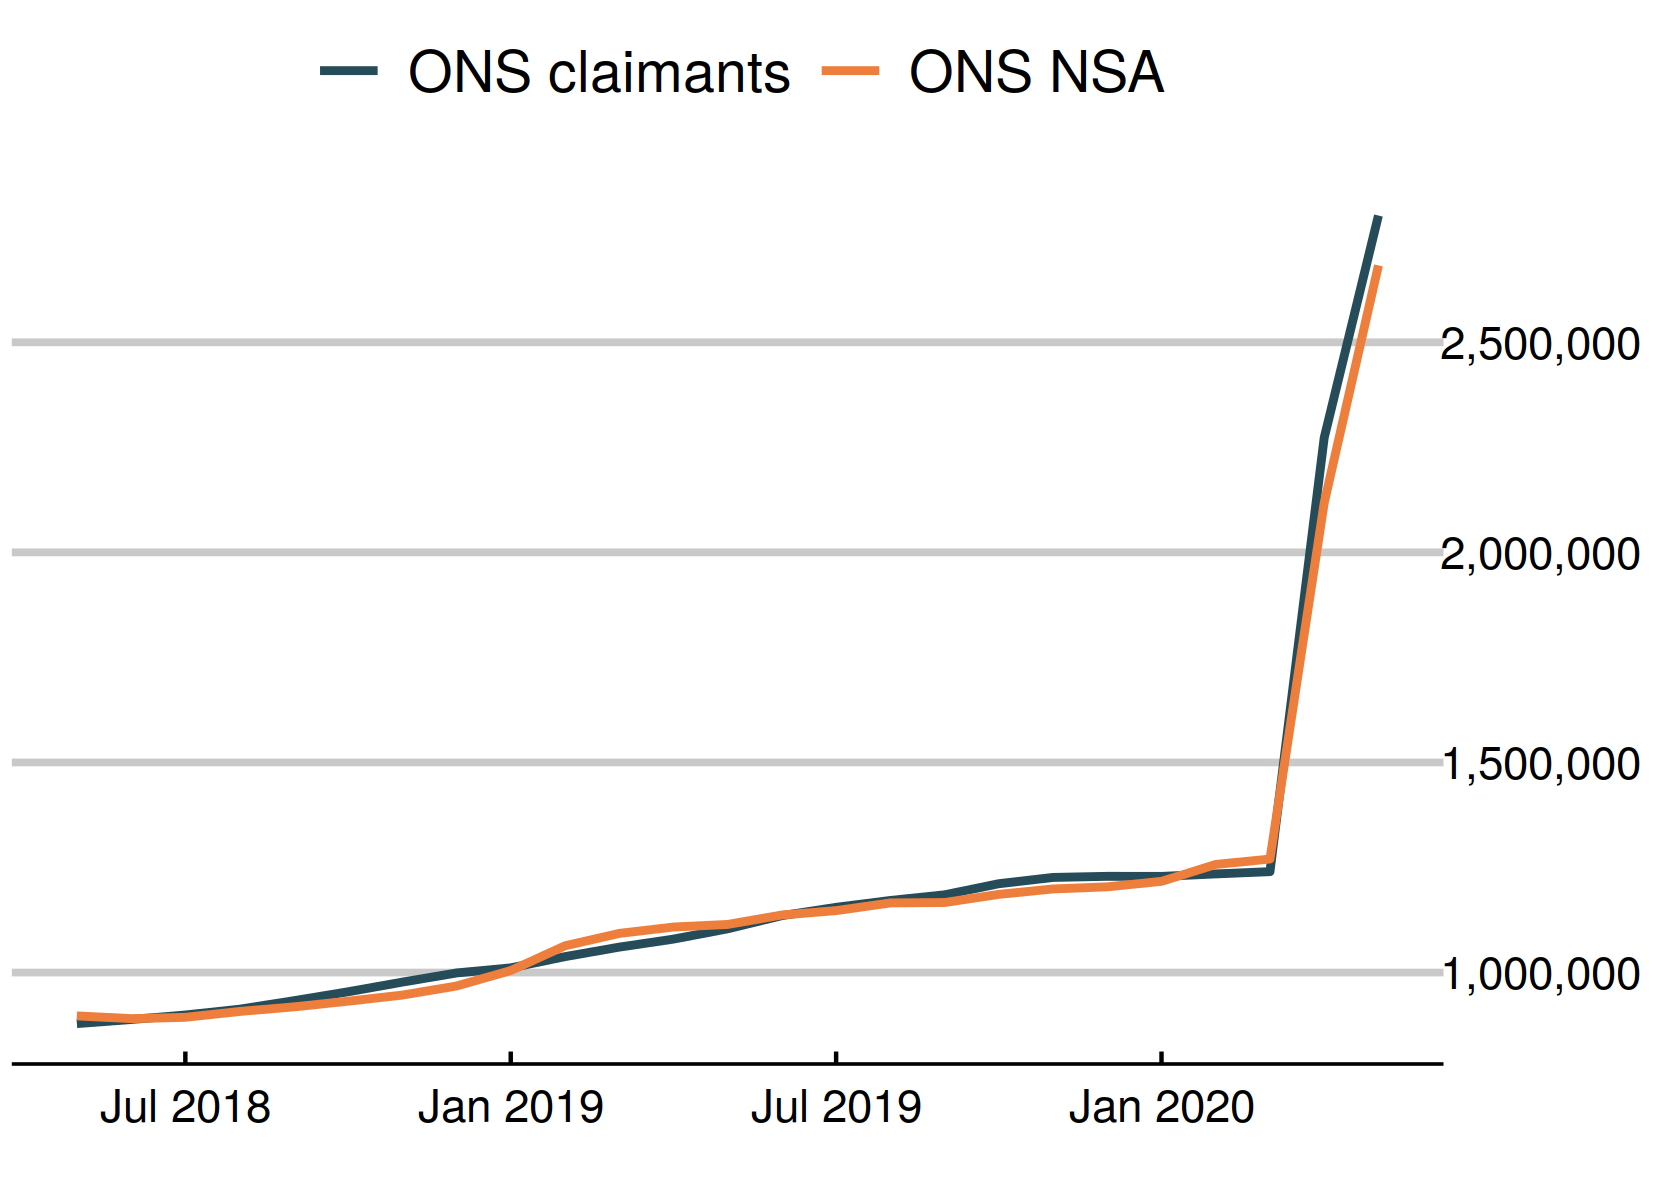
Chart 1: Jobseeker’s Allowance and Universal Credit claimant count
The ONS headline Jobseeker’s Allowance and Universal Credit claimant count rose by 528,917 in May, taking the total to 2,801,729. ONS' claimant count before seasonal adjustment has risen by 565,247 to 2,683,031. This change is directly comparable to the local level claimant count changes published today.
 |
 |
Chart 2: Universal Credit new claims
DWP have announced that, since the beginning of March, they have taken 3,238,220 individual Universal Credit claims, representing 2,570,900 families.

|
|
Chart 3: UK unemployment (ILO)
The latest ILO unemployment figure (for February to April) is 1,336,000. Most of the survey responses in this figure were collected before the official lockdown on 23 March. The figure has reduced by 12,000 from the figure published last month. The unemployment rate was unchanged at 3.9%. 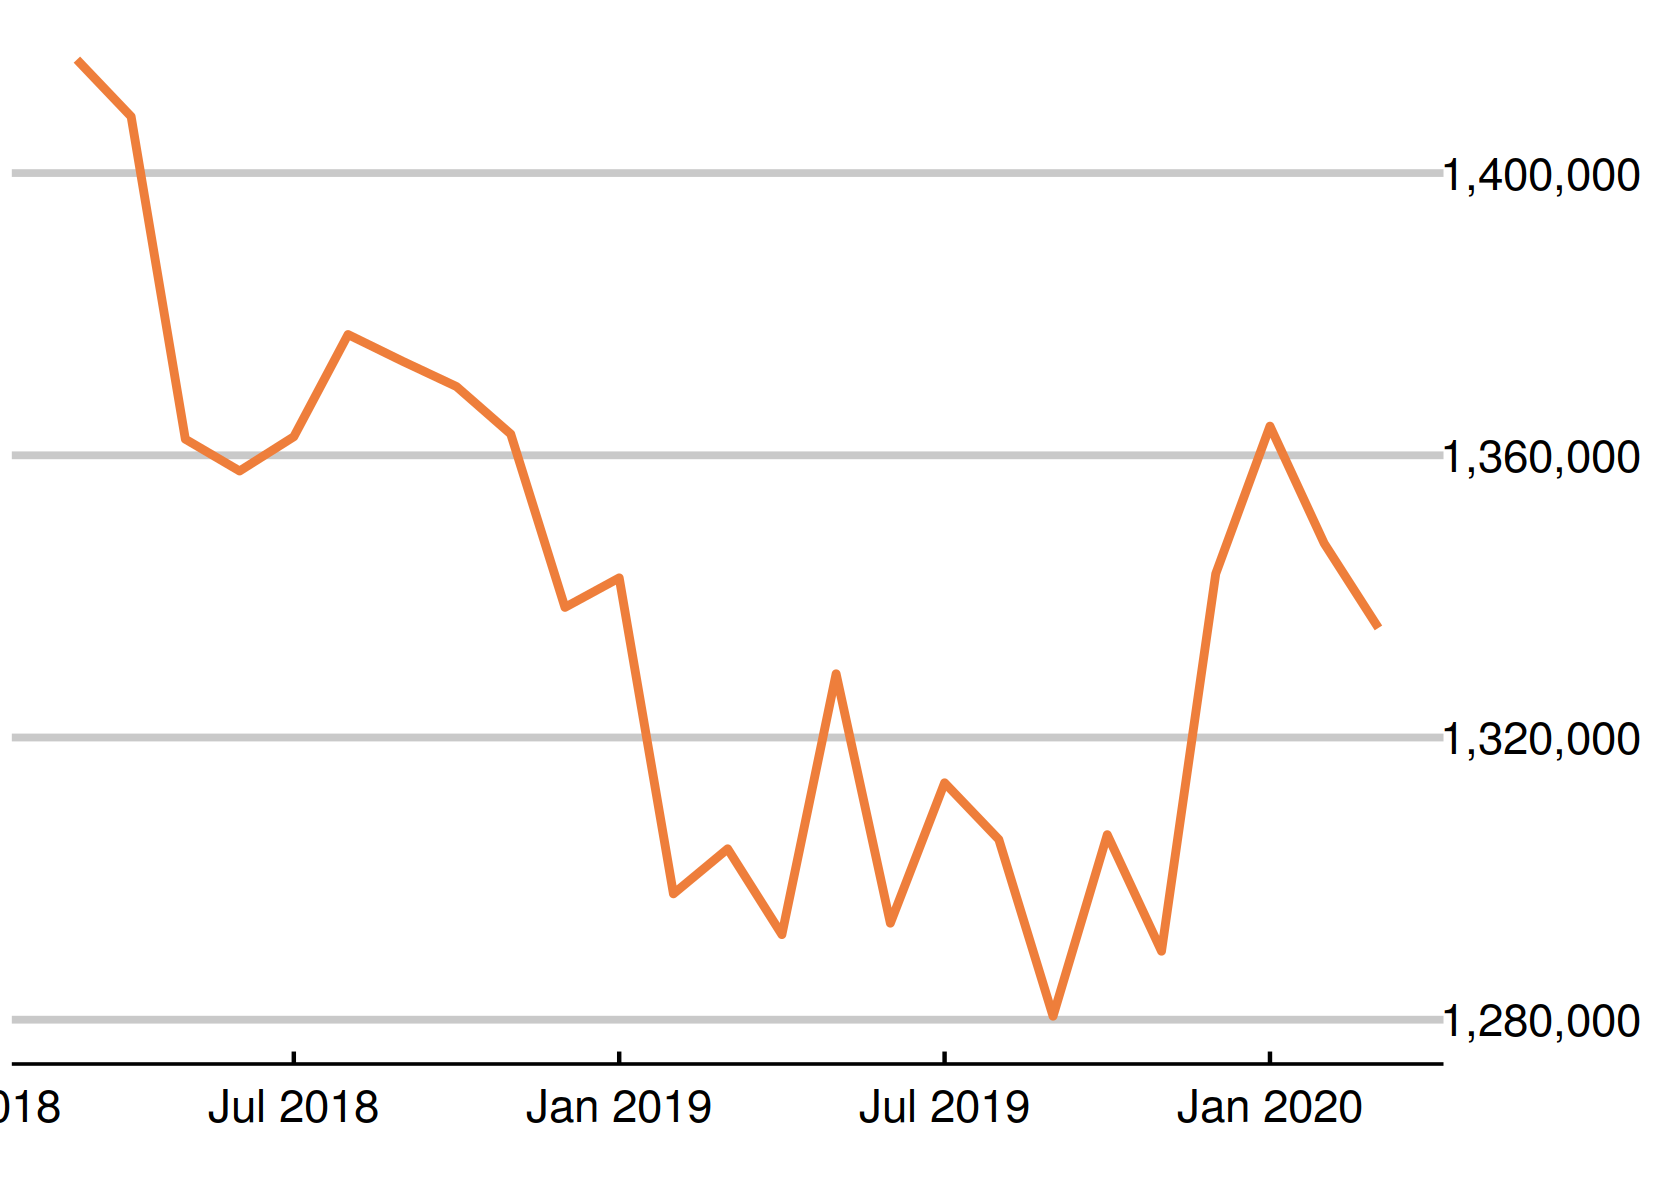 |
|
Chart 4: Youth unemployment
The number of unemployed young people has risen by 12,000 since last month’s figures, to 528,000.
Meanwhile, the number of young Universal Credit or Jobseeker’s Allowance claimants rose last month by 128,051, to 522,948. There are still 116,000 unemployed young people who are not in education, and do not claim Jobseeker’s Allowance, 33.0% of all unemployed young people who are not students. 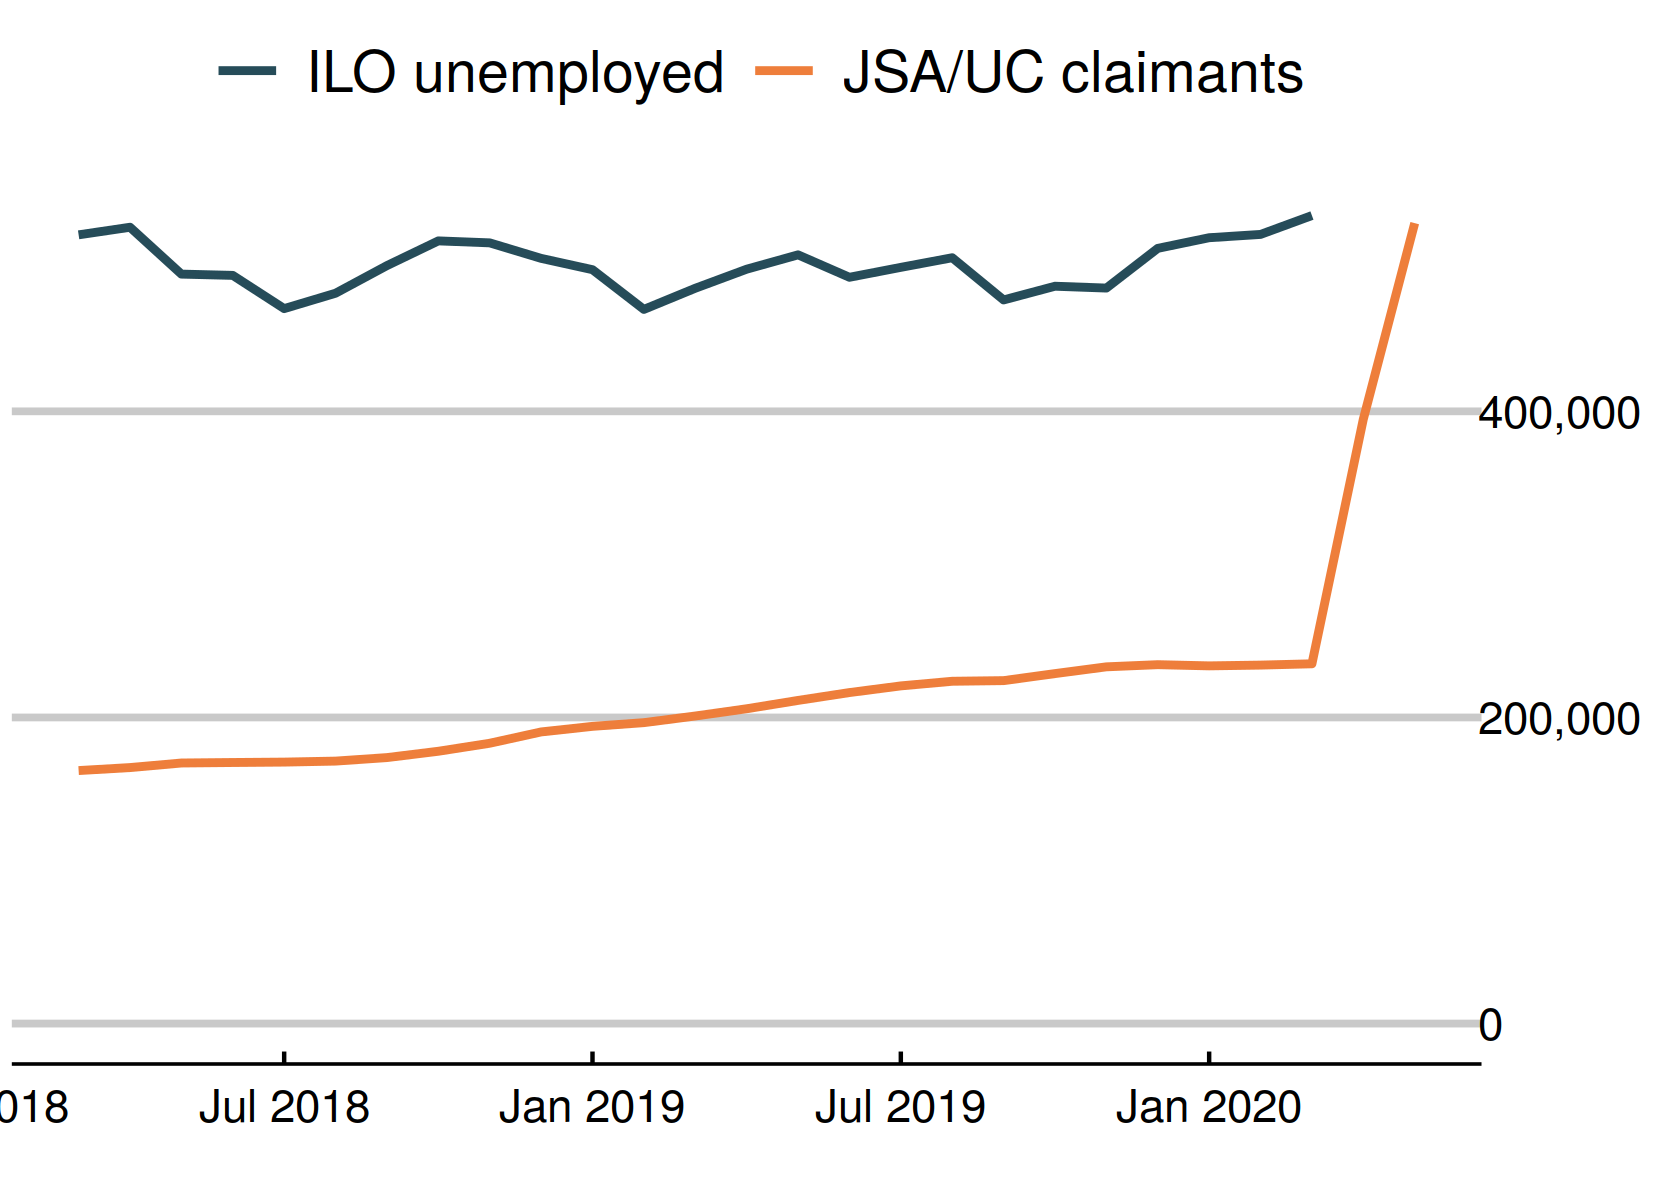 |
|
Chart 5: Vacancies – whole economy survey
Vacancies (in the Office for National Statistics survey of the whole economy) fell sharply this month, to 476,000. The ONS' experimental single-month vacancy figure shows a much sharper fall, to 318,000. The headline ONS vacancy figure is both seasonally adjusted and a three- month average. The chart shows both series. 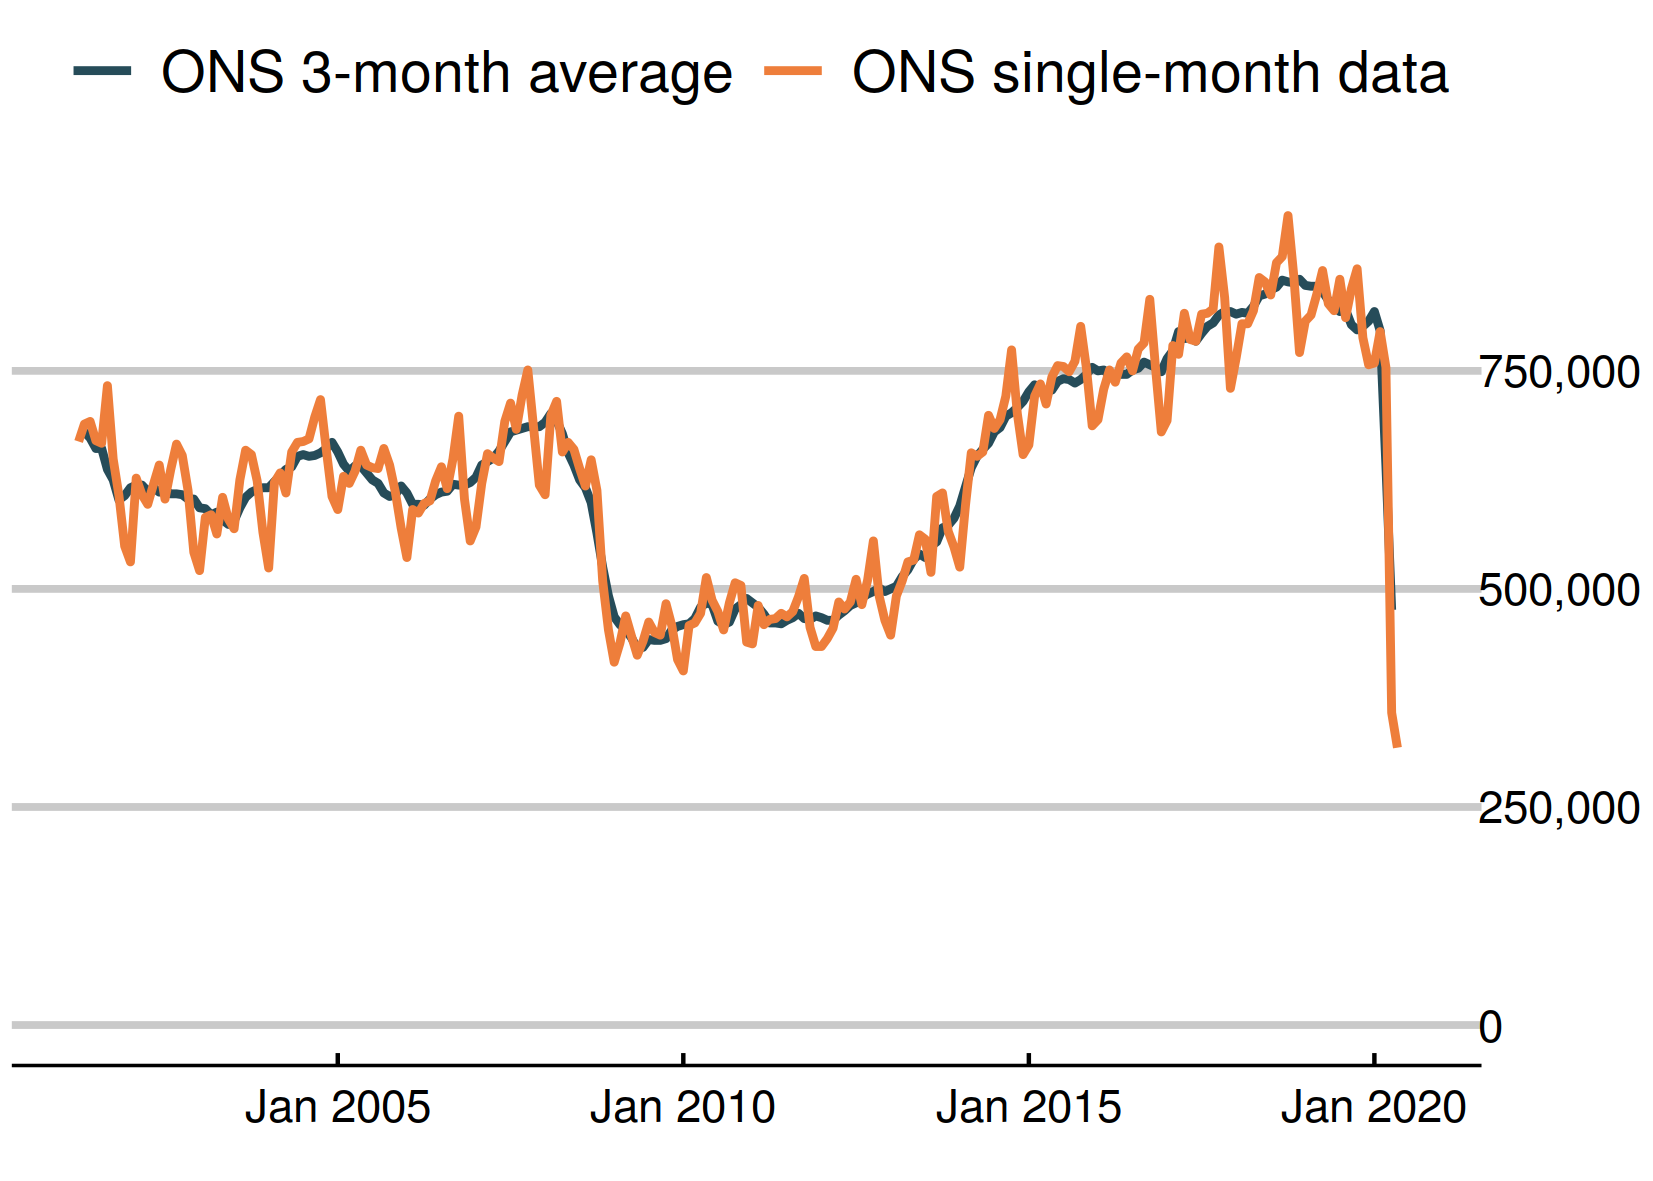 |
|
Chart 6: Experimental single month vacancies – whole economy survey
The Office for National Statistics experimental single month vacancy estimates include sectoral information. As these are not seasonally adjusted, it is fairer to use an annual change.

|
|
Chart 7: Unemployment rates by age
The 18 to 24 year old unemployment rate (including students) is 10.7% of the economically active – excluding one million economically inactive students from the calculation. The rate for those aged 25 to 49 is 2.8%. For those aged 50 and over it is 2.5%. The quarterly change is up 0.2 for 18 to 24 year olds, no change for 25 to 49 year olds, and down 0.3 for the over-50s.  |
|
Chart 8: Young people not in employment, full-time education or training
The number of out of work young people who were not in full-time education in February to April (1,026,000) has risen in the past quarter by 50,000 , or 5.2%. The rise was largely among the inactive, with the number of unemployed young people not in full-time education or training falling in these quarterly figures.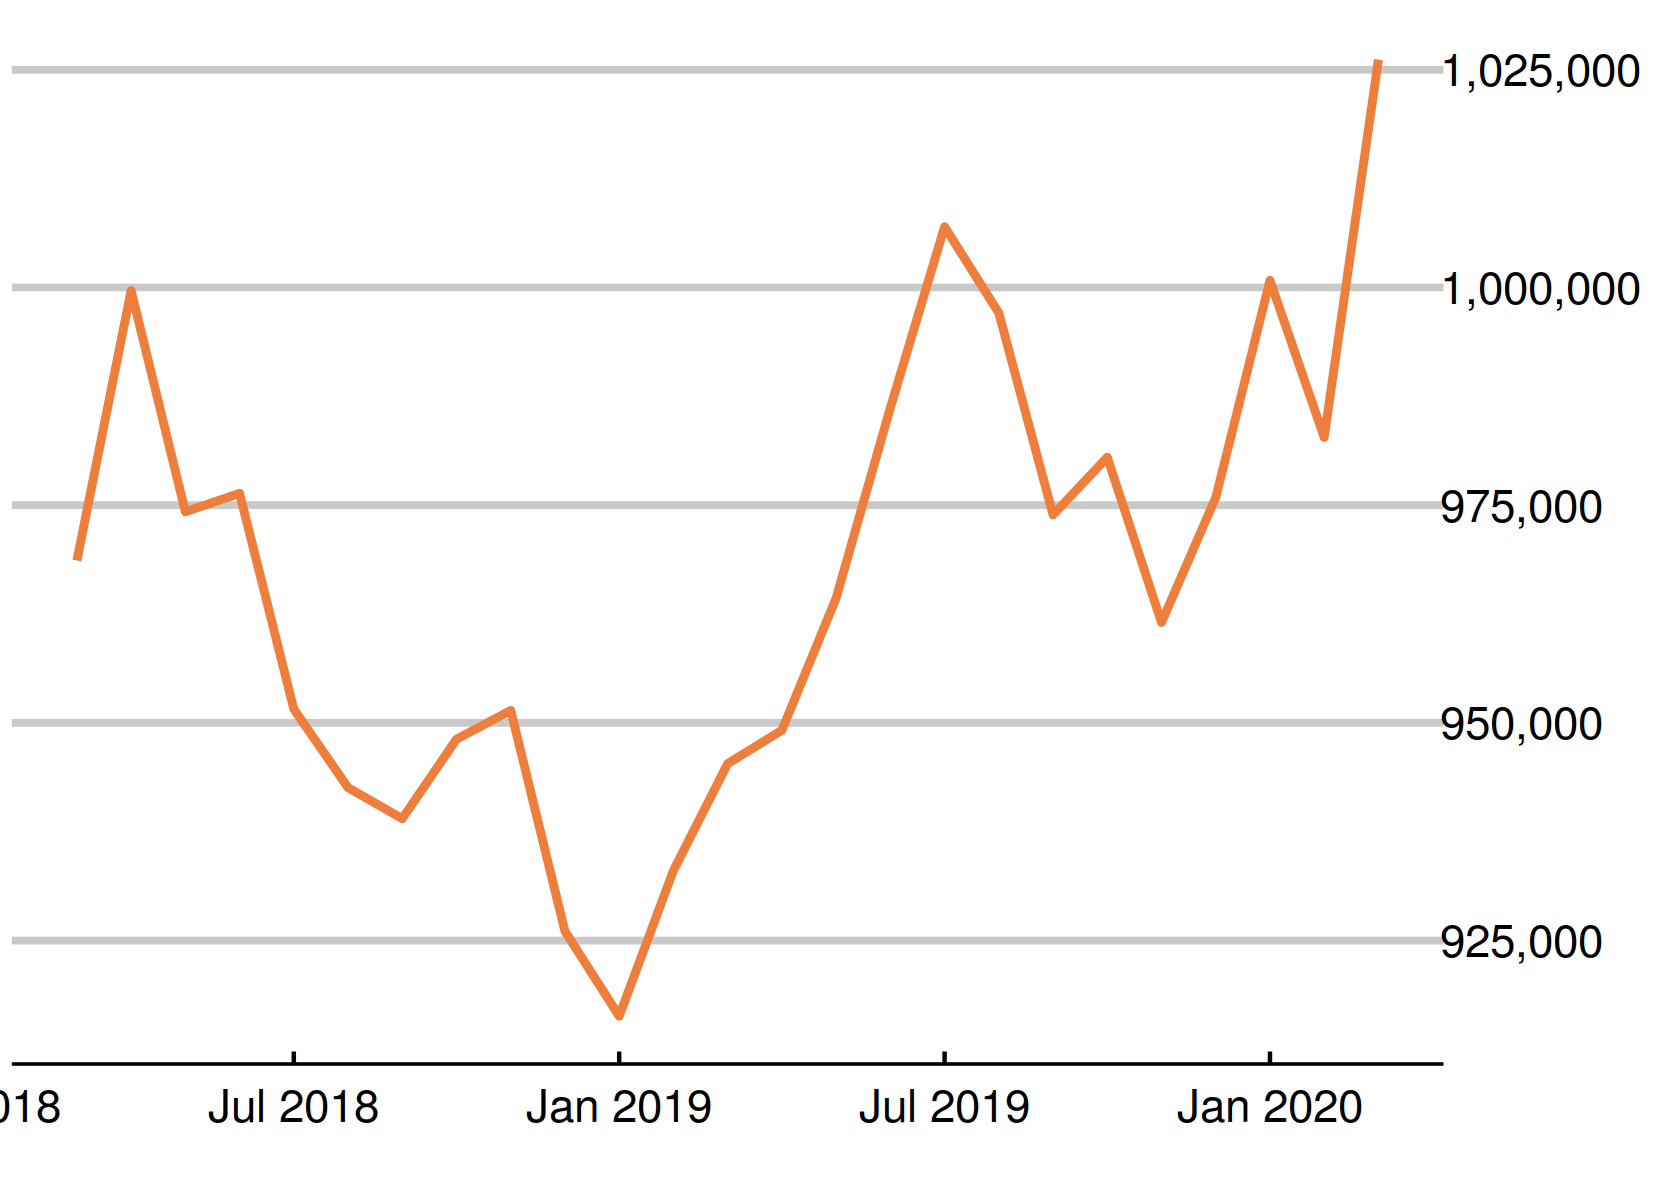 |
|
Chart 9: UK employment
Employment fell by 153,000 on the figure published last month, to 32,991,000. 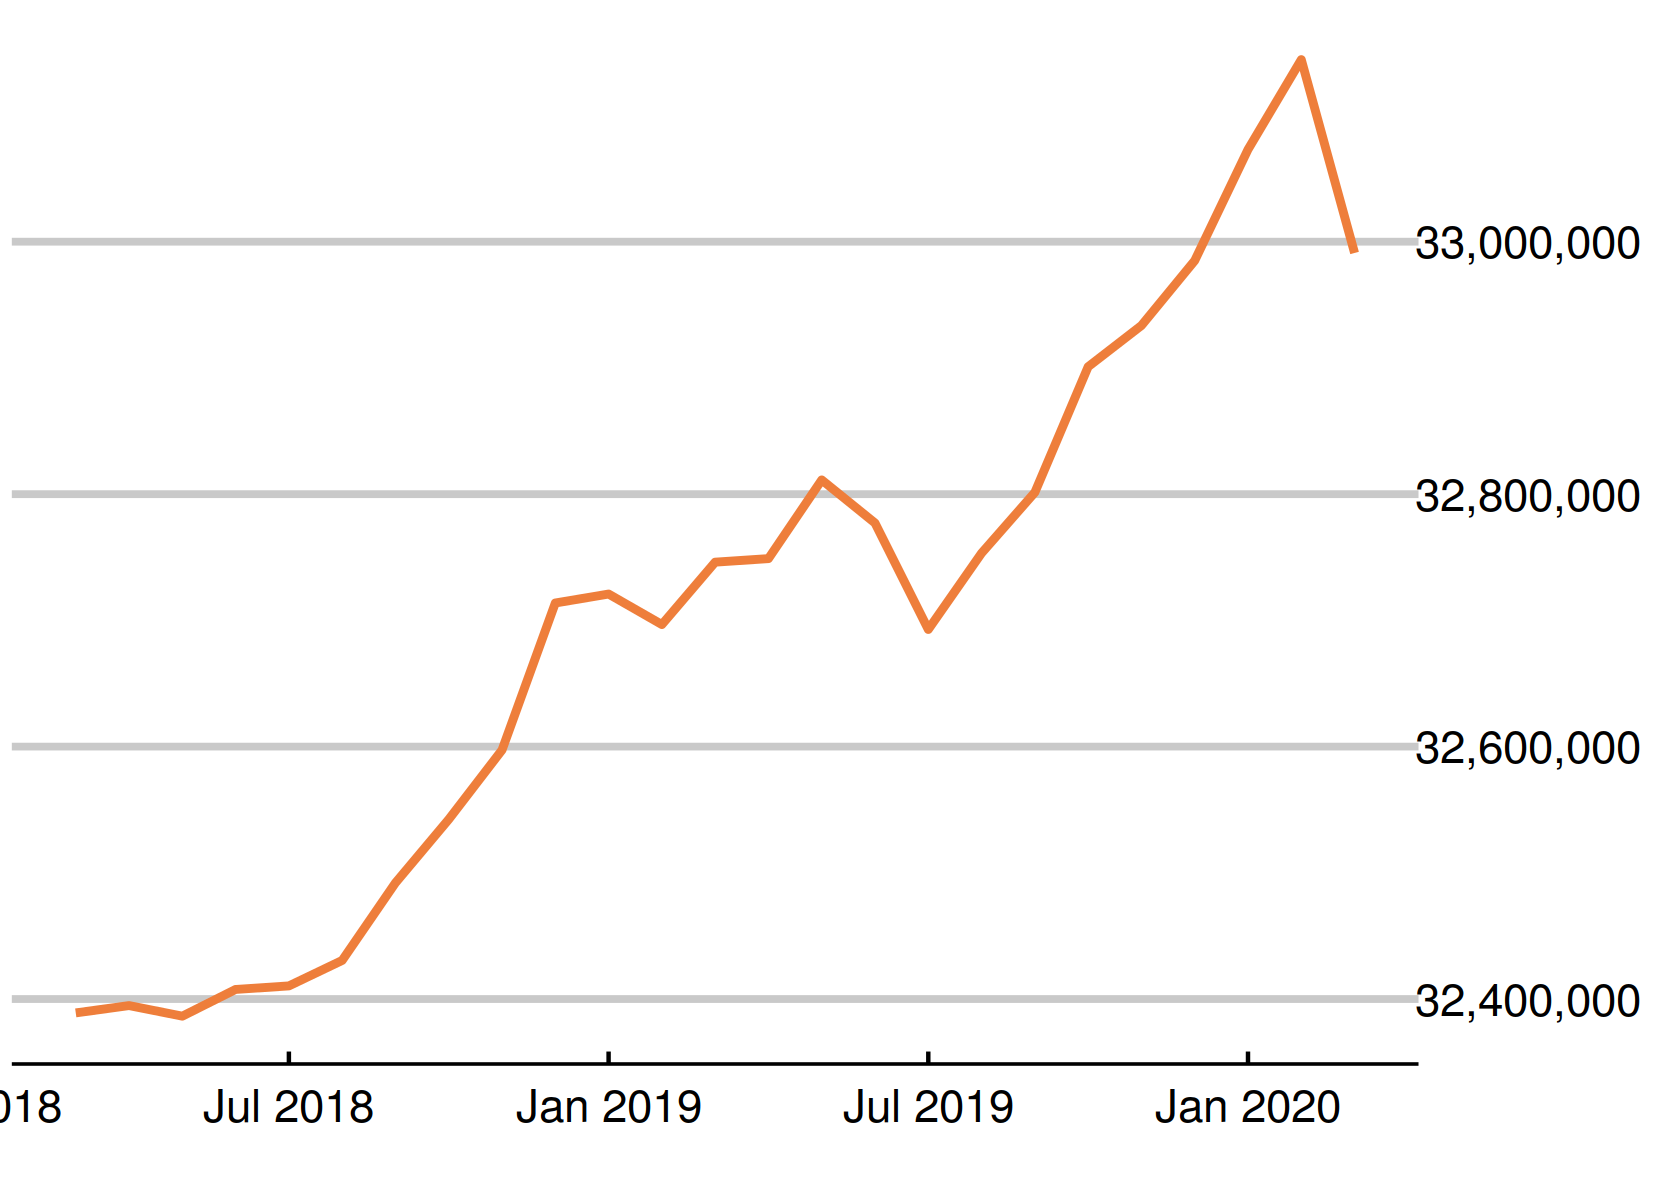 |
|
Chart 10: Employment rate in the UK
The employment rate fell by 0.1 percentage points over the quarter, to 76.4%. 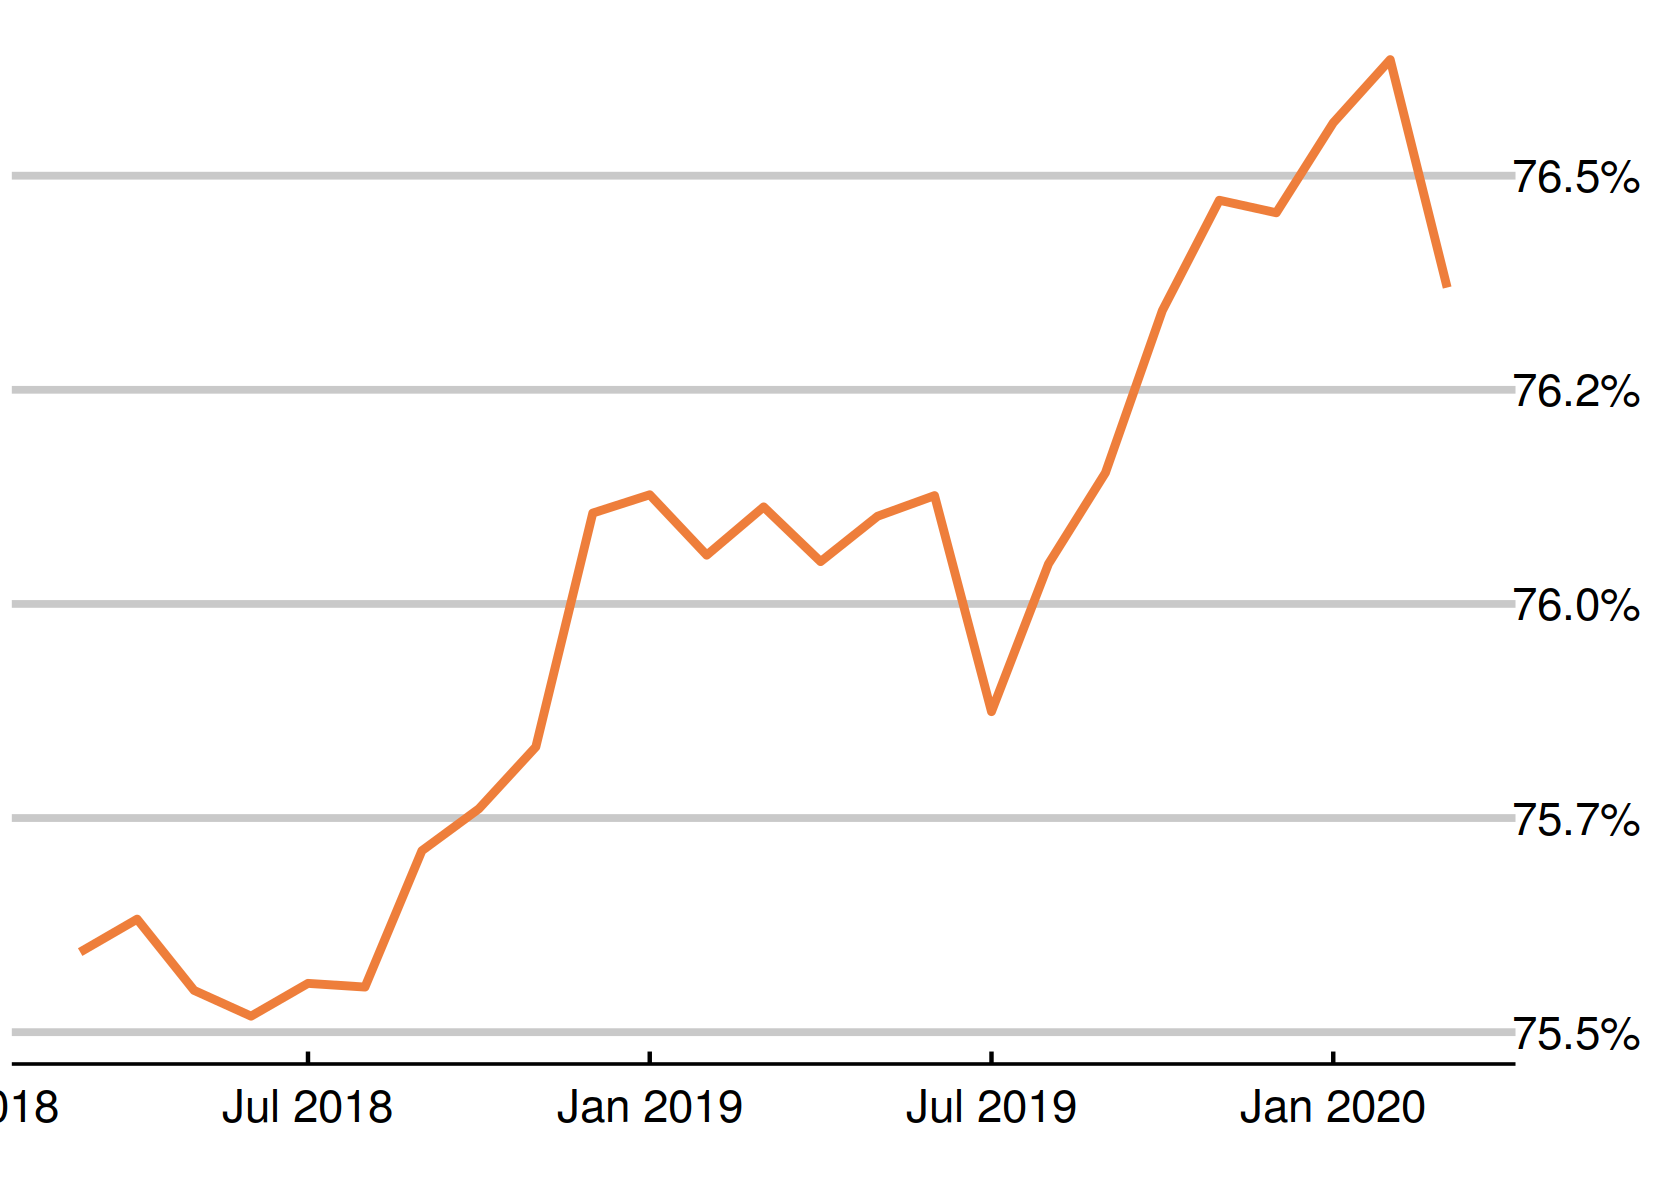 |
|
Chart 11: Claimants for inactive benefits and the economically inactive – inactivity benefits
The number of people inactive owing to long-term sickness fell, as did the benefit figure.
This chart shows claimants of Employment and Support Allowance, and Universal Credit planning for work and those with no work requirements (both out of work) (the orange dots), compared with survey figures for the economically inactive owing to long-term sickness. 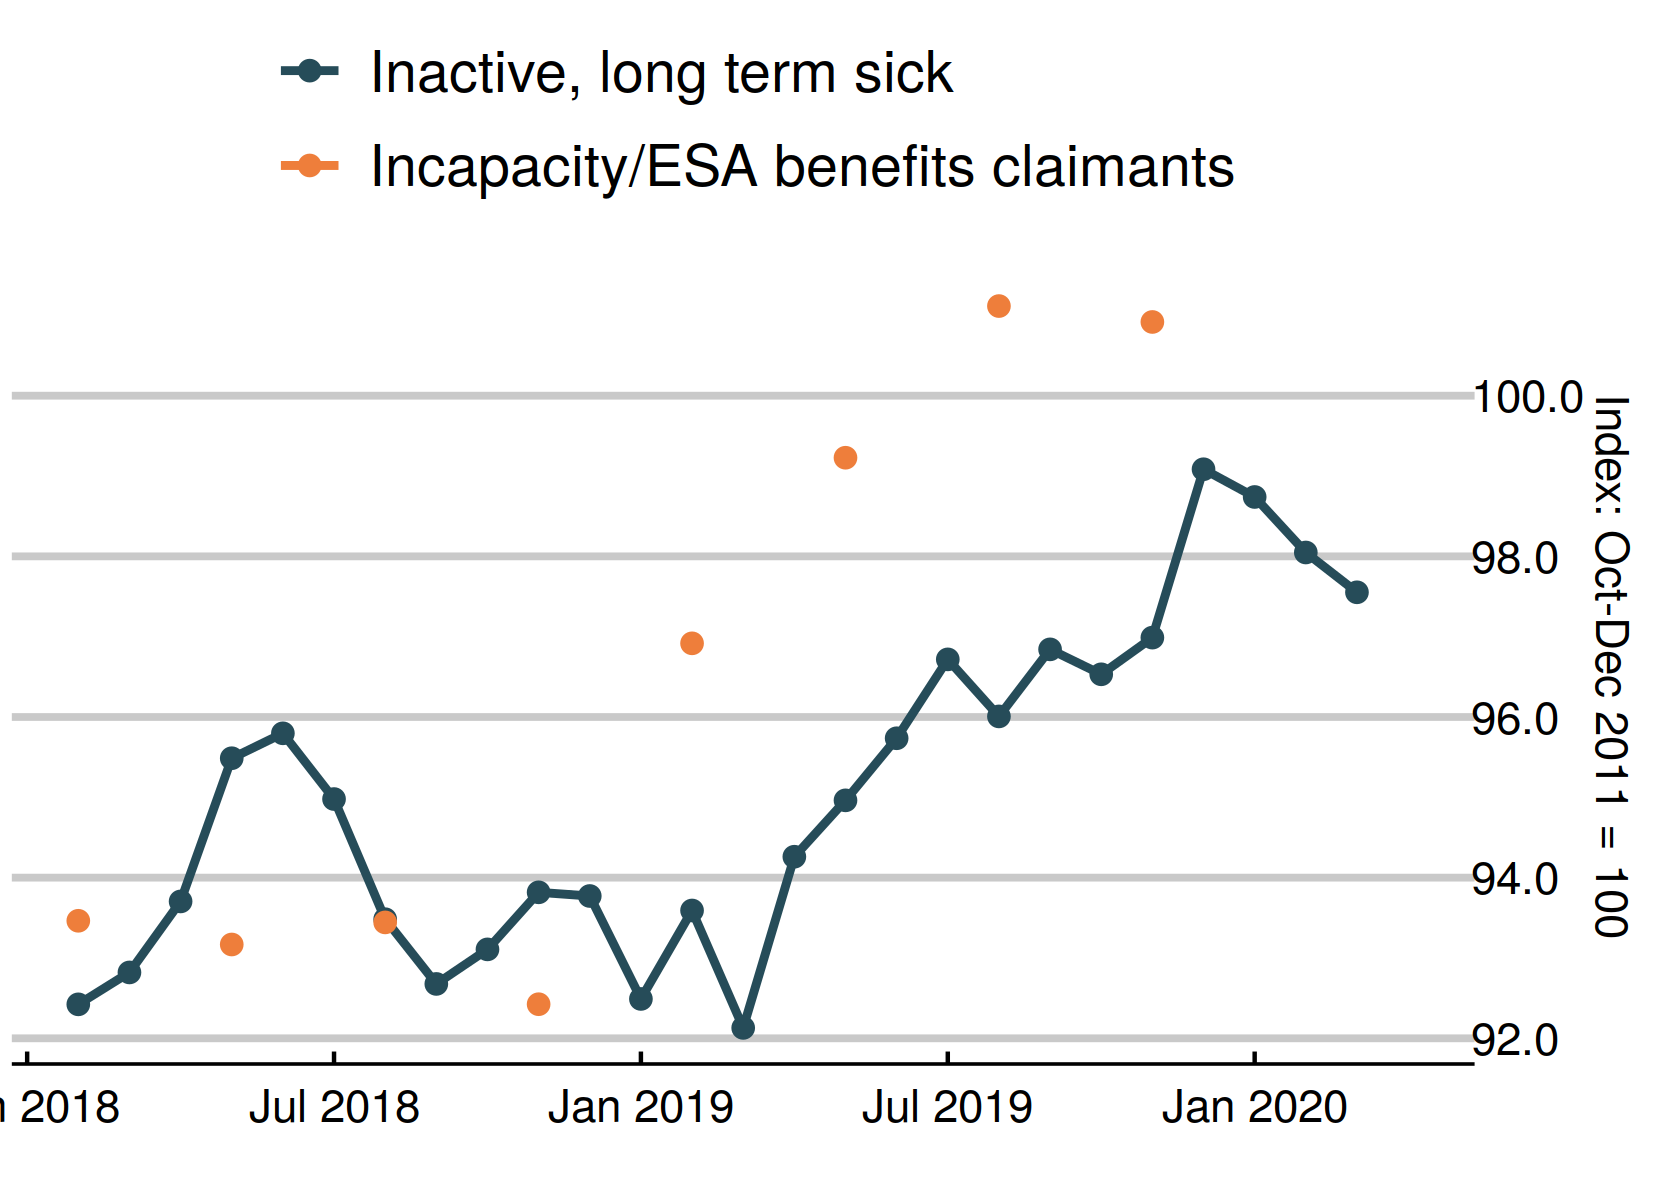 |
|
Chart 12: Claimants for inactive benefits and the economically inactive – lone parents
This chart shows claimants of out of work benefits as lone parents (the orange dots) and survey figures for all those who are economically inactive looking after family (including couple families). The survey figures (showing those looking after family) continued to fall while benefit measures had fallen earlier.
The benefit figures include lone parents remaining on Income Support as lone parents and Universal Credit claimants in the planning for work group. The latest DWP data does not show any still on Jobseeker's Allowance.
This chart shows claimants of out of work benefits as lone parents (the orange dots) and survey figures for all those who are economically inactive looking after family (including couple families). 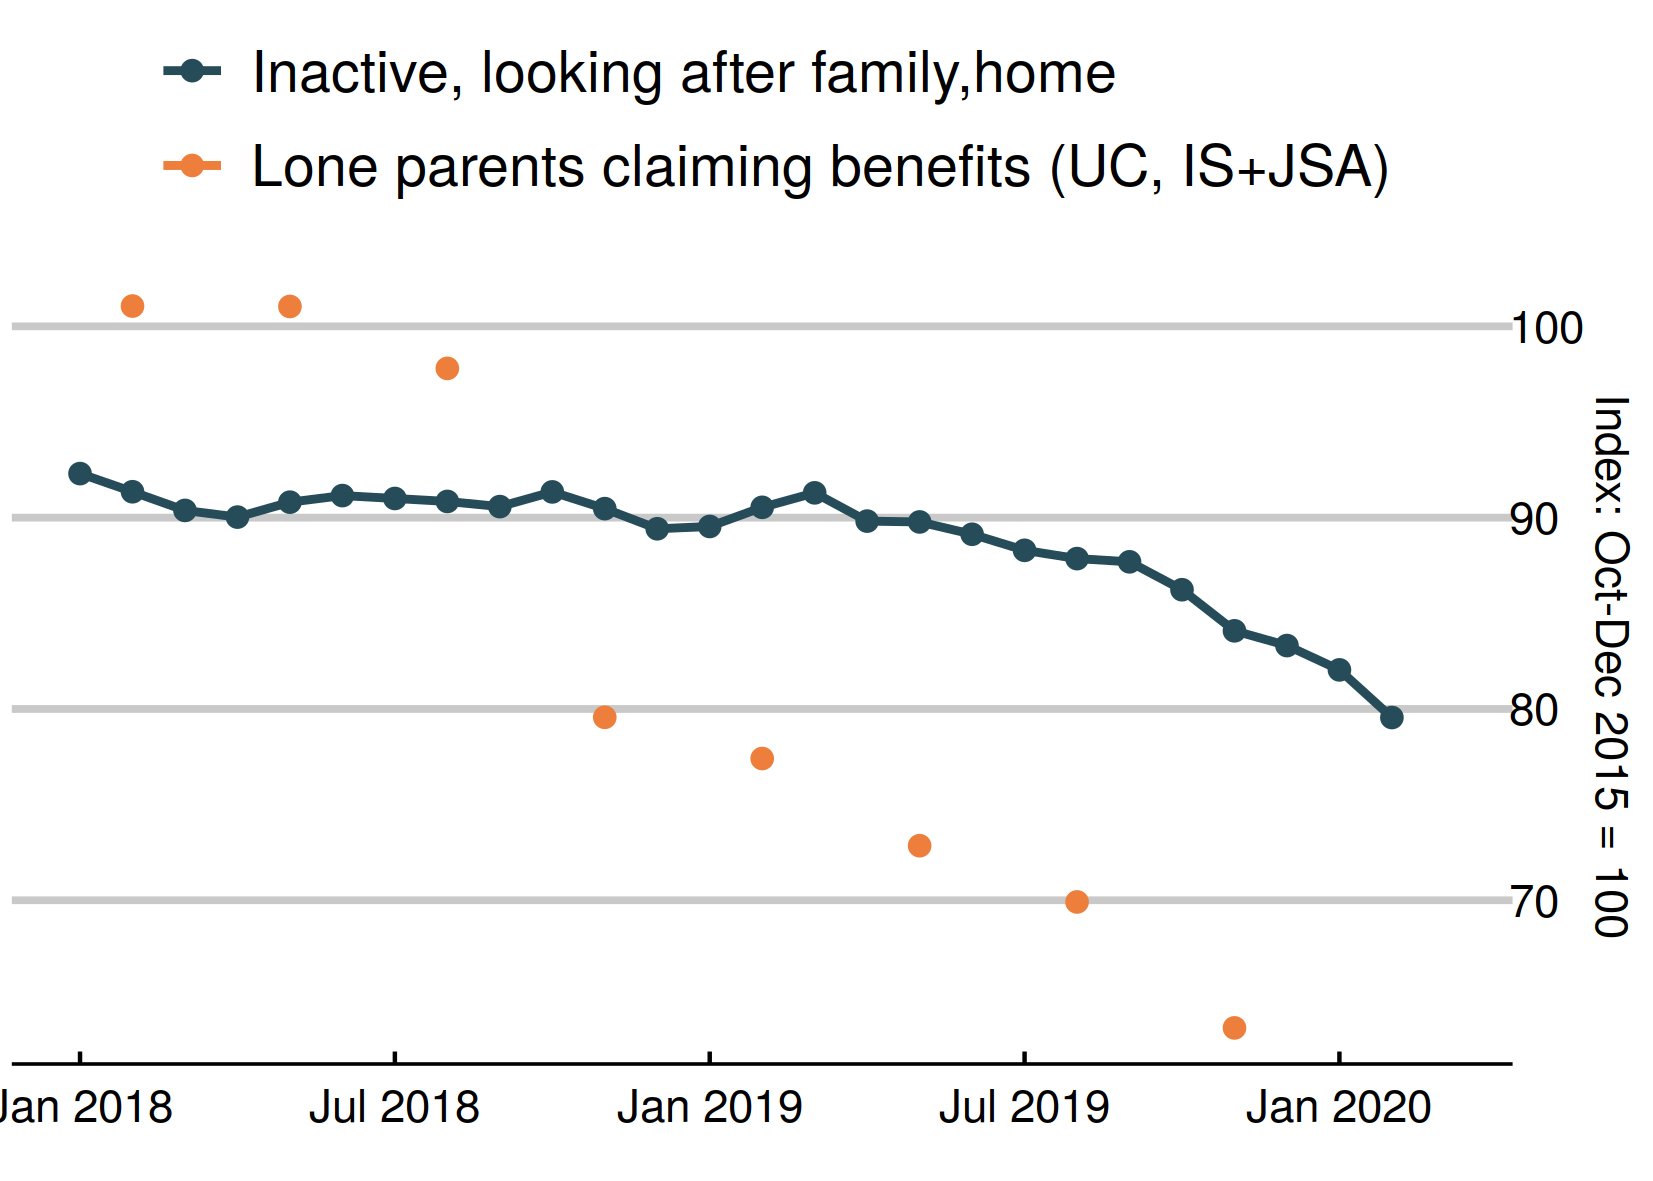 |
|
Chart 13: Employment rate quarterly change in regions – February 2020 to April 2020
This quarter, six regions showed a rise in the employment rate, led by the North East and Yorkshire and the Humber. The employment rate fell in six regions, led by the West Midlands and South West. 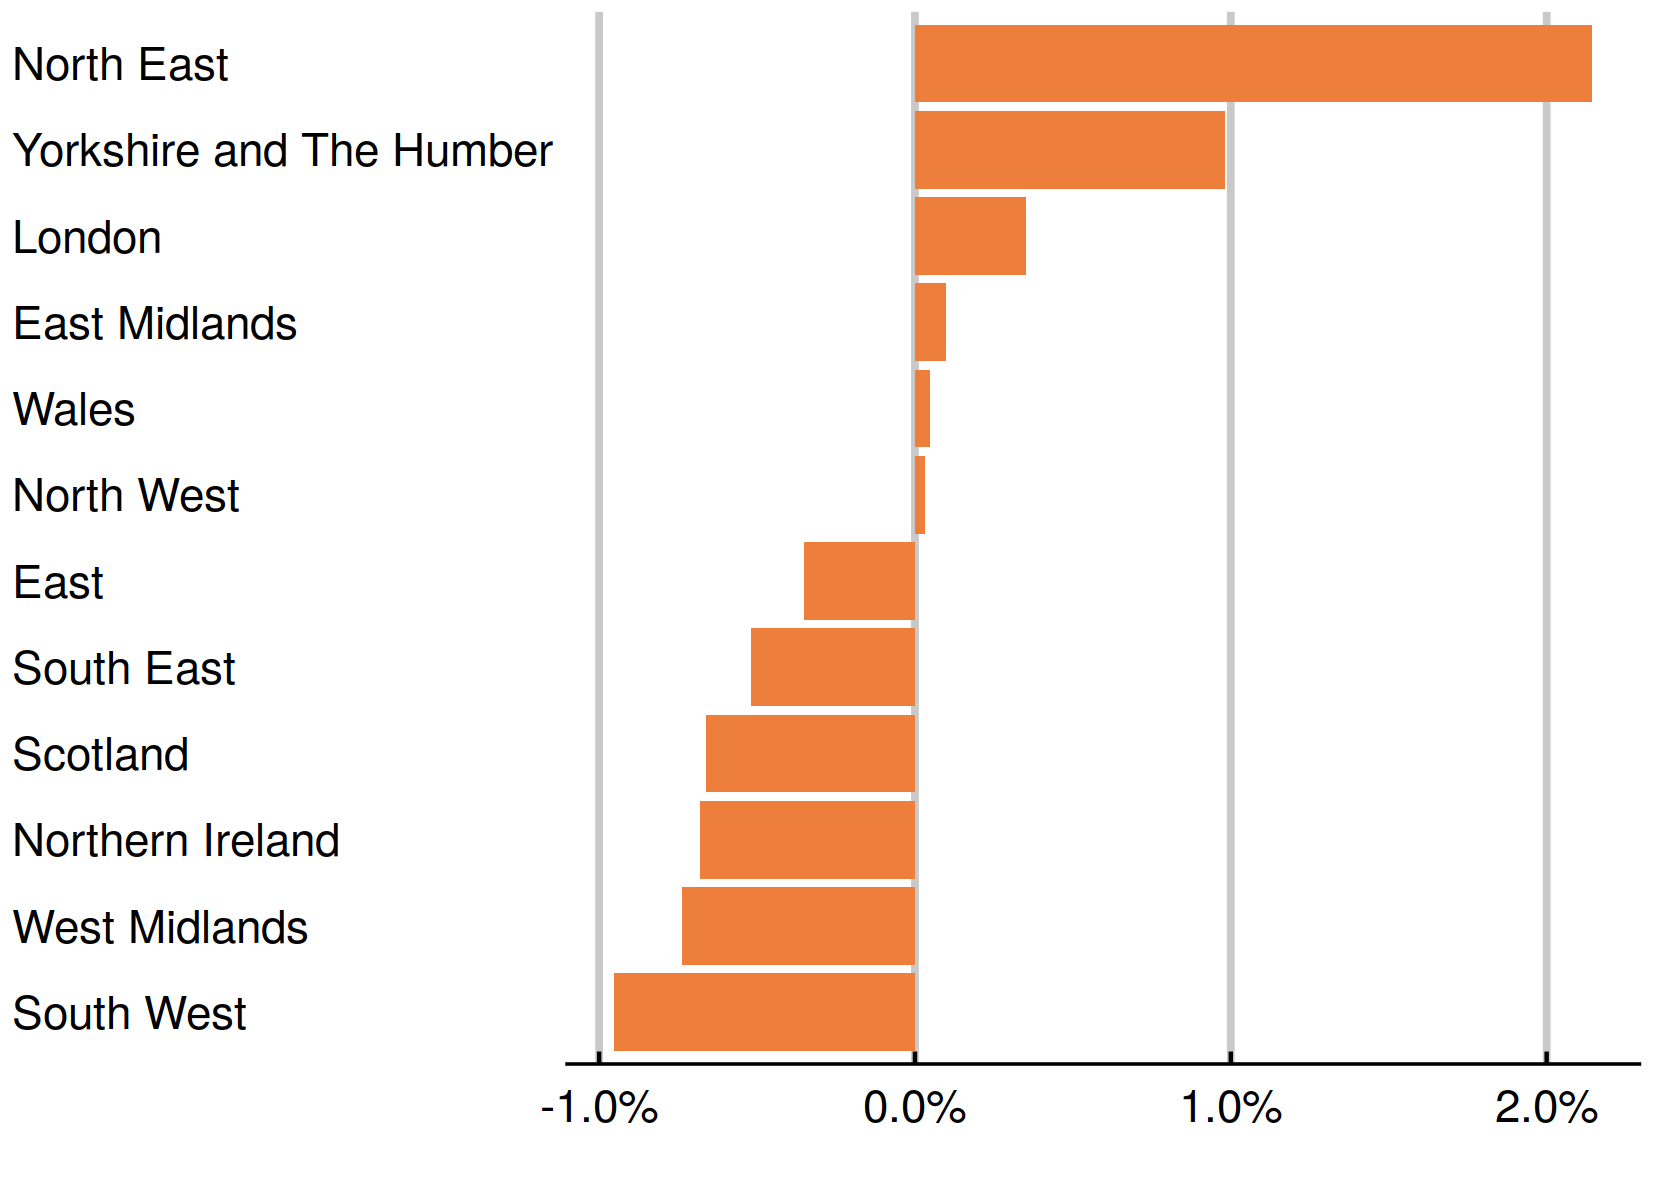 |
|
Chart 14: Unemployment rate quarterly change in regions – February 2020 to April 2020
Seven regions showed an improvement in the unemployment rate this quarter. Five showed a worsening. The rises were led by Scotland and the West Midlands. 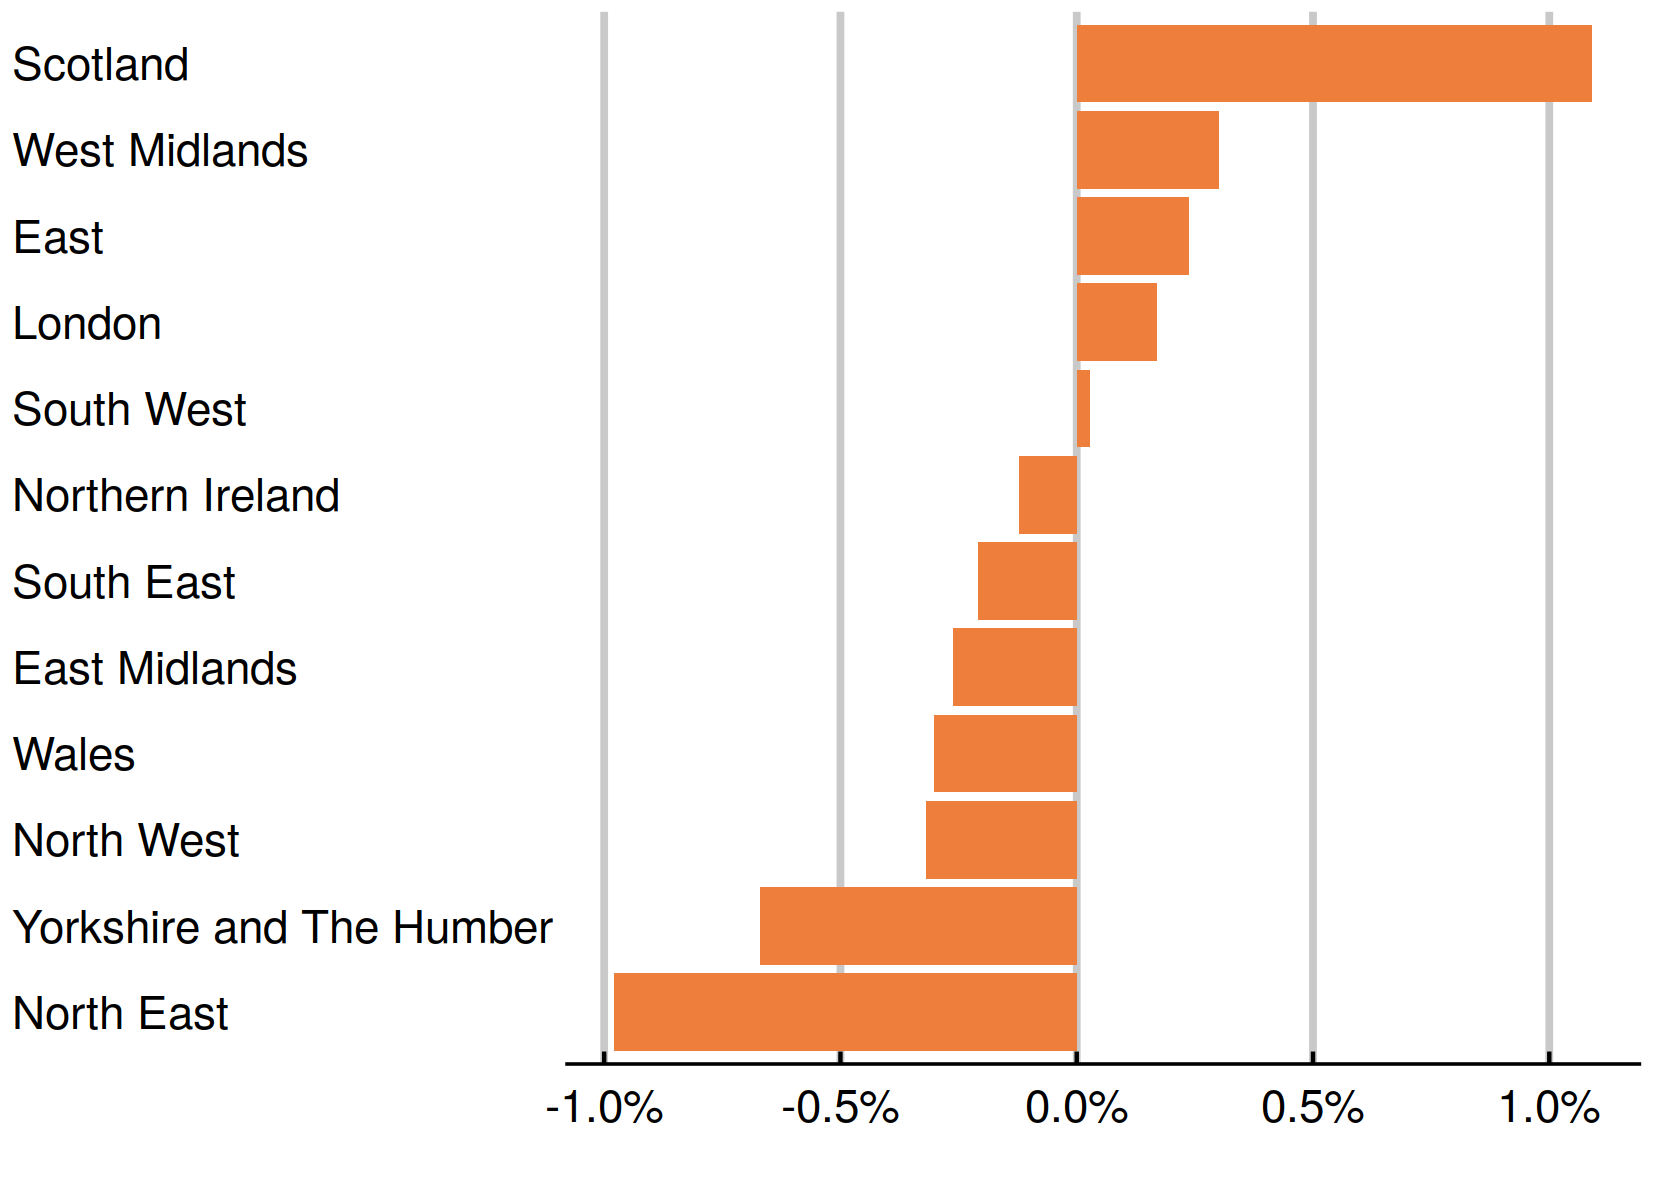 |
|
Chart 15: Inactivity rate quarterly change in regions – February 2020 to April 2020
Overall, there was a 0.1 percentage point fall in the inactivity rate. Eight regions showed rises in inactivity, led by the South West and Northern Ireland. 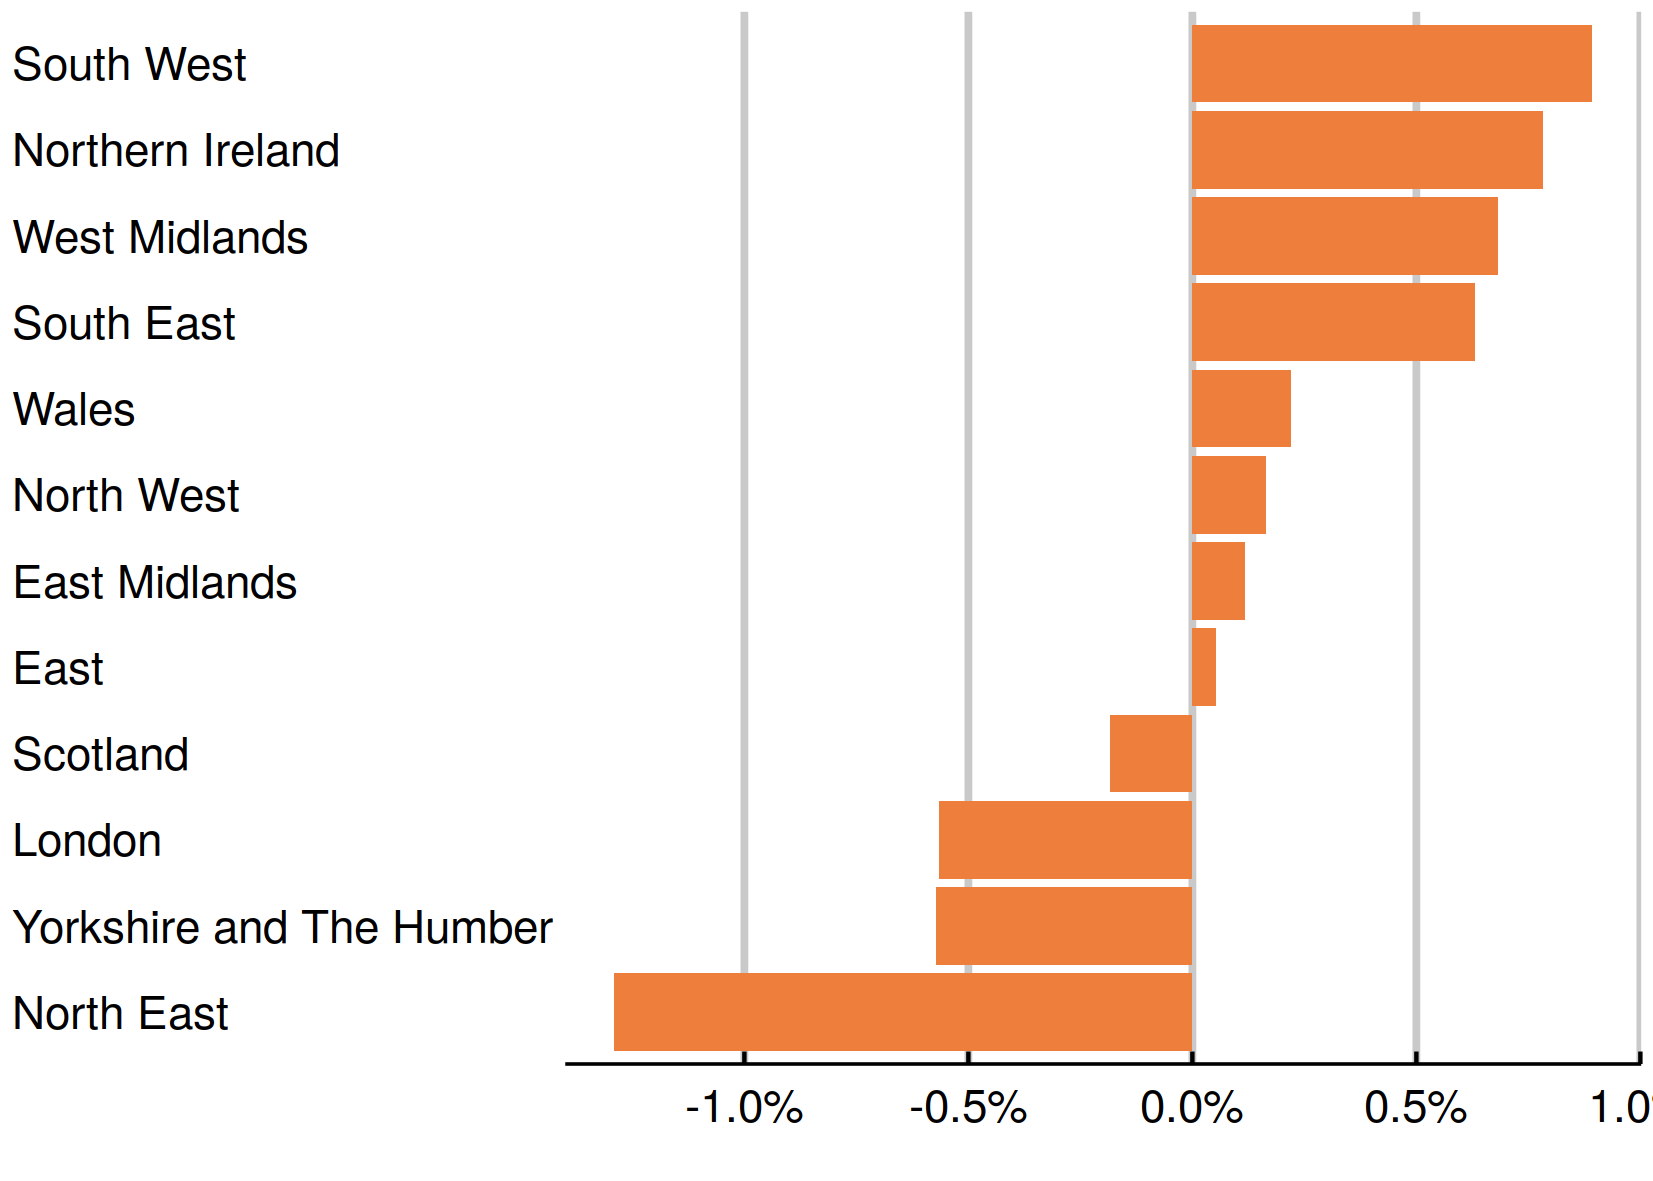 |
|
This newsletter is produced by Learning and Work Institute and keeps readers up to date on a wide range of learning and work issues.
If you have any questions, contact Paul Bivand
© 2020 Learning and Work Institute. All rights reserved.
Click here to unsubscribe | Click here to see a web copy of this email
 |